Telegraf Best Practices: SNMP Plugin
By
Jay Clifford /
Use Cases, Product, Developer
Jun 01, 2022
Navigate to:
Telegraf has now reached 300+ plugins and is deployed in a wide variety of use cases. In January we released a blog post covering the golden rules for creating configs and optimizing your Telegraf agent. It’s now about time we got our hands dirty covering some of the plugins the community uses the most.
In this post, we are going to cover the SNMP Input Plugin. I sat down with one of our Telegraf Maintainers, Thomas Casteleyn (Hipska), to discuss his best practices when working with the SNMP Input Plugin. Thomas is one of our most prolific users of the SNMP plugin, collecting metrics from thousands of devices and systems for his customers. With his help, my aim is to provide you with some helpful tips and tricks to go from zero to hero!
What is the SNMP Input Plugin?
If you are reading this blog you probably already know what SNMP is, but let’s level-set for everyone. Here are the facts:
- SNMP stands for Simple Network Management Protocol.
- Been around since 1988 (It has stood the test of time and won’t be going anywhere soon).
- The protocol was introduced to meet the demands of monitoring and managing IP devices.
- Example devices: routers, switches, firewalls, load balancers, servers, and CCTV cameras are just a few examples.
- There are three versions of SNMP (1, 2c & 3). It's worth knowing this as depending on the manufacturer and the age of your device, you could have a mix.
- V1 and 2c use a community string. V3 requires a username and password. V3 also provides encryption capabilities.
- Ports: SNMPv3 161, 162 (trap) | SNMPv3 secure 10161, 10162 (trap)
If you would like more information on what SNMP is, then I highly recommend checking out this video by CertBros.
Within Telegraf, we have two SNMP based plugins:
- SNMP - Uses polling to gather metrics from SNMP agents. It supports the collection of individual OIDs and entire SNMP tables.
- SNMP Trap - Service input plugin which receives traps and informs requests. Samantha Wang released an awesome blog to get started with the SNMP Trap plugin. I highly recommend checking it out, as we will be covering the SNMP plugin.
The basics
Let’s start by covering some of the basics. For this example, we are going to use Telegraf to collect metrics from a Windows 10 VM:
[[inputs.snmp]]
  ## Agent addresses to retrieve values from.
  agents = ["udp://127.0.0.1:161"]

  ## Timeout for each request.
  timeout = "15s"

  ## SNMP version; can be 1, 2, or 3.
   version = 2

  ## SNMP community string.
   community = "public"

  ## Number of retries to attempt.
  retries = 1

  [[inputs.snmp.field]]
    oid = "SNMPv2-MIB::sysUpTime.0"
    name = "uptime"
   conversion = "float(2)"

  [[inputs.snmp.field]]
    oid = "SNMPv2-MIB::sysName.0"
    name = "source"
    is_tag = true

  [[inputs.snmp.table]]
    oid = "HOST-RESOURCES-MIB::hrStorageTable"
    name = "hrStorageTable"
   inherit_tags = ["source"]
Full Telegraf config can be found here.
Let’s break it down:
- agents - a list of SNMP agents (SNMP enabled devices) you would like to monitor. In most cases, your agent port will be 161.
- timeout - I am highlighting this in bold as we will discuss it later. This parameter tells Telegraf how long to wait for a reply from an agent.
- version - The version of SNMP your agent is running. Most Windows agents will run version 2 (2c) as a default.
- community - Essentially the password for the SNMP agent. Within Windows, you can define the SNMP community string. Note that Telegraf will fail to receive any response from the agent when not using the correct community string.
- retries - the number of times Telegraf will attempt to poll an agent should the request timeout.
Now that we have our initial SNMP plugin parameters set up, let’s start requesting some metrics from our agent. In our case we want to know the following:
- The uptime of the agent
- The agent's name
- The storage metrics of our agent
To acquire these metrics, one method is to directly access the field containing the value like so:
[[inputs.snmp.field]]
    oid = "SNMPv2-MIB::sysUpTime.0"
    name = "uptime"
  conversion = "float(2)"

  [[inputs.snmp.field]]
    oid = "SNMPv2-MIB::sysName.0"
    name = "source"
    is_tag = true
In this instance, we are directly referencing the OID (Object Identifier) for both the system uptime and the system name. Note that is_tag allows us to turn the returned value into a metric tag. The conversion for the uptime field is done because the uptime is reported in hundreds of seconds.
The second method available to us is by referencing a table containing the fields we wish to collect:
[[inputs.snmp.table]]
    oid = "HOST-RESOURCES-MIB::hrStorageTable"
    name = "hrStorageTable"
    inherit_tags = ["source"]
Similar to direct field referencing we specify the OID for the table. We can then provide a measurement name for the table. Lastly, inherit_tags allows our table to adopt the tag of another field. It makes sense to use the system name once again, which is named “source”.
Best practices, tips & tricks
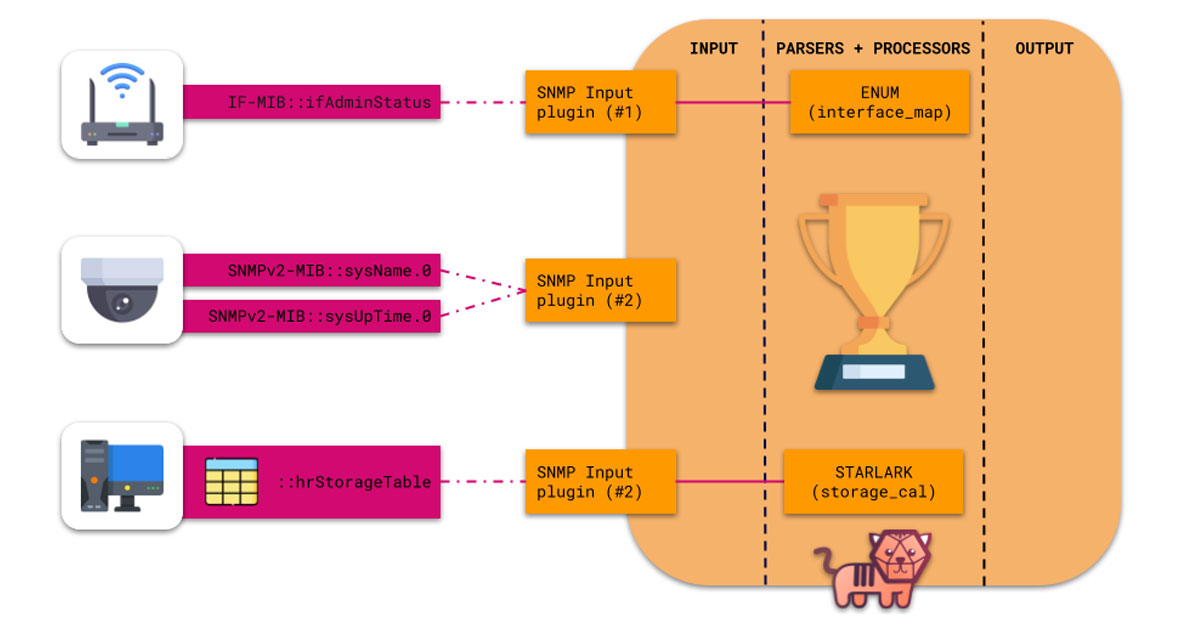
Okay, so we now know what SNMP is and set up a basic example using the Telegraf SNMP plugin. That’s enough information to be dangerous but is it manageable at scale? Thomas gave me some great rules to follow when building out my Telegraf SNMP configs. In this next section, we will break them down into actions you can take directly on the SNMP plugin and then on the metrics after using processor plugins.
SNMP Plugin
Fields vs tables:
Where possible, specify fields directly rather than tables. Within SNMP tables there can be arbitrary fields (like metadata) which do not require monitoring at each interval. This can make requests in general slower to return results.
There are scenarios where pulling full tables makes sense to save time and improve config readability. It is worth noting that it can take up to 1 minute for some devices to return large SNMP tables back to Telegraf. You should make sure to increase your timeout parameter appropriately.
Divide and conquer:
It is worth creating one SNMP Input Plugin for each device you are monitoring rather than grouping them into a single plugin.
For example:
# Local Device
[[inputs.snmp]]
  ## Agent addresses to retrieve values from.
  agents = ["udp://127.0.0.1:161"]

  ## Timeout for each request.
  timeout = "5s"

  [[inputs.snmp.table]]
    oid = "HOST-RESOURCES-MIB::hrStorageTable"
    name = "hrStorageTable"
   inherit_tags = ["source"]

# Remote device known to be slow
[[inputs.snmp]]
  ## Agent addresses to retrieve values from.
  agents = ["udp://192.168.1.5:161"]

  ## Timeout for each request.
  timeout = "60s"

  [[inputs.snmp.table]]
    oid = "HOST-RESOURCES-MIB::hrStorageTable"
    name = "hrStorageTable"
   inherit_tags = ["source"]
Within the logic of the SNMP plugin, metrics will only be processed once all sources have returned a reply. Essentially in this case, you are as slow as the slowest agent. It also means if one agent fails to send back a reply within the given time period, the SNMP plugin will enter a retry cycle (depending on your configuration) which will delay the next round of collection (for all the agents of the same SNMP plugin) until the retry cycle has been completed.
Separating into individual plugins decouples agents from one another. This allows agents with faster response times to be processed first and also improves the overall durability of your solution. Due to the minimal footprint of Telegraf, creating more plugins will not significantly increase the agent overhead on your system.
Useful metadata:
When subscribing to equivalent fields and tables from multiple devices, it’s important to be able to distinguish the metrics for further processing/querying. Here are some important tags you could include:
Primary:
- System Name (SNMPv2-MIB::sysName.0)
- Hostname
Optional:
- Location (SNMPv2-MIB::sysLocation.0)
- Technology provider / Type
Metrics vs metadata:
Fields found within SNMP tables can have a variety of uses. Some are useful to monitor over time. Others will remain static/linear unless manually updated or significant configuration occurs to the system; i.e. adding more storage to a device. It is down to you whether you decided to drop these fields altogether or included them as tags for filtering purposes.
A great example of this is ifAdminStatus vs ifOperStatus:
- ifAdminStatus - The desired state of the interface. In most cases, this won’t change unless reconfigured (Metadata).
- ifOperStatus - The current operational state of the interface. This is a noteworthy field to monitor as it will provide the current state of the agent's interface (Metric).
Processor plugins
Now that we have a good grasp of configuring our SNMP Input Plugin it’s time to share some clever post-processing of the metrics we gather. Below are configuration snippets to help with readability and value conversions:
Interface mapping:
Above we discussed useful metadata like ifAdminStatus. IfAdminStatus provides the desired state of an interface. In general, an interface can be placed into three main states:
- Up
- Down
- Testing
However, when we request the ifAdminStatus value we receive back the numerical value rather than the human-readable text. To change this we can use the Enum Processor Plugin:
[[inputs.snmp]]
  ## Agent addresses to retrieve values from.
  agents = ["udp://127.0.0.1:161"]

  [[inputs.snmp.field]]
    oid = "SNMPv2-MIB::sysName.0"
    name = "source"
    is_tag = true

  [[inputs.snmp.table]]
    oid = "IF-MIB::ifTable"
    name = "interface"
    inherit_tags = ["source"]
  [[inputs.snmp.table.field]]
      oid = "IF-MIB::ifAdminStatus"
      is_tag = true

# Translate tag values for interface table
[[processors.enum]]
  namepass = ["interface"]

  # Translate IF-MIB::ifAdminStatus
  [[processors.enum.mapping]]
    ## Name of the tag to map
    tag = "ifAdminStatus"

    ## Table of mappings
    [processors.enum.mapping.value_mappings]
      1 = "up"
      2 = "down"
      3 = "testing"
Full Telegraf config can be found here.
As you can see we use namepass to only process the measurement called interface. We look for our IfAdminStatus tag and then provide new mapping to the value contained (1 = “up”). Note that if a value is not within the mapping list then the tag will be processed with the original value.
Note: This is only needed when using the deprecated netsnmp translator. When using the newer and faster gosmi translator, this can be achieved with the following config:
[[inputs.snmp]]
  ## Agent addresses to retrieve values from.
  agents = ["udp://127.0.0.1:161"]

  [[inputs.snmp.field]]
    oid = "SNMPv2-MIB::sysName.0"
    name = "source"
    is_tag = true

  [[inputs.snmp.table]]
    oid = "IF-MIB::ifTable"
    name = "interface"
    inherit_tags = ["source"]
  [[inputs.snmp.table.field]]
      oid = "IF-MIB::ifAdminStatus"
      is_tag = true
      conversion = "enum"
Storage parsing:
Lastly, let’s discuss how we can use the Starlark Processor Plugin to derive alternative values for SNMP fields. A great example of this would be monitoring the hrStorageTable. Within this table there are three key fields we want to highlight:
- hrStorageAllocationUnits - The size, in bytes, of the data objects allocated from this pool.
- hrStorageSize - The size of the storage is represented by this entry, in units of hrStorageAllocationUnits.
- hrStorageUsed - The total amount of storage used. In units of hrStorageAllocationUnits.
As you can see hrStorageSize & hrStorageUsed directly relate to the value stored in hrStorageAllocationUnits. We can use this to derive the total amount of bytes for each:
[[inputs.snmp]]
  ## Agent addresses to retrieve values from.
  agents = ["udp://127.0.0.1:161"]

  [[inputs.snmp.field]]
    oid = "SNMPv2-MIB::sysUpTime.0"
    name = "uptime"
    conversion = "float(2)"

  [[inputs.snmp.field]]
    oid = "SNMPv2-MIB::sysName.0"
    name = "source"
    is_tag = true

  [[inputs.snmp.table]]
    oid = "HOST-RESOURCES-MIB::hrStorageTable"
    name = "hrStorageTable"
    inherit_tags = ["source"]

# Parse HOST-RESOURCES-MIB::hrStorageAllocationUnits
[[processors.starlark]]
  alias = "hrStorageTable_processor"
  namepass = ["hrStorageTable"]

  ## Source of the Starlark script.
  source = '''
def apply(metric):

	units = metric.fields.pop("hrStorageAllocationUnits", 0)

	if units and "hrStorageSize" in metric.fields:
		metric.fields["hrStorageSize"] *= units

	if units and "hrStorageUsed" in metric.fields:
		metric.fields["hrStorageUsed"] *= units

	return metric
'''
Full Telegraf config can be found here.
Wrapping up
So in summary here are the things to keep in mind when working with the SNMP plugin:
- Use fields over tables where it makes sense
- One SNMP agent per plugin
- Plugin timeout can trip you up with slow agents
- Some SNMP fields make great metadata tags rather than metric fields
We have also discussed some great processor plugin examples you can use to start shaping your SNMP data.
Learn more about collecting data with Telegraf by taking the free InfluxDB University Data Collection with Telegraf course.