What Happened to My Points?
By
Roger Peppe /
Product, Use Cases, Developer
Jan 27, 2022
Navigate to:
This article explores some of the ways that invalid data can be rejected when writing to InfluxDB and describes a new feature that makes it easier to know when and why that happens.
Syntax gone awry
Let’s write some data to the InfluxDB Cloud using the command-line influx tool:
% echo '
humidity,location=greenhouse value=85
temperature, location=house value=23
temperature, location=greenhouse value=10
' | influx write
Error: failed to write data: 400 Bad Request: partial write error (1 accepted): 2/3 points rejected; first error: at line 3:13: expected tag key after comma; got white space instead (check rejected_points in your _monitoring bucket for further information)
Oops, looks like we got that wrong! Luckily that error message, though somewhat intimidatingly long, tells us a lot about what happened. Let’s break it into sections:
Error: failed to write data: 400 Bad Request:
This tells us that the error has been returned from the server as a response to the HTTP request that was sent to write the data, and that the issue is the fault of the client, not something that went wrong on the server.
partial write error (1 accepted): 2/3 points rejected:
This tells us that not all of the data was bad. InfluxDB Cloud tries to accept as much of your data as it can. Here one of the points was OK, but the other two had an issue.
first error:
It’s possible to send many thousands of points in a single write. Rather than potentially returning thousands of error messages, it only returns the first one.
at line 3:13:
This tells us where in the input the problem was found: on column 13 of line 3. That points to the space after the comma after my_point.
expected tag key after comma; got white space instead
We had a space after the first comma, so it’s not valid syntax. (If you’re asking yourself, what exactly is valid line-protocol syntax, you’re in the right place: see later in this article for details).
(check rejected_points in your _monitoring bucket for further information)
The last part of the error is bringing your attention to a new feature: when points are rejected, information about the rejection is written to your organization’s _monitoring bucket under the rejected_points measurement. The information written will include information on all the rejected points, not just the first one.
In the next section, we’ll look into that in a bit more detail.
Monitoring rejected points
In the last section, we saw how the write endpoint returns information on the first syntax error that it encounters. It also writes some information to your _monitoring bucket that describes all the errors that have been encountered.
In the above example, it wrote the following data:
rejected_points,bucket=6355a1b5287f84c2,reason=parse\ error count=1,error="at line 3:13: expected tag key after comma; got white space instead"
rejected_points,bucket=6355a1b5287f84c2,reason=parse\ error count=1,error="at line 4:13: expected tag key after comma; got white space instead"
The bucket is the hex ID of the bucket that was being written to (you can find this out by looking for your bucket inside the “Load Data” tab in the Cloud 2 UI). The reason tag provides a general reason why the point has been rejected. The error field provides the syntax error that you saw earlier we can see that there are now two errors, one for each line. The count field can be used to easily sum numbers of rejected points across time.
As with all data written to the _monitoring bucket, this data will be retained for seven days.
Storing the rejected point information in a normal bucket makes it easy to use all the usual Influx tooling to keep track of how much this is happening. If there’s an erroneous client, you’ll be able to see it there.
Lost in transit
When line-protocol data is written, the API checks for syntactic validity, which is why the influx client was able to print the syntax error above, but not all errors are checked immediately. When a point enters InfluxDB Cloud, it’s added to a persistent queue but isn’t immediately integrated with the rest of the database. This is one of the reasons that it can be so efficient, but it also means that if a field is written that has a clashing type (for example, a string has been written instead of a float), the resulting error can’t be returned to the client, because the client has already been responded to.
Up until recently, this was a silent error. A point with a clashing field type was dropped without any indication to the user.
But now you can find out about these errors by looking in the _monitoring bucket, as for syntax errors.
Let’s try it. Here we’ll write a couple of points that have a string field value where we had previously written a float:
% echo '
humidity,location=greenhouse value="bad1"
humidity,location=greenhouse value="bad2"
humidity,location=greenhouse value=94
' | influx write
%
The write appears to succeed. However, if we look into the _monitoring bucket, we see that the following entries have appeared:
rejected_points,bucket=6355a1b5287f84c2,field=value,gotType=String,measurement=humidity,reason=type\ conflict\ with\ existing\ data,wantType=Float count=2
rejected_points,bucket=6355a1b5287f84c2,field=value,gotType=Float,measurement=humidity,reason=type\ conflict\ in\ batch\ write,wantType=String count=1
This is telling us that two points (count=2) have been rejected from the bucket with the humidity measurement because of a type conflict with existing data for the value field. Another point has been rejected because its field type clashes with the other points within the same batch even though that point (the third in the write) had technically the correct type for the bucket, the types of points within a single write must be consistent regardless of what’s currently stored, so it was rejected before the final type check.
Note that the location=greenhouse tag does not appear in the rejected point information. Only the field and the measurement do. The reason for this is to keep the cardinality of the rejected_point measurement under control we don’t want rejected points to end up using as much cardinality as if the data had been stored anyway!
Graphing it
In this section, I’ll describe a couple of queries that we’ve found useful to keep track of rejected points. You can use these as the basis for your own dashboards.
We can get some insight into the overall number of rejected points happening over time with a query like this:
from(bucket: "_monitoring")
  |> range(start: v.timeRangeStart, stop: v.timeRangeStop)
  |> filter(fn: (r) => r._measurement == "rejected_points")
  |> filter(fn: (r) => r._field == "count")
  |> group()
  |> aggregateWindow(every: v.windowPeriod, fn: sum, createEmpty: false)
  |> yield(name: "rejected points by reason")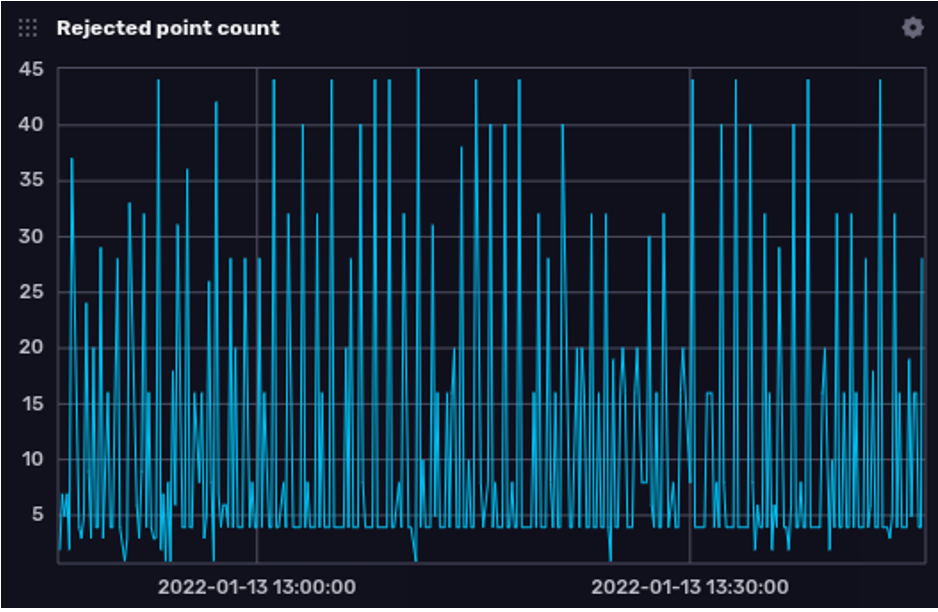
To get some insight into the underlying reasons highlighted in the graph above, here’s a query that summarizes the reasons for points being rejected:
from(bucket: "_monitoring")
  |> range(start: v.timeRangeStart, stop: v.timeRangeStop)
  |> filter(fn: (r) => r._measurement == "rejected_points")
  |> filter(fn: (r) => r._field == "count")
  |> keep(columns: ["reason", "_value"])
  |> group(columns: ["reason"])
  |> sum()
  |> rename(columns: {"_value": "count"})
  |> group()
  |> yield(name: "reasons")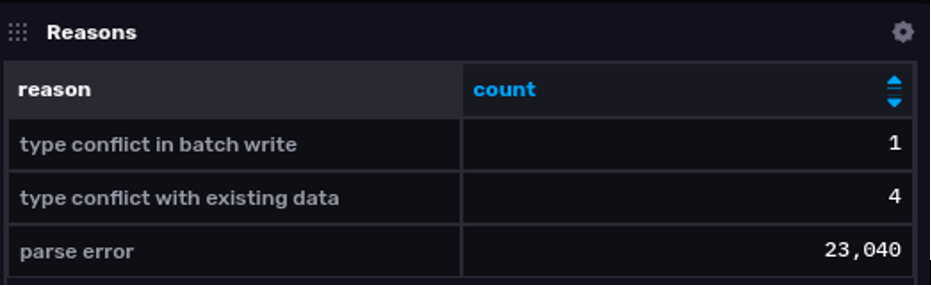
Line-protocol syntax defined
What is the syntax of the line-protocol format? It seems very simple on the surface, but the devil is in the detail, and until recently, the answer was “whatever the implementation says”, because the syntax was not precisely defined. We have the syntax reference and now we are very pleased to be able to share the new, formal Line Protocol definition document. We have written this document alongside the new Line Protocol parsing code to be accurate and as free from ambiguity as we can.
Some noteworthy clarifications of areas where different implementations or the documentation disagreed previously:
- Only the ASCII space character and an optional final carriage return counts as white space. Specifically, tab characters and form feed characters aren't allowed except within a string field value.
- A literal newline character is allowed within a string field value.
- All line-protocol data must be encoded as valid UTF-8.
- Measurements, tag keys, tag values and field keys may not contain non-printable ASCII (code points 0-31 and 127).
There is a new Go reference implementation that implements the new syntax: github.com/influxdata/line-protocol/v2/lineprotocol and a GitHub repository that features a large corpus of examples and their expected results: https://github.com/influxdata/line-protocol-corpus