Summary
AI agent observability means recording what your agents do (the models they call, the tools they use, the decisions they make, what each run costs, and how it turns out) so you can explain their behavior and improve it. You need that record because agents are unpredictable: the same request can take a very different path each time it runs, and result in variable costs. Start by collecting metadata such as token counts, cost, latency, tool success, and approvals—this answers most cost and security questions without storing any prompt content. OpenTelemetry is the common format for this data, and many agent frameworks and AI coding tools already export it.
Table of Contents
AI agents have moved from simple demos to being critical parts of daily work. An agent plans, calls tools, reads the results, and keeps going until it decides the task is done. That autonomy is useful, but it also makes it hard to know what an agent did and what it cost at scale.
This article covers what AI agent observability is, how it differs from application monitoring, which metrics to track, and best practices for getting started.
What is AI agent observability?
AI agent observability is the ability to see, measure and explain what an AI agent did during a task: which models it called, which tools it used, what it decided, how long it took, what it cost, and whether it succeeded. It gives you the record you need to debug a failed run, set budgets, answer audit questions, and compare versions of an agent.
Think of it as a flight recorder for every agent run. When a run goes wrong or costs more than expected, you can replay it step by step and see where it went off course.
Agent observability uses three kinds of signals:
- Events record each thing that happened, such as “the agent called a model” or “the agent ran a tool, and it failed.”
- Metrics are running totals and rates, such as tokens used per hour or tool failures per day.
- Traces show the timeline of a single task, with each step in order and how long it took.
Why AI agent observability matters
AI agents spend money and take actions on their own, and they rarely behave the same way twice. Without observability, cost overruns show up on the invoice and failures show up as user complaints. Risky actions may never show up at all.
Give the same agent the same request twice, and it may call different tools and use several times as many tokens as are needed. Running agents without visibility creates five kinds of risk: cost, reliability, security, compliance, and quality.
- A loop that retries a failing step, or a quiet switch to a more expensive model, can burn through a budget rapidly.
- Tools can fail silently while the agent still reports success, and rate limits can set off retry storms.
- Agents run commands and read files, often with a person’s credentials. Without a record, you can’t tell an auditor or an incident review what the agent did.
- When you change a model or a prompt, you can’t tell if the agent improved or got worse.
How is AI agent observability different from traditional monitoring?
Traditional monitoring asks whether a system is up and running fast. AI agent observability also asks what the agent decided, why, how much it cost, and whether it achieved its goal.
| Dimension | Traditional monitoring (APM) | AI agent observability |
|---|---|---|
| Unit of work | A request | A task, session, or conversation |
| Path through the system | Predictable, defined by code | Different on each run, chosen by the model |
| Cost | Mostly fixed infrastructure | Per token and per call; varies by run |
| What counts as failure | Errors and timeouts | Includes wrong answers, loops, and unsafe actions |
| Key signals | Latency, errors, throughput | Includes tokens, tool calls, approvals, and outcomes |
| Data sensitivity | Mostly metadata | Prompts and tool inputs can contain secrets, code, or personal data |
Application monitoring rarely captures what a user typed. Agent telemetry can, so decide what to collect before you turn it on.
Which AI agent metrics should you monitor?
There are six primary agent metrics to monitor: cost and tokens, performance, reliability, behavior, safety, and outcomes. The first five describe what the agent did; outcomes tell you whether it was worth doing.
| Category | Example metrics | Question it answers |
|---|---|---|
| Cost and tokens | Tokens by type (input, output, cache reads, and writes), cost per run, cost per successful task | Where is the money going? |
| Performance | End-to-end task time, time to first token, model and tool latency | Is it fast enough? |
| Reliability | Tool success rate, API errors and rate limits, retries, repeated actions | What breaks, and how often? |
| Behavior | Steps per task, which tools are used in what order, context size | How does the agent work through a task? |
| Safety and governance | Approvals and denials, permission changes, access to sensitive files, new tools or integrations | Did it do anything it shouldn't have? |
| Outcomes | Task completed, ticket resolved, pull request merged, user rating, evaluation score | Did it actually help? |
Aim for cost per successful outcome. A cheaper model that fails half its tasks can end up costing more per success. Tie each run to a result, such as a resolved ticket or a merged pull request, and divide spend by successes.
Many providers bill cached input at a different rate so for long-running agents, cache reads and writes can make up a large share of the bill. A falling cache hit rate can be an early sign that costs are about to rise.
Types of AI agents (and what to watch for)
Customer-Facing and Chat Agents
These agents hold multi-turn conversations and failures often appear several turns in, so measure whole conversations as well as single responses. Track resolution rate and escalations to a human, flag conversations that loop or stall, and score the quality of a sample.
Workflow and Back-Office Agents
These agents process documents, update records, and move work between systems. They behave like services so error budgets and throughput still apply. Add time and cost per item processed and watch for failures in the downstream systems the agent writes to.
AI Coding Agents
AI coding agents such as Claude Code, OpenAI Codex, and OpenCode can run shell commands on developer machines with the developer’s credentials, and their cost grows with each engineer who adopts them. Several of these tools can export OpenTelemetry with a few settings, so the data is easy to collect.
Things to watch: - Cost per developer, team, repository, and merged pull request - Commands run and files touched for security review - Tool failures and repeated retries, which often point to missing documentation or setup problems - Permission changes such as switching to a mode that skips approval prompts
Multi-Agent Systems
When agents hand work to other agents, failures can cascade while added expenses hide inside sub-tasks. Track which sub-agent used the budget, where hand-offs failed, and measure success for the overall task as well as for each piece.
Common use cases for AI agent observability
Cost Control and Forecasting
Break spend down by team, project, model, and task type. Set team budgets and forecast when you’ll hit a monthly limit while there’s still time to act.
Catching Runaway Agents
An agent stuck retrying a failing step can spend hundreds of dollars before anyone notices. Alerting on spend spikes or repeated failures can flag it within seconds.
Security and Audit Trails
Keep a time-ordered record of the commands agents ran, the files and services they touched, the permissions they had, and when those permissions changed. This data answers incident questions and supports compliance reviews. It can also surface signs of prompt injection, like an agent suddenly sending data to an unfamiliar destination.
Debugging and Root Cause Analysis
When a run goes wrong, a trace shows each step so you can see where the agent misstepped and whether that was the result of a bad search or a failed tool call.
Quality and Continuous Improvement
Track evaluation scores and outcome rates over time. When you change a model or a prompt, you can compare results from before and after.
Capacity and Provider Health
Watch for rate limits and provider slowdowns. If you host your own models, include GPU and model-server metrics so you can tell whether a slow agent has a model problem or an infrastructure problem.
Challenges of AI agent observability
The main challenges are noisy baselines, privacy, tool fragmentation, and connecting activity to business outcomes.
- Normal variation between runs is wide, so alerts need sensible thresholds and enough history behind them.
- A single task can generate hundreds of events. Plan for sampling and tiered retention.
- Prompts and tool inputs can contain secrets and personal data. Collecting everything “just in case” creates a new store of sensitive data to protect.
- Frameworks and agent tools name the same things differently, so data needs normalizing before you can compare tools.
- Whether a task succeeded is often recorded in a ticketing system or a code repository, outside the agent’s telemetry.
- Testing two agent configurations against each other means paying for every run and noisy results need many runs.
What role does OpenTelemetry play?
OpenTelemetry is the open, vendor-neutral standard for collecting traces, metrics, and logs. Its GenAI semantic conventions define common names for model calls, agents and tool executions, so data from different agents can land in the same place and mean the same thing.
With OpenTelemetry, you instrument once and send data wherever you like (a tracing tool, a database or both) without rewriting instrumentation when you change vendors. Many agent frameworks and AI coding tools now export it directly.
You have two broad choices. Framework-native tracing, built into an agent framework or platform, is usually the fastest way to start. OpenTelemetry is better for portability, for mixing tools from different vendors, and for teams that already run an OpenTelemetry pipeline.
The GenAI conventions are still evolving, so expect some names to change, and choose tools that keep up with the specification.
Where InfluxDB and Telegraf fit in AI agent observability
Telegraf can collect and process agent telemetry using the OTEL plugin, alongside the rest of your infrastructure data; InfluxDB 3 stores that data and can act on it in real-time with the Python processing engine. Together they form an operations layer for AI agent observability, covering cost, alerting, and trends that correlate with the agents they depend on.
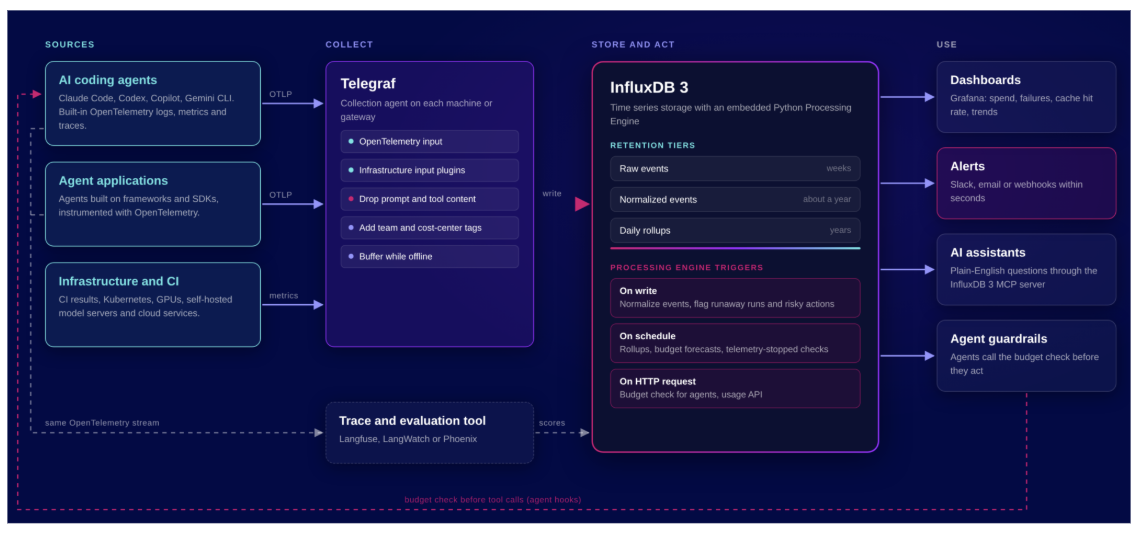
Agent activity is a stream of time-stamped events, which is the kind of data InfluxDB is built to handle efficiently. Here are a few specific examples of how Telegraf and InfluxDB can be used for AI agent observability:
- Telegraf receives OpenTelemetry data from agent frameworks and AI coding tools. It can drop sensitive fields and add team or cost-center labels before data leaves the machine, and it holds data while a laptop is offline.
- The InfluxDB 3 Processing Engine runs Python inside the database as data arrives, on a schedule, or when called over HTTP. Use it to flag runaway workflows and cost spikes within seconds, or to give agents a budget check they can call before they act.
- Keep detailed events for a few weeks and compact daily summaries for years, so cost and token reports stay fast and inexpensive over time.
- Telegraf already collects metrics from CI systems, Kubernetes, GPUs, self-hosted model servers, and cloud services. With agent activity in the same database you can see whether a slow agent has a model problem or an infrastructure problem.
- The same data gives you an audit trail of tool use, permission changes, and unusual activity, plus alerts when telemetry from a machine stops arriving.
- Evaluation scores from tracing and evaluation tools such as Langfuse, LangWatch, or Phoenix can be written into InfluxDB so quality sits on the same charts as cost and latency.
- The InfluxDB 3 MCP server lets AI assistants query your agent data in plain English. InfluxDB and Telegraf are meant to run alongside a trace viewer or evaluation platform, as the operations layer. Both sides speak OpenTelemetry, so you can send the same data to each.
Best practices for AI agent observability
- Default to metadata, make content collection opt-in, and redact sensitive fields on the machine before data leaves it.
- Report at team level so the data helps teams budget and improve.
- Tie every run to an outcome. Cost and activity mean little without knowing whether the task succeeded.
- Keep detailed events short-term and summaries long-term.
- If volume is high, sample routine traffic, but keep every error and every unusually expensive run.
- Re-check vendor telemetry docs regularly, because agent tools change their fields and defaults often.
How to get started with AI agent observability
Starting small is best: pick one agent and one question, turn on the telemetry it already has, collect metadata only, and build a few views and one alert. Add depth once the basics are paying off.
- Pick one agent and one question, such as “What is our coding agent costing per team?” or “How often does our support agent fail to resolve a ticket?”
- Turn on built-in telemetry. Many frameworks and tools export OpenTelemetry, and it usually takes a few settings.
- Decide what not to collect. Start with counts, models, tokens, durations, tool names, and success or failure. Leave prompt and response content off unless you have a clear reason and a policy for it, and strip sensitive fields at the source.
- Route telemetry through a collector into a database you can query and keep for as long as you need it.
- Build a few views, such as spend by model and team, the tools that fail most, cache hit rate, and runs that went over budget.
- Add one alert and one outcome signal. For example, alert when a single run passes a cost threshold, and record whether each task succeeded.
You may not need full observability yet if your application makes a single model call per request at low volume. Basic logging and your provider’s usage dashboard can be enough. Once an agent chains several tools, or someone other than its author has to debug it, it’s worth setting up proper observability.


