TECH PAPER
Why Time Series Matters
for Metrics, Real-Time and Sensor Data
Using time as a primary axis for measurement has deep roots in science, engineering, and (more recently) financial markets. As instrumentation and sensor costs have fallen, organizations have instrumented nearly everything—from servers and applications to networks and the physical world. Time series has emerged as the de facto model for storing, retrieving, and analyzing this data in real-time and over history.
This paper will:
- Define what time series data is (and what it isn’t).
- Explain how the time series data domain differs from more traditional data workloads like online transaction processing database (OLTP).
- Examine what makes the InfluxData platform different from other proposed solutions.
What is time series?
Time series are simply measurements or events that are tracked, monitored, downsampled, and aggregated over time. Examples include average daily temperature, IIoT metrics, network telemetry, satellite instrumentation, website clicks, and financial market ticks.
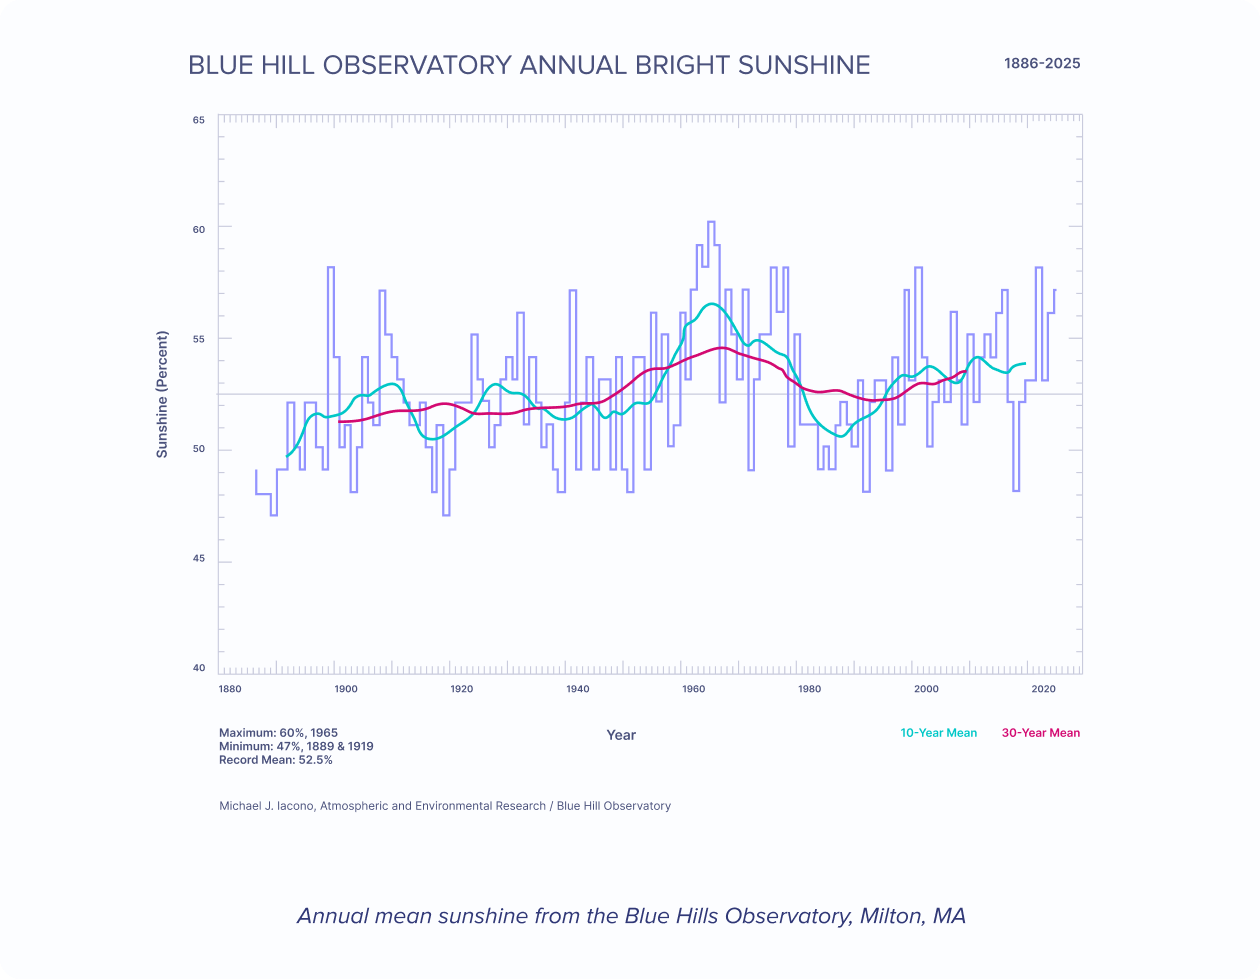
The defining feature of time series data is that it captures how a measurement changes over time. A simple way to determine if you’re working with a time series dataset, is to determine if one of your axes is time. Below are a few examples of time series data plotted on graphs:

Time series data appears in two forms: regular and irregular.
- Regular time series consist of measurements collected at regular intervals (every 10 seconds, for example). These are commonly referred to as metrics.
- Irregular time series consist of events generated by users, systems, or external stimuli, such as website clicks, financial market ticks, or application requests. These events occur whenever something happens, not on a fixed schedule.
Irregular time series are often transformed into regular representations through time-based aggregation. For example, individual request events can be summarized into one-minute average response times, or financial ticks can be aggregated into ten-minute average prices. The underlying data remains event-driven, but the analytical view becomes regular.
InfluxDB is designed to support both event-driven and metric-driven time series workloads. Many services and time series databases focus exclusively on regularly sampled metrics, limiting their ability to store and analyze raw, high-precision event data. In contrast, InfluxDB allows users to ingest, store, query, and analyze both raw events and aggregated metrics within the same system in real time.
The InfluxDB platform organizes time series in a structured format. At the top level is a measurement name, followed by a set of key/value pairs called tags that describe the metadata, followed by key/value pairs of the actual values called fields. Field values in InfluxDB can be boolean, int64, float64, or strings. Finally, there is a timestamp for the set of values. All data is queried by measurement, tags, field and time.

How InfluxDB organizes time series data
This structure makes it easy for developers to build tools around the APIs that InfluxData provides. Unlike relational or document databases, InfluxDB organizes time series data into a set structure. This structure is also what sets InfluxDB apart from other solutions. The richness of this data structure opens InfluxDB up to more time series and metrics use cases.
Time Series Data Workload Patterns
Time series workloads fall into three overlapping patterns:
Operational time series workloads
Focus on observing system state and responding to conditions in real-time. They prioritize low-latency ingestion and query, high-resolution data, short retention windows, and rapid detection of anomalous behavior. Responses in these systems are typically driven by predefined rules, thresholds, and alerts, and are often mediated by human operators or fixed automation.
Analytical time series workloads
Focus on understanding system behavior over longer time horizons. They prioritize aggregation, downsampling, long-term retention, and efficient scans across large time ranges. These workloads support trend analysis, capacity planning, performance evaluation, and post-incident investigation.
Digital engineering workloads
Connect analytical insight back into real-time systems. They embed the outputs of historical analysis, including models, learned thresholds, forecasts, and behavioral baselines, directly into low-latency execution paths. These workloads enable adaptive, model-driven decision-making and closed-loop control, allowing systems to continuously refine behavior based on observed outcomes.
These three workload patterns can be characterized as reactive, interpretive, and adaptive.
Most real-world systems require all three workload patterns. Data is first observed in real-time to detect anomalies and prevent unplanned disruptions. That same high-resolution data is aggregated and retained for analytical use, enabling investigation of past events, post-incident analysis, and the training and calibration of physical AI and control models. Over time, the analysis results are fed back into operational and digital engineering systems to refine thresholds, inform decisions, and drive automation.
There’s a fundamental reason why high-resolution time series data has become foundational across modern digital and physical systems: accurate observation depends on sampling at sufficient resolution. When measurements are captured too coarsely, for example, at seconds rather than milliseconds, meaningful system behavior is aliased or lost, limiting the effectiveness of operational monitoring, analytical discovery, and adaptive control. This constraint is especially pronounced in physical AI systems, where models are trained and executed against real-world signals from sensors, actuators, and control loops. As systems have grown more complex and dynamic, metrics, events, and other time-ordered data are generated continuously to preserve observability and to support model training, validation, and closed-loop decision-making. Supporting these workloads requires a real-time data pipeline that can ingest, store, analyze, and act on high-resolution time series data efficiently and at scale.
InfluxData provides tools to collect, store, analyze, and act on time series, supporting operational, analytical, and digital engineering workloads within a single system.
The following sections illustrate how these workload patterns appear in practice across common domains. These examples are representative, not exhaustive.
Digital Infrastructure (DevOps, APM, Kubernetes, Networks)
Digital infrastructure systems generate high-volume, high-cardinality telemetry across servers, virtual machines, containers, applications, and network devices. Although these systems are software-defined rather than physically constrained, they still require reactive, interpretive, and adaptive workloads.
Operational workloads focus on real-time visibility into system health, latency, throughput, error rates, and resource utilization. Alerting, anomaly detection, and incident response depend on low-latency ingestion and query across distributed environments. Analytical workloads aggregate metrics, logs, and traces across longer time horizons to establish performance baselines, perform capacity planning, identify regressions, and conduct post-incident analysis. Digital engineering workloads embed learned baselines, scaling heuristics, and behavioral models into automation systems. Examples include adaptive autoscaling in Kubernetes, dynamic traffic routing, automated remediation workflows, and policy-driven infrastructure adjustments.
Many organizations begin by deploying InfluxDB for DevOps monitoring—tracking servers, containers, and network hardware. Over time, the platform expands to support broader real-time analytics and application-facing workloads, becoming a unified system for metrics, events, and time-ordered data across the enterprise.
Real-Time Analytics Applications
Real-time analytics systems capture time-ordered business, application, sensor, and behavioral data streams that evolve continuously. These systems power user-facing applications, internal dashboards, operational intelligence, and embedded analytics experiences.
Operational workloads focus on low-latency ingestion and query to support live dashboards, in-product analytics, streaming KPIs, and real-time decision support. Users expect current-state visibility without delay, often under high concurrency.
Analytical workloads aggregate and retain historical data to support trend analysis, cohort evaluation, forecasting, experimentation analysis, and model development. These workloads require efficient scans across large time ranges and downsampling strategies to balance resolution with cost.
Digital engineering workloads embed forecasts, learned thresholds, personalization models, and optimization logic directly into application execution paths. These workloads enable dynamic pricing, recommendation systems, adaptive user experiences, and automated decision-making based on continuously observed data.
In mature deployments, real-time analytics systems evolve from standalone dashboards into foundational data layers that unify observability, product telemetry, and operational intelligence across the organization.
Battery Energy Storage Systems (BESS)
Battery energy storage systems generate high-resolution telemetry across electrical, thermal, and mechanical domains, including voltage, current, frequency, state of charge, state of health, and temperature. These signals are sampled continuously to support real-time monitoring, fault detection, and compliance with grid-level control requirements.
Operational workloads focus on detecting unsafe operating conditions, enforcing protection thresholds, and supporting operator visibility. Analytical workloads aggregate and retain historical telemetry to model degradation, optimize charge and discharge strategies, and evaluate performance under varying load and environmental conditions.
Digital engineering workloads close the loop by feeding learned models and thresholds back into control systems, enabling adaptive behavior such as predictive maintenance, dynamic dispatch, and automated response to grid events, including opportunistic charge and discharge decisions that optimize revenue based on real-time pricing and grid conditions.
Satellite Telemetry and Control (TTC)
Satellite telemetry and control systems operate under strict constraints on latency, bandwidth, and reliability. Telemetry streams capture power, thermal, attitude, propulsion, and subsystem health data, while command and control systems rely on accurate, time-ordered state to safely execute maneuvers and configuration changes.
Operational workloads emphasize real-time situational awareness, anomaly detection, and command verification during contact windows. Analytical workloads retain and aggregate telemetry across orbits and missions to understand long-term behavior, diagnose prior events, and validate models of spacecraft performance. Digital engineering workloads use these models to inform autonomous decision-making, fault recovery, and adaptive control strategies, particularly in scenarios where ground intervention is delayed or unavailable.
Industrial Internet of Things (IIoT)
Industrial IoT systems instrument physical processes across manufacturing, oil and gas, transportation, and infrastructure. Sensors continuously emit time-ordered measurements describing pressure, flow, vibration, temperature, and other process variables that evolve on timescales dictated by the underlying physics.
Operational workloads support real-time monitoring, alarm evaluation, and enforcement of safety limits. Analytical workloads aggregate high-resolution sensor data to understand process variability, identify inefficiencies, and support root-cause analysis. Digital engineering workloads integrate analytical insight directly into industrial control systems, enabling adaptive setpoints, predictive maintenance, and closed-loop optimization.
Unlike consumer IoT, IIoT systems are tightly coupled to physical processes. Undersampling, data loss, or delayed analysis can obscure true system behavior and lead to incorrect conclusions or unsafe operation. As a result, preserving high-resolution, time-ordered data is a fundamental requirement for both analysis and control.
The Challenges of Time Series Management
Managing time series is challenging because a single platform must support multiple workloads. Each workload imposes different, and often competing, demands on ingestion, query behavior, data retention, and execution.
Operational Workload Challenges
Operational workloads are defined by immediacy and volume. To accurately reflect system behavior, data must often be captured at high temporal resolution, ranging from once per second to many times per second or even at sub-millisecond intervals. At these rates, even a single time series can generate very large volumes of data over short periods.
At the same time, to provide a clearer and more complete picture of system behavior, organizations have increased the number of sensors monitoring their manufacturing lines, satellites, and other assets. From an operational perspective, this means tracking and recording an increasing number of unique time series (i.e., high cardinality).
Taken together, high sampling rates per series and a growing number of concurrently active series create sustained, system-wide ingestion pressure. Operational systems must continuously accept large volumes of data across many independent streams, without backpressure, dropped measurements, or loss of temporal correctness. This is further complicated by the fact that some data may arrive late or out of order, particularly from edge devices.
Once this data has been captured, it must be served immediately to dashboards and other operational systems with low, predictable latency, so teams can maintain accurate situational awareness and respond in real-time.
Analytical Workload Challenges
Analytical workloads focus on understanding system behavior over long time horizons. They rely on historical time series data to explain past events, characterize variability, and identify relationships within a system.
The core challenge is that analytical queries must operate across large time ranges and many independent series at the same time. Queries frequently scan months or years of data and compute aggregates such as averages, percentiles, or distributions. As systems become more finely instrumented, meaningful analysis increasingly requires combining data from many distinct series to test hypotheses or evaluate competing explanations, forcing repeated large-range scans and aggregation over substantial volumes of time-ordered data.
Analytical complexity is compounded by the fact that series are often not naturally aligned.
Data may be sampled at different rates, emitted by different subsystems, or arrive late or out of order. Before meaningful analysis can occur, series must be aligned in time and reduced to comparable representations. Aggregation and downsampling are therefore required not just for efficiency, but to make cross-series analysis possible at all.
From a database perspective, analytical workloads must also tolerate backfills, where historical data is ingested with timestamps in the past and arrives out of order relative to current writes.
Taken together, long-range scans, cross-series aggregation, temporal alignment, and out-of-order ingestion are what make time series analytics difficult to support efficiently and predictably at scale.
Digital Engineering Workload Challenges
Digital engineering workloads close the loop between observation and action by applying logic, thresholds, or models directly to live data streams.
From a processing perspective, these workloads require ingestion, query, and execution to occur together on the critical path. Recent data must be read and evaluated as it arrives, often within strict latency bounds, while ingestion continues uninterrupted. Unlike dashboards or offline analysis, these workloads are sensitive to tail latency and execution jitter.
Digital engineering workloads also impose stronger requirements on time correctness and determinism. Decisions may depend on precise ordering and window semantics, and inconsistent or delayed execution can lead to incorrect or unstable behavior.
Supporting this combination of continuous ingestion, immediate evaluation, and predictable execution places additional constraints on how time series systems process data.
What Makes InfluxDB Different?
We are often asked what makes InfluxDB different from other technology solutions. Generally, the answer can be organized into three categories: applications, databases, and stream processing systems. In the next few sections, we’ll look at various solutions within these categories.
InfluxDB is designed to handle high-velocity, high-resolution data streams with low latency
The InfluxDB Ecosystem
The InfluxData open source time series platform consists of two main components: InfluxDB and Telegraf. These tools work together to simplify collection, storage, and analysis of your time series data. The most important part of the platform is that InfluxDB makes it easy to integrate with external tools and services for data visualization, forecasting, automation, and more—essentially anything you’d want to do with your time series data. Let’s take a look at what Telegraf and InfluxDB can do and some of the tools they integrate with.
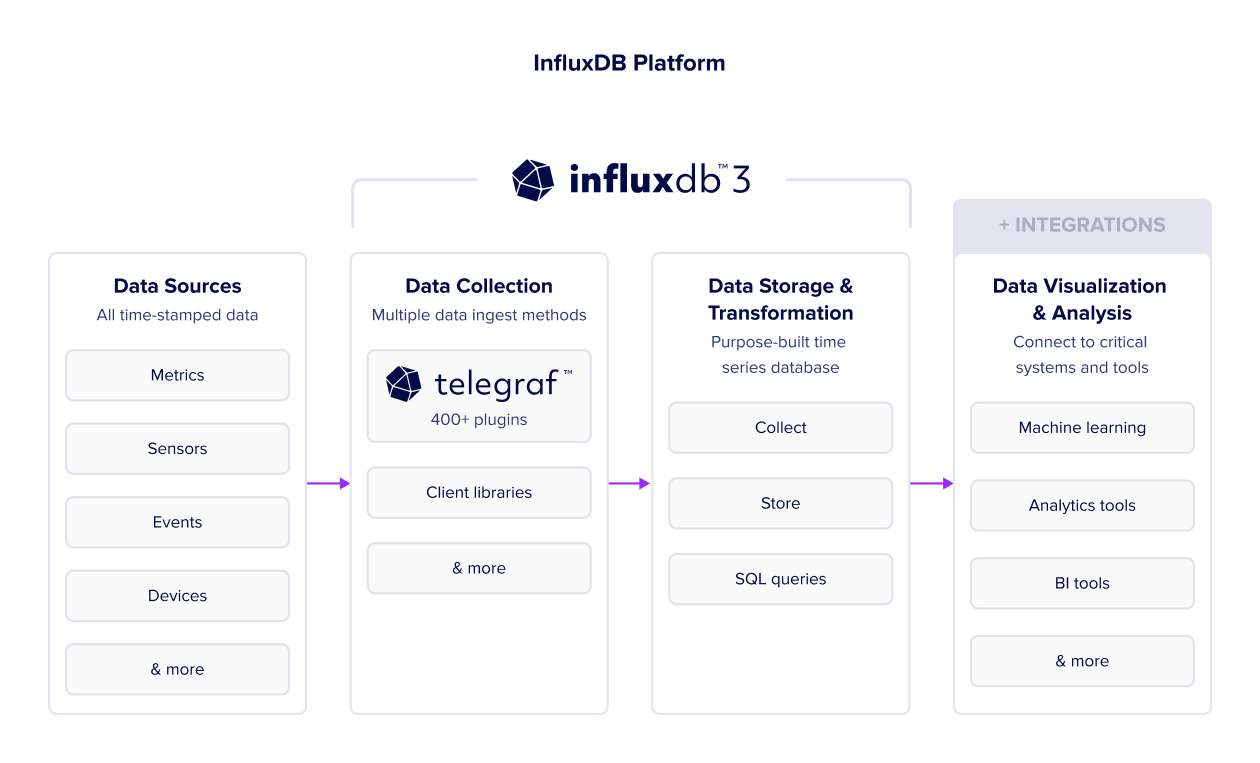
Telegraf
Telegraf is the data collection component in the InfluxData ecosystem, designed to gather metrics from a variety of sources and write them into InfluxDB. It’s a plugin-driven server agent that can collect data from a wide array of sources and communication protocols.
One of the key advantages of Telegraf is its extensibility; its plugin system supports inputs, outputs, processors, and aggregators, allowing you to tailor Telegraf to meet the specific needs of your infrastructure. Currently, there are over 400 plugins available. Seamless integration between Telegraf and InfluxDB lets you collect just about any metric you need, transform it as needed, and store it efficiently and effectively in InfluxDB. Telegraf can also be used to tie together different storage systems for situations where you have data that isn’t a good fit for a time series database.
InfluxDB
InfluxDB is the core database responsible for storing and analyzing time series data in the InfluxData ecosystem. It is designed to handle high-velocity and high-resolution data streams with low latency, making it especially well-suited for applications that require real-time analytics.
InfluxDB is built on open standards like Apache Arrow for in-memory data representation, Apache DataFusion for its query engine, and FlightSQL for data transfer.
Because of these design decisions, one of InfluxDB’s key strengths is its ability to integrate with best-in-class tools and services. InfluxDB supports both SQL and InfluxQL (a SQL-like query language), making it easier for users to get started.
InfluxDB also offers native HTTP APIs that allow for seamless integration with various external tools for data visualization, monitoring, alerting, and machine learning, among other tasks. For example, it can integrate with Grafana for advanced data visualization, Pandas for data analysis, and other tools that support SQL or standards such as JDBC. This makes InfluxDB not just a database but a vital part of a larger, flexible ecosystem designed to solve complex problems related to time series data.
The InfluxDB Data Model
The InfluxDB data model is quite different from that of other time series solutions like Graphite, Prometheus, or OpenTSDB. InfluxDB has a line protocol for sending time series data, which takes the following form:
<measurement>,<tag set> <field set> <timestamp>
The measurement name is a string, the tag set is a collection of key/value pairs where all values are strings, and the field set is a collection of key/value pairs where the values can be int64, float64, bool, or string. The measurement name and tag sets are kept in an inverted index, which makes lookups for specific series very fast.
For example, if we have CPU metrics:
cpu,host=serverA,region=uswest idle=23,user=42,system=12 1549063516
Timestamps in InfluxDB can be by second, millisecond, microsecond, or nanosecond precision. The micro- and nanosecond scales make InfluxDB a good choice for use cases in finance and scientific computing where other solutions would be excluded. Compression is variable depending on the level of precision the user needs.
On disk, the data is organized in a columnar format with contiguous blocks of time assigned for the measurement, tagset, and fieldset. There is no limit to the number of tags and fields that can be used. Other time series solutions don’t support multiple fields, which can bloat network protocols when transmitting data with shared tag sets. Most other time series solutions only support float64 values, so the user cannot encode additional metadata alongside the time series data.
InfluxDB vs. Other Databases
InfluxDB is often compared to other databases, typically distributed databases like Cassandra or more time series-focused databases like Prometheus or TigerData. However, when performing a comparison, the entire InfluxDB platform should be considered.
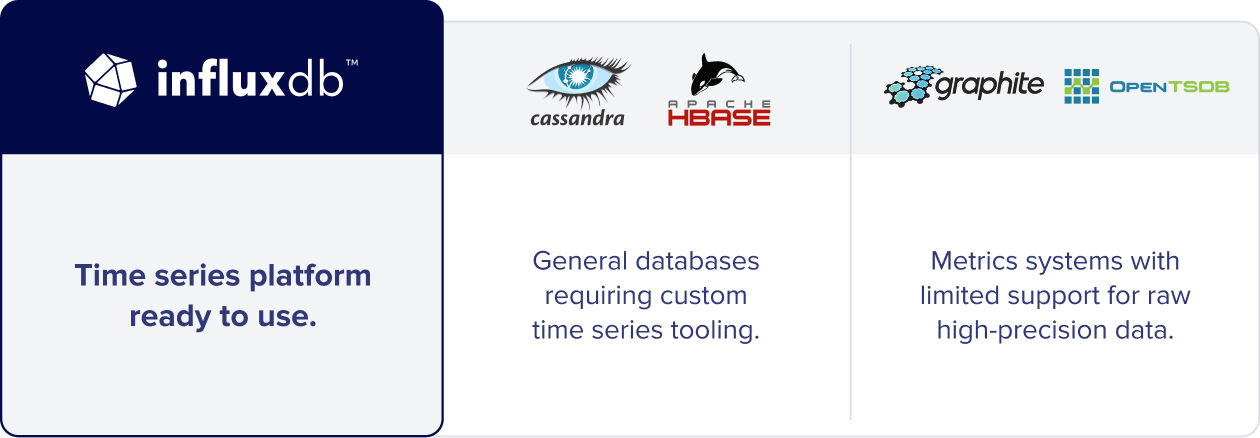
When comparing InfluxDB with Cassandra or HBase, there are some stark differences to note. First, those databases require a significant investment in developer time and code to recreate the functionality provided out of the box by InfluxDB. Specifically, developers will need to write code to shard data across the cluster, aggregate and downsample efficiently, handle data eviction and lifecycle management, and perform summarization. Finally, they’ll have to create an API to write and query their new service.
When the rest of the InfluxDB platform is taken into account, developers using more general-purpose databases have even more ground to make up. They’ll need to write tools for data collection, introduce a real-time processing system, and write code for monitoring and alerting. While some of these tasks are handled by other time series databases, there are a few critical differences. First, other time series solutions like Graphite or OpenTSDB are designed for regular time series data only and can’t store raw, high-precision data and downsample it on the fly.
When comparing the services designed for time series data that are available from major cloud providers like AWS, Google Cloud, or Microsoft Azure, developers choose InfluxDB for the following reasons:
Open source
InfluxData is, first and foremost, an open source company. It is committed to sharing ideas and information openly, collaborating on solutions, and providing full transparency to drive innovation. An energized group of developers continuously improves InfluxData’s products, helping to make them more reliable, secure, and awesome. The power of the open source community to drive innovation is unsurpassed by any proprietary software solution.
Hybrid cloud and on-premises support
Distributing assets on one or across multiple cloud-hosting environments is often the best choice for companies. Key among many advantages is avoiding vendor lock-in, which can limit the ability to customize systems and negotiate better rates, ultimately making it very difficult, and expensive, to change cloud providers to meet ever-evolving business and technical needs. Every business has specific functionalities, and a hybrid cloud system offers the flexibility to choose services that best fit their needs, whether to support GDPR regulatory requirements or teams spread across multiple providers. From an operations perspective, a multi-cloud system increases efficiency and provides another layer of security to prevent downtime.
Time series focused
InfluxData as a company is focused entirely on making the best database and ecosystem for working with time series data, while for major cloud providers, their time series offerings are just one of many in their portfolio. Often, these cloud-provided services are designed to be “good enough” for existing customers rather than best-in-class in terms of performance and efficiency.
Time Series and Physical AI
Unlike traditional LLMs or generative models, Physical AI is designed to interact with the material world. It doesn’t just process numbers; it interprets telemetry through the lens of known physical laws. It uses high-resolution time series data to determine exactly what is happening in a system, deciphering whether a vibration is a harmless resonance or an imminent structural failure.
However, a model is only as smart as its inputs. If the telemetry is too slow or too vague, the physics become invisible. To build reliable Physical AI models, you must first solve for two critical data engineering bottlenecks: Temporal resolution and architectural scale.
Temporal resolution: escaping the aliasing trap
To faithfully reconstruct a physical signal, the Nyquist-Shannon Sampling Theorem dictates a mathematical minimum: you must sample at least twice the highest frequency component of the system. Think of this as the “frame rate” required to see the physics in action.
Reality
In Industrial IoT, meaningful physical events, like micro-vibrations in a turbine or power transients in a grid, occur in the kHz to MHz range (thousands to millions of cycles per second). Following the Nyquist-Shannon theorem, the minimum "frame rate" for accurate digital reproduction requires sampling at 2,000 to 2,000,000 points per second.
Risk
(The aliasing trap)In Industrial IoT, meaningful physical events, like micro-vibrations in a turbine or power transients in a grid, occur in the kHz to MHz range (thousands to millions of cycles per second). Following the Nyquist-Shannon theorem, the minimum "frame rate" for accurate digital reproduction requires sampling at 2,000 to 2,000,000 points per second.
Our take
In Industrial IoT, meaningful physical events, like micro-vibrations in a turbine or power transients in a grid, occur in the kHz to MHz range (thousands to millions of cycles per second). Following the Nyquist-Shannon theorem, the minimum "frame rate" for accurate digital reproduction requires sampling at 2,000 to 2,000,000 points per second.
Temporal resolution: escaping the aliasing trap
To faithfully reconstruct a physical signal, the Nyquist-Shannon Sampling Theorem dictates a mathematical minimum: you must sample at least twice the highest frequency component of the system. Think of this as the “frame rate” required to see the physics in action.
Reality
Today, physical systems are densely instrumented. This means the number of unique time series combinations, the cardinality, scales multiplicatively:
- Single Asset: 50 sensors = 50 unique series.
- Single Site: 1,000 assets x 50 sensors = 50,000 series.
- Global Fleet: 100 sites x 50,000 series = 5,000,000 unique series.
Every new metadata tag (firmware version, model ID, or geolocation) doesn't just add data; it multiplies the complexity of the metadata web that your database must index and query in real-time.
Risk
(The aggregation wall)
Most legacy databases hit a performance wall as unique series increase. To prevent system collapse, teams are forced into Aggregation: performing "rollups" and "averaging" across the fleet to reduce the indexing load. But averages hide the physics, by definition, it washes out the outliers, which are often early signs of trouble.
The rollup might show that the entire site is within parameters when, in reality, one system is melting down.
Our take
We architected InfluxDB 3 to eliminate the need for forced rollups. Our high-cardinality engine manages millions of unique series at their raw, granular state. This preserves the per-asset identity required for high-fidelity root-cause analysis, ensuring your AI can see the individual components, not just a fleet-wide average.
Data integrity drives model integrity
The efficacy of Physical AI models is driven by the integrity of the data used in training. If your data platform forces you to compromise on either depth (high-frequency resolution) or breadth (high-cardinality metadata), it is forcing you to compromise on the model’s ability to reason about the physical world.
When we set about designing InfluxDB 3, we focused on eliminating the "aliasing trap" and the "aggregation wall."
The goal was to ensure that models could see the actual physical signatures of your assets, not a "ghost” of an undersampled signal or the anonymous average of a thousand different machines.
Time Series Starts With InfluxDB
Fueled by the massive growth of connected devices (i.e., IoT) and rapidly increasing instrumentation requirements for next-generation software, time series technology has become increasingly popular. Since launching InfluxDB, an open source time series platform in 2013, we have seen millions of downloads, built an expanding list of enterprise customers, and fostered a growing community that is always finding new ways to deploy and build on our platform.
InfluxData also offers the following commercial editions of InfluxDB:
InfluxDB 3 Enterprise
InfluxDB 3 Enterprise is a self-managed, on-premises solution that allows you to run an InfluxDB cluster on your own infrastructure.
Cloud Serverless
InfluxDB Cloud Serverless is a fully-managed, elastic, multi-tenant solution with pay-as-you-go pricing that makes it quick and easy to get started with InfluxDB.
Cloud Dedicated
InfluxDB Cloud Dedicated is a fully-managed, single-tenant solution that can be optimized for your workload and provides isolation for security guarantees.
InfluxData has a narrow focus for what has rapidly become a horizontal use case. That means that the entire stack can offer performance and developer productivity optimizations that other general-purpose solutions can’t match, such as high-compression, super-fast engines, and a powerful query language designed to work with flow-based models. At the same time, InfluxData provides a platform that is broadly customizable, making it a perfect choice for developers who want greater control over their tooling than what out-of-the-box applications and solutions provide.
With time series as the key ingredient for custom DevOps monitoring and metrics, real-time analytics and sensor data, and the Internet of Things, InfluxData continues to be at the forefront of what is sure to be the next wave of data platforms after NoSQL.
InfluxDB is the overwhelming leader among time series database management systems, according to DB-Engines’ results.
Download the Technical Paper
Learn About Time Series Databases
Understand how time series databases handle high-cardinality data at scale.
The most powerful time series database
InfluxDB University, training to get up and running quickly
