How Cohu Uses InfluxDB to Power Digital Twins for Semiconductor Manufacturing

Cohu (formerly Tignis) is a global technology leader supplying test, automation, inspection and metrology products, software analytics solutions and services to the semiconductor industry. Cohu’s differentiated and broad product portfolio enables optimized yield and productivity, accelerating customers’ manufacturing time-to-market. Cohu solutions support critical semiconductor applications including artificial intelligence, high-performance computing, automotive and autonomous systems, advanced medical equipment, and global connectivity.
 REGION
North America
 INDUSTRY
Manufacturing
PRODUCTS
Start building with InfluxDB
Start exploring InfluxDB and bring high-performance time series analytics to your applications.
Try InfluxDBOverview
Powering Digital Twins with Time Series Data
Cohu has created an analytics and digital twin platform that provides its customers with a custom UI which enables real-time interactive analysis. Cohu’ approach to industrial IoT monitoring enables its customers to dive deeper into their facilities by providing historical data and insights. Cohu’ platform runs on Azure and Kubernetes and is powered by InfluxDB, the purpose-built time series database. The platform is built on InfluxDB and collects sensor data from manufacturers’ various systems. All sensor data is available through the platform, which provides clients with real-time and historical analysis.
Challenge
Understanding How Machines Behave
Cohu realized there was a need for a better analytics platform for industrial organizations, such as semiconductor manufacturers, who needed advanced analytics, anomaly detection and machine learning functionality. Not only did the platform need to extract sensor data, but they also needed a way to better understand the physics behind the machines. Cohu aims to help large industrial organizations overcome classic obstacles and become data-driven through better condition monitoring, optimization and delivery. They ultimately want to reduce downtime and improve efficiency.
Cohu provides its customers with a unique solution which the company has coined as physics-driven analytics. There are various components to the Cohu platform. Their SaaS solution is all-inclusive and their team has the expertise to implement effective tools and resources which improve industrial systems. Consisting of subject matter experts, Cohu is able to provide the necessary analytics platform, IT and support to enable its clients to be up and running in a short amount of time.
Cohu wanted to ensure that any business decisions that were made would not constrain the business’ growth in the long run and that any chosen solution would scale with the business as it grows. Cohu’ clients vary in size, and each has a unique architecture. This results in customers having their own storage and container solutions; Cohu needs to be able to scale based on its customers’ unique needs as well as its own business needs.
Technical Challenge
Keeping Digital-Twins Grounded in Reality
The Internet of Things (IoT) has revolutionized the industrial sector as organizations can now add sensors to their devices. They are able to collect data and plug the sensor metrics into software to analyze and visualize it. As Jon Herlocker, President and CEO of Cohu, points out: “You can use that software to make data-driven decisions about how to optimize your processes”.
There are countless obstacles to ensuring companies are using the proper technologies adequately. For example, in condition monitoring, organizations use technologies when operations are headed in the wrong direction in order to monitor and optimize conditions. It is often a challenge for large industrial operations to get to the point of implementing a solution to address all the obstacles. Some of these obstacles include:
- Installing necessary sensors
- Working with IT to extract the sensor data
- Setting up a secure network
- Creating a central repository for the data
Even when the data has been collected, organizations still need to take time to ensure its quality is adequate. Once all the data is in a central repository, there are challenges to utilizing it effectively. Ensuring the proper alerts are set up so that operators know what and when they need to modify something is crucial. Continuous maintenance of the data collection and alerting is important as well. As operations evolve, alerting and anomaly detection have to be updated accordingly.
Cohu’ analytics solution is built upon two diagrams that plants already have: schematic or a piping and instrumentation. Herlocker explains that any industrial plant is going to have something similar which shows how all of the pieces are connected, location of all of their sensors, location of control points, location of valves, etc. These plans are used to understand and diagnose issues as they arise. Most plants will often have a control system for their industrial system. The control system helps manipulate flows, valves, and temperatures based on sensor readings. Cohu’ team quickly realized that most industrial facilities have the control platform along with the diagrams but nothing to connect the two together. Ad hoc queries also present interesting downsampling challenges. If a user wants to visualize a specific kind of data for only a one-year period, or a three-year period, it doesn’t make sense to download all time-stamped metrics and events to the browser. Downloading unnecessary data makes the analysis messy, and the granularity of the data isn’t great. The user is only interested in a subset of the data; so in order to make user experience as rich as possible, the platform needs the capability to only pull relevant data. It is vital for Cohu’ platform to be able to return the necessary 1,000 values to best represent the parameters of each query.
Cohu needed to be able to provide its customers with historical queries. Queries in Cohu’ platform are performed ad hoc, which provides interesting challenges. Users are able to request any time range, any building or any sensor while querying the data. Cohu won’t know until the query is requested.
Any time Cohu onboards a new customer, it means they are deploying new containers or a new persistent disk. This means there’s more IOPS, more disk space storage and more utilized compute time. There can’t be any operational contention between customers as Cohu scales.
Cohu has migrated some clients off of historians like OSIsoft to InfluxDB, which present interesting challenges as the required level of detail is missing. Historian implementations don’t always include the metadata necessary to Cohu. They have to understand how the system works, the types of sensors, what they’re measuring and which assets the sensors are associated with. Sometimes a lot of this data can be extended, but often it’s missing connectivity between assets. For Cohu to deliver value to customers, they have to understand the correlation between the various pumps, chillers, sensors, etc. Determining the needed schema can be difficult as well, but over time Cohu has been able to accurately pinpoint the minimum amount of data they need. The migration requires a lot of manual manipulation of data in a CSV spreadsheet, in conjunction with the few automated tools available.
Solution
Building a digital twin on InfluxDB
We needed a solution that could handle storing all of the metrics collected from countless sensors for all of our clients. Additionally, we need to ensure the solution could handle our clients’ various use cases.
President and CEO at Cohu
Cohu creates digital replicas of customers’ schematics, piping and instrumentation diagrams. Customers are able to simply click-and-drag, in the Cohu platform’s user-friendly UI, to create a digital replica of their physical schematics. Cohu is able to provide its customers with a more useful way to understand and explore their systems. It also enables physics-based analytics and machine learning by providing a universal data format which can automatically handle changing conditions. As Jon Herlocker, President and CEO of Cohu points out, if their customers need to tweak their plants, the digital model will update and the analytics will automatically update to support the client’s new structure. This automation enables continuous monitoring of clients’ systems and models.
Cohu’ team is cognizant of data issues that arise with mechanical systems. Some of these challenges are as simple as when a plant shuts down. However there are countless smaller problems that can occur that impact efficiencies. Beyond efficiency reductions, it can also lead to larger failures that can be harder to detect. Cohu’ condition monitoring solution focuses on the complex issues that result in failures that are hard to detect. Cohu aims to reduce downtime and increase facilities’ efficiencies. Through its product, Cohu is able to provide predictive maintenance by determining indicators of future failures. Some of these avoid failures include hidden issues that aren’t easily visible.
Cohu’ analytics functionality and rich user experience enables customers to identify location of problems quicker which results in faster root-cause analysis. Clients are always analyzing their mean time between failure and mean time to repair. These key metrics help them look at long-term improvements. For example, Cohu customers are always looking to increase the mean time between failures and to lower their mean time to repairs. By reducing their mean time to repairs, this also means clients are able to reduce their operating costs; for larger factories, this potentially means saving millions of dollars per plant every year.
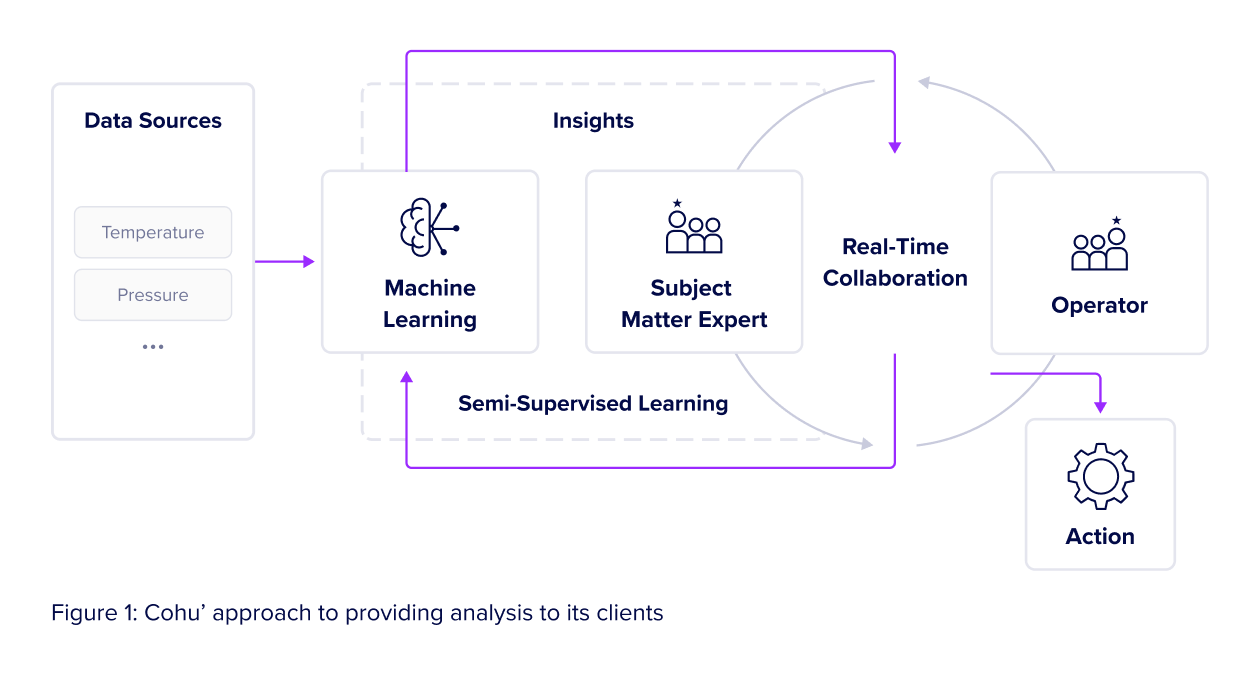
Cohu’ analytics SaaS platform runs inside of Azure. Sensor data is collected and stored in Azure. The data is cleaned and normalized. This data is used to create machine learning models, enable anomaly detection and trend analysis. After identifying conditions that will be interesting to its customers, Cohu provides them with interactive root-cause analysis. The final step Cohu has coined as “augmented intelligence”. Cohu doesn’t want to leave clients with a black box where they’re told what to do without having the data to back it up. Besides providing insight into conditions clients should be concerned about, Cohu always wants to enable customers to be data-driven in their own assessment and fixes to the problems. Cohu wants to point out their issues, provide solution suggestions and help mitigate similar issues arising in the future.
As Cohu’ platform runs in the cloud, scaling within customers doesn’t cause too many issues as the amount of data coming from a single plant isn’t the issue. The bottlenecks occur on the network between the end plant and the cloud. The amount of data sent to Cohu isn’t exactly a million points a second; it is more one per minute or one every five minutes. That being said, if collecting data points starts becoming a bottleneck, Herlocker and his team know they can address it by increasing the amount of RAM. As they run in Azure, they are able to dynamically change the RAM to meet their requirements. Currently, Cohu is nowhere near the limits of RAM. Scaling out for a customer is quite straightforward, and there haven’t been any growth constraints.
Getting started with InfluxDB was easy enough. However, the hardest part was determining the best schema design. When implementing InfluxDB with early customers, Cohu wasn’t sure of which data was actually being collected and sent to them. Herlocker points out that this is a fundamental problem with a lot of industrial systems. Tools are hooked up to collect time series data and the data has obscure names that aren’t useful to anyone. The person who originally designed the system has to be called upon to help decipher which sensor is collecting what data. There isn’t great metadata available about industrial sensors or where they’re attached to. The recommended schema including measurements and field best practices was difficult to apply as they weren’t sure which data they were collecting.
At the beginning, they mostly just knew they were collecting time series data from a certain building, but this isn’t granular enough. Cohu decided to pick a schema that would at least get all of the data collected so they could query it and build a product based on it. Over time, they were able to make better sense of all the time-stamped data, optimize it, and execute high-performance queries and aggregations. Looking back, Herlocker realizes it would’ve been nice to know more about the data they were collecting. Their initial approach was to map every building to a measurement as that was the only thing they knew at the time. Castonguay acknowledges that Cohu didn’t make good use of tags to provide additional metadata. They would pull in the data without trying to infer the structure; they just wanted to get the data into InfluxDB and start graphing it. Rather than having data scientists comb through a decade’s worth of data, Cohu decided not to look back and use MongoDB to handle all metadata.
When it came to assigning fields, it was as convoluted as measurements. It started off as they knew there were a bunch of different sensors and were aware of the sensor’s strange name. While they couldn’t articulate the difference between the sensors, they knew they were independent from each other. They started off assigning a separate field to every sensor. Even though Herlocker and his team have since gotten more familiar with InfluxDB best practices, sometimes a 1:1 ratio of fields to sensors still works.
In the early days, their approach to measurements and fields worked as it removed the friction of getting the data in before they got it into the Cohu platform. However, this approach meant that they can’t use InfluxDB to aggregate across sensors. Cohu uses MongoDB to track all sensor metadata. This helps the company track what the sensor is collecting, if it’s part of a larger system/device and tracking the larger device. Herlocker points out that one machine often will have multiple temperature sensors, and oftentimes one of those sensors is a trusted data source while the other isn’t; so it’s key to understand which sensor is emitting what data.
Cohu currently has two primary usage patterns for time series data. One is the interactive analysis in their UI. This usually uses small amounts of recent data where the platform is providing the user with analysis with very predictable quick response times. The second usage pattern is for model training. This is why a user needs to use all data points on a specific asset from the beginning, regardless of resolution. Herlocker’s team has found that learning models would query InfluxDB and flush out the in-memory cache to enable interactive analysis, but not predictably fast. Granted, Herlocker also points out that querying all of the data doesn’t take advantage of InfluxDB’s capabilities.
The default retention policy set by Cohu is forever. Castonguay expands that clients are paying Cohu to have historical data readily available if they need to query it. He points out that “data at rest is cheap. Disk is cheap”; so there aren’t issues with data storage. The retention policies are determined at the building level; so if a client requests Cohu to remove all data pertaining to a specific building, they are able to just drop the measurement and get rid of the data. Cohu is also able to drop an entire managed disk if a customer decides to not use their platform altogether. Castonguay points out that down the road, they might need to reevaluate their decision to retain customers’ data indefinitely (unless otherwise told).
As of right now, Cohu doesn’t use a caching layer in front of InfluxDB. The front-end API’s used to query the data don’t hit anything like Memcached or Redis along the way. They are currently exploring doing this for some data — just for data collected within the last hour. They are considering it for dashboarding where clients are trying to refresh very recent data. If customers start needing high-resolution data and start collecting more metrics and events more frequently, they will start considering different solutions more seriously.
Why InfluxDB?
When choosing their cloud service provider, Cohu considered the CSP’s native time series tools. They quickly decided not to go down this route and avoid the proprietary database solutions. They valued that InfluxDB runs on Azure and Google Cloud and that it can be on-premises if needed. This provided Cohu with the feel of control they desired. While they ultimately picked Azure, Cohu knows that even if a customer wants to deploy elsewhere, they will be agile enough to meet these needs, even if they want to run Cohu’ solution in their own Kubernetes cluster.
Prior to ultimately selecting InfluxDB, Cohu did test out some of the cloud service providers’ time series solutions. During the testing phase, they quickly realized that they could not spin up or test with a version within a CI/CD cluster on a laptop. They realized you couldn’t do an end-to-end test on a Jenkins machine. Having chosen InfluxDB on top of Kubernetes, Cohu is able to simply launch a Kubernetes cluster on a laptop, run the entire Cohu platform (with time-stamped data), and run partial tests end-to-end. Being able to extensively test was great in terms of agility for the team. Herlocker points out that the testing ability results in faster resolution time, especially with system-wide issues.
Cohu’ analytics platform provides its clients with a rich user experience which provides interactive analytics across all metrics. The team quickly realized they needed a time series database to address the high volume of sensor metrics collected. Cohu’ team considered creating their own time series solution. Yet as an early-stage startup, they quickly realized that they needed to get a solution up and running quickly that was cost-efficient, so that they could start testing with early customers. Every day they didn’t have a solution meant they weren’t able to provide desired value to their clients.
InfluxDB and InfluxQL are able to handle all of Cohu’ on-demand reporting requirements. Thanks to InfluxDB, Cohu is able to select a specific time range and interval size and use InfluxDB and InfluxQL to query the data. Because the time series data platform handles most of the heavy lifting, it allows Cohu to quickly render query results in less than a second. Queries made with InfluxQL are routed directly to Cohu’ interactive UI. All the charts and graphs are rendered within Cohu’ platform in real time and are powered by InfluxDB. Clients are able to select specific sensors, plants and values and view the most recent data instantaneously, rather than looking at historical data.

Customers are able to navigate through the digital twin of their system within the platform. The platform shows the sensor values overlaid on different parts of the schematic. Each key component of the schematic will have sensor read-outs. Cohu has a feature which enables clients to “travel in time” and they are able to see updates over time across various sensors. All this is powered by countless queries in InfluxDB. The UI actually shows the values opening and closing given the specific point in time.

When determining their priorities, they acknowledged that if they spent the time to create their own time series solution, it would take time away from their core mission. As Herlocker points out, “storing time series data isn’t part of [Cohu’] core business”. He expands that time series databases are something others have already mastered, so in the end Cohu turned to InfluxData for InfluxDB, the creators of the purpose-built time series database. Their core business initiatives include solving industrial problems by enabling better AI and machine learning.
Besides perfecting data analysis for its clients, Cohu wants to provide them with an amazing interactive user experience to enable them to explore their data. Additionally, they wanted to ensure the cost of a beautiful design didn’t come at the expense of functionality and company growth. If design stalled growth, this would result in deployment constraints and scalability issues.
When considering time series data solutions, InfluxDB was quite favorable as it is a mature technology. Many people across the Cohu’ team members’ networks had previously successfully used InfluxDB; these personal recommendations strongly swayed their decision. Before these endorsements, Herlocker and his team wanted to verify InfluxDB’s prowess before working down this path. They were impressed by all the InfluxDB users deploying it, talking about it in various forums and answering/ asking questions — this all signaled the presence of a strong InfluxDB community. This boded well from a recruiting standpoint as it meant Cohu would be able to find developers, consultants and contractors who were already familiar with the platform. Moreover, Herlocker pointed out that the InfluxData team was also there to assist whenever support was needed.
Cohu values InfluxDB’s reach and easy-to-use query API. Their team knew they needed a simple API to enable their interactive analytics. In addition to a strong API, they needed strong valuable documentation. Herlocker acknowledges that there are always subtitles when it comes to API calls and responses; Cohu found there was enough documentation for InfluxDB.
Technical Architecture
Flexible, Multi-Tenant Architecture for OT Analytics
Ensuring growth opportunities weren’t stifled by any decision, Herlocker and his team were concerned about which cloud platform to pick. They considered AWS, Google Cloud, Azure and building their own private cloud. Customers’ cloud preference was a major factor as Cohu acknowledges that they might have to go with a client’s preference. Within the industrial space, Microsoft Azure is often the preferred cloud service provider. Even though they’ve chosen Azure, they still want to ensure they aren’t locked into Microsoft in case down the road they discover it isn’t stable enough or if a customer demanded a specific CSP down the road.
Cohu appreciates InfluxData’s entire TICK stack, specifically Telegraf. The team knew that selecting a database is a decision that shouldn’t be made lightly and that should be strategic. As a startup, they wanted to ensure they would be able to live with their choice long-term. Herlocker had previously used Telegraf and was amazed at the wide range of plugins. While the team is impressed with Telegraf’s breadth of connections, in the end they haven’t used it as much as they thought they would as Telegraf’s plugins are predominantly for the IT side of things. This is where there’s a convergence of the IT and the OT as Cohu’ clients are within the industrial space. There aren’t as many off-the-shelf solutions for industrial monitoring.
In Cohu’ early days, they used Chronograf for visualizations. It was quite useful when confirming that the platform was working as expected and to perform data analysis. Once their platform became more robust, they built out their own interactive visualization UI for their customers. They don’t allow customers to add in arbitrary InfluxQL queries, but they can explore, summarize and analyze the data. Cohu looked at and considered using Kapacitor. However by this time, their own custom UI had enough overlapping data analysis functionality. Additionally, stream processing wasn’t at the core of Cohu’ goals. Cohu’ UI provides their customers with data analysis and data processing, and it’s able to stream the data and take action based on the data.
Their multi-tenant Kubernetes architecture operates on Azure Kubernetes Service. That being said, the Cohu platform is architected to run on other cloud service providers as well. One of their first design decisions was to isolate customers’ data from each other. They have customers in the OT space including semiconductor manufacturers, pharmaceutical manufacturers and chiller plants. Their OT customers have a lot of sensitive data including data about manufacturing yields and quality issues. Overall, these types of customers have more security concerns.

- Customer1.Cohu.io → Each of these white boxes signifies the collection of containers and persistent disks that represents a client.
- Every customer has a dedicated InfluxDB container and persistent disk.
- Cohu has a target Kubernetes cluster that can be shared or dedicated.
- There is a set of containers used to run all tenant services and persistent volumes.
- Some shared services include the load balancer → Azure Load Balancer.
Result
From machine data to operational intelligence
We wanted something that would get up and going fast, that wouldn't distract us from our core business, [InfluxDB] seemed to nail all that.
President and CEO at Cohu
Jon Herlocker and Alan Castonguay quickly installed InfluxDB, and it just worked! Herlocker pointed out that while it did take some time to figure out how to deploy it and how to manage the configuration, schema and deployment — it really didn’t take long.
Like with any solution, Herlocker and Castonguay note that maintenance of InfluxDB is required. They have to occasionally tweak the amount of RAM being used. There are other settings that needed to be altered, but nothing major — InfluxDB just works.
The beauty of Cohu’ architecture is that InfluxDB runs inside of a stateless container, so if it needs to be restarted, or if the containers need to be killed or a new container is needed, all the configurations for the InfluxDB container come from Kubernetes Secrets and Kubernetes ConfigMaps. They seperate out the config from the application from the data. The state is provided by a blocked persistent disk which is managed by Azure. The great thing about their architecture is that they are still able to utilize the classic Azure services on top of each volume.
They use a MongoDB database for metadata. There are also containers running RAI algorithms. Additionally, the UI is run by separate containers. There is a metric API-like cluster of containers in front of InfluxDB; this is how Cohu exposes metrics through its UX to its customers. As they’re dealing with multiple customers’ data, having application-specific authentication is key. Being able to query their data in various ways is key for Cohu. Sometimes they need to query the API that supports their digital twins. Being able to better understand the status of their services is key.
The great thing about how they have architectured their solution is that they are able to deploy a new tenant within minutes. If they need to spin a new instance up for a new customer, they can do so by creating a new HelmRelease from a template. This will include the name, Namespace and FQDN. Even though the new instant is isolated from the rest, everything is automated. After copying the tenant, there’s a bit of search-and-replace to rename the tenant. Next, you commit the new file to the GitHub repo, or at least create a PR for the file. Once the PR is approved, all required verifications are run automatically. Automatic verification includes a kubeval on every yaml file on every commit/PR. Next, FluxCD, Flux Continuous Deployments, creates all necessary containers, the required disks are mounted, booted, etc. And just like that, the deployment is done! There is very little human intervention required, besides identifying the initial specifications for the tenant and types of services required.

Sometimes changes are required — the engineering team just has to make the change and initiate a PR. Once the pull request is approved, by default the update is rolled out to all of Cohu’ tenants. For example, if Cohu wants to update InfluxDB, all they have to do is update a few files, edit InfluxDB and it replaces the app container from the old version to the new version. For the most part, everything just keeps working.

By building models and digital twins for its customers, Cohu is able to predict the values of certain sensors. Take a chiller plant and its power sensor. They have created a model using a combination of physics and machine learning to determine what the power utilization should be. They have created a processing pipeline which emits these data points: what the utilization should be and what it actually is. This data is stored back in InfluxDB. Clients are able to visualize the data and understand the delta between the prediction and actual data. If the delta between the two data points is too large and goes beyond a previously set threshold, alerts will be triggered. Even the trigger alert data is stored in InfluxDB, so Cohu is able to do later-stage analysis. This helps them determine if the deviation between the two data points is enough to be concerned about, or if they can ignore it.


