How Cisco Uses InfluxDB as a Foundation for Real-Time Monitoring
Cisco Systems (Nasdaq: CSCO), founded in 1984, designs and sells networking hardware, software, and services, and is best known for the routers and switches that underpin much of the internet. Its portfolio now spans networking, security, collaboration, observability, and AI infrastructure.
 REGION
North America
 INDUSTRY
Network Monitoring
Start building with InfluxDB
Start exploring InfluxDB and bring high-performance time series analytics to your applications.
Try InfluxDBBUSINESS IMPACT
84 TB+
Data transferred over 9 days
100%
Video streaming uptime
26,000+
Attendees, speakers, and staff connected
Overview
Multiple use cases, one pattern
At Cisco, InfluxDB supports real-time monitoring in settings with very different constraints. What they share is a pattern: collect telemetry from mixed sources, keep the context needed to interpret it, and make both current and historical data available when a decision is being made.
Network Monitoring
Real-time event network monitoring at Cisco Live
At Cisco Live, connectivity supports everything from attendee internet access to registration and session capture. Roughly 25,000 attendees at a US event rely on infrastructure that can include 2,300 wireless access points and more than 600 switches. Many are Cisco customers, partners, and network engineers, making even minor disruptions highly visible.
The event team has only four or five days of venue access to prepare the network. Once sessions begin, engineers must operate and modify the infrastructure while it is in active use. Without a clear view across routers, switches, wireless equipment, servers, and storage, they risk responding too late to a developing failure—or disrupting the event to fix something that could safely wait. As Jason Davis, Distinguished Engineer at Cisco, put it: “We really don’t have a maintenance window. It’s all a maintenance window.”
The challenge is to maintain a real-time view across the environment, distinguish normal behavior from emerging problems, and preserve enough history to improve planning for future events.
Together, the three cases pointed to the same platform need: a flexible architecture for collecting reliable telemetry, preserving the context required to interpret it, and making it available while it could still guide a decision.
IIoT Edge Monitoring
Remote environmental and equipment monitoring on a construction site
For Ehsan Fazel, Presales Systems Architect at Cisco, the priority was minimizing the time “from where you are to the time that you deliver value to the end users.”
On an infrastructure project in the United Kingdom, Cisco supported a construction team working on environmentally sensitive land. The team needed to track environmental conditions, monitor where machinery traveled, and measure how long engines continued running while equipment remained stationary.
The site presented difficult operating conditions: there was no power grid, available electricity was limited, and 4G coverage was patchy. Approximately 30 parameters came from multiple types of sensors, with different manufacturers producing different payload formats. Missing or inconsistent data could make it difficult for managers to reconstruct environmental conditions, respond to complaints with evidence, or identify avoidable fuel use.
The challenge was to collect reliable telemetry despite intermittent connectivity and limited power, bring data from different sensor types into a consistent form, and make near-real-time information available for monitoring and analysis.
Data Center Infrastructure Monitoring
Unified data-center infrastructure monitoring with NX-OS
Cisco’s data-center customers already monitored compute and storage, but they also needed network telemetry in the same environment to connect application behavior with conditions in the underlying network.
Legacy collection methods made that difficult. SNMP polling could miss changes between samples, while CLI output was unstructured and formatting changes could break the scripts that depended on it. As Gerard Sheehan, Product Manager for IBNG (Intent-Based Networking Group) at Cisco, explained, “SNMP polling can be on the order of minutes, which is an eternity in a modern deployment.”
Those gaps could hide short-lived events and make it harder to trace application problems back to the network. Troubleshooting often required collecting more detailed telemetry, but changing telemetry paths switch by switch could turn a simple request into a fleet-wide configuration task.
The challenge was to collect high-frequency network telemetry alongside compute and storage data, adjust what was collected as troubleshooting needs changed, and support a gradual migration away from SNMP.
Together, the three cases pointed to the same platform need: a flexible architecture for collecting reliable telemetry, preserving the context required to interpret it, and making it available while it could still guide a decision.
Solution
A common architecture for real-time monitoring
Cisco’s teams used a common pattern: collect measurements through tools suited to the source, prepare them for time series storage in InfluxDB, and make them available through dashboards and analysis. Each implementation adapted that pattern to its equipment, connectivity, and users.
| Solution stage | Event network monitoring | Remote site monitoring | Data-center infrastructure monitoring |
|---|---|---|---|
| Managed agents | Polling, streaming telemetry, and APIs across event infrastructure | LoRaWAN sensors feeding a gateway and Cisco IR1101 router | Telegraf gNMI subscriptions to switch telemetry |
| Prepare | Orchestration scripts and Telegraf organize and tag measurements | Python application decodes sensor-specific payloads; raw copies go to Google Cloud Storage | Telegraf collects supported measurements at configured intervals or on change |
| Store | InfluxDB stores operating metrics across equipment types | InfluxDB Cloud stores processed readings | InfluxDB stores network telemetry alongside other infrastructure metrics |
| Visualize and analyze | Grafana dashboards compare devices and track network behavior | InfluxDB Cloud dashboards and shared links give site staff access | Chronograf dashboards show switch metrics in the integration example |
| Adapt to the environment | Summarize event data for later comparisons before equipment reuse | About nine watts for the router; store-and-forward for intermittent connectivity | Manage subscriptions at the collector; support gradual migration from SNMP |
The shared architecture places InfluxDB between source-specific collection and the tools people use to understand the data:
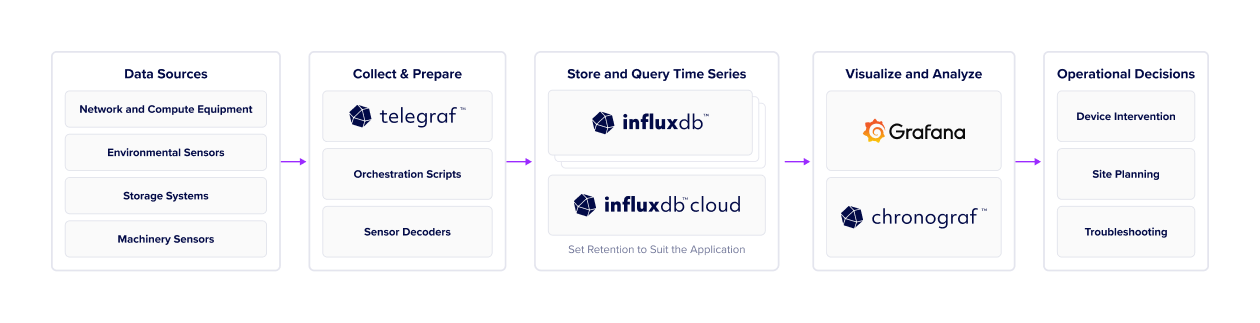
Across all three implementations, the surrounding components changed, but InfluxDB played the same role: providing a common time series layer between source-specific collection and the operational tools used to interpret the data.
Result
Turning telemetry into operational decisions
At Cisco Live, comparing hundreds of access switches exposed one whose CPU usage jumped from 17% to 80%. Another showed steadily increasing memory usage. That trend helped the team assess whether the device needed attention during the show, could wait for an evening reboot, or could keep running through the event.
The measurements also informed investment decisions. Workflow dashboards fed an automation ROI calculator, while wireless usage data helped the team evaluate when to retire older standards. After events, the team summarized data for year-over-year comparisons before equipment was wiped for reuse.
On the construction site, dashboards and shared links gave the team access to environmental and machinery data. Fazel demonstrated opening a shared link on his phone without building a mobile app. A 60-day retention period kept storage costs modest for the project.
The contractor also had environmental records to consult when responding to complaints. Cisco deliberately selected certified sensors and preserved the provenance of their readings, giving the team evidence to assess what had happened. Machinery data provided a basis for evaluating routes and idle time.
For NX-OS customers, defining subscriptions at the collector simplified changes to telemetry detail. Operators could change the measurements requested without editing sensor-path configuration on every switch. Sheehan described the process during troubleshooting as straightforward: “It’s as simple as restarting Telegraf with a new configuration file.” Support for both SNMP and streaming telemetry allowed gradual migration. A virtual Nexus environment also lets customers try the integration without physical switches.
Across all three examples, InfluxDB supplied a common time series foundation for different responsibilities: keeping an event network running, assessing construction-site conditions, and investigating data-center behavior. The value came from giving operators timely access to changing conditions and enough historical context to decide what to do next.


