Introducing Ranged Annotations in InfluxDB Cloud
By
Russ Savage
updated December 14, 2025
Use Cases
Product
Developer
Navigate to:
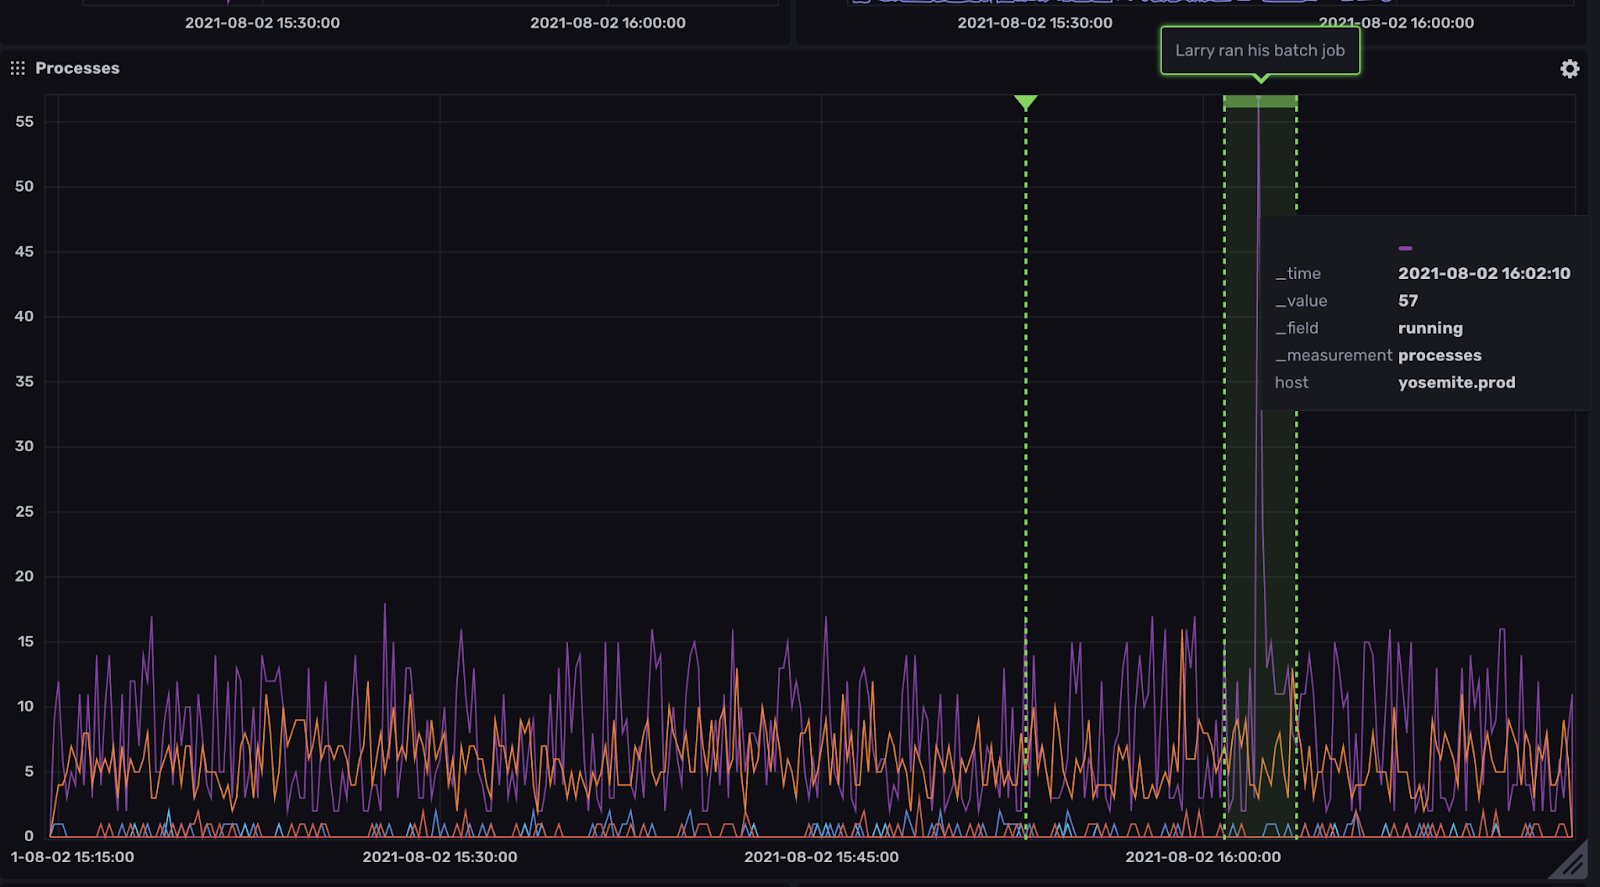
Adding annotations to your data is a great way to share context with other members of your team. In May, we added the ability to annotate individual points in your data. Today, we have added the ability to add ranged annotations to your dashboard graphs.
We’ve also reworked some of the interactions with annotations based on user feedback so that they can be added quickly and easily. To learn more about working with annotations, check out our documentation.
Adding ranged annotations
Adding ranged annotations to your data is simple. To get started, open any of your InfluxDB Cloud dashboards and look for the Annotations button at the top.
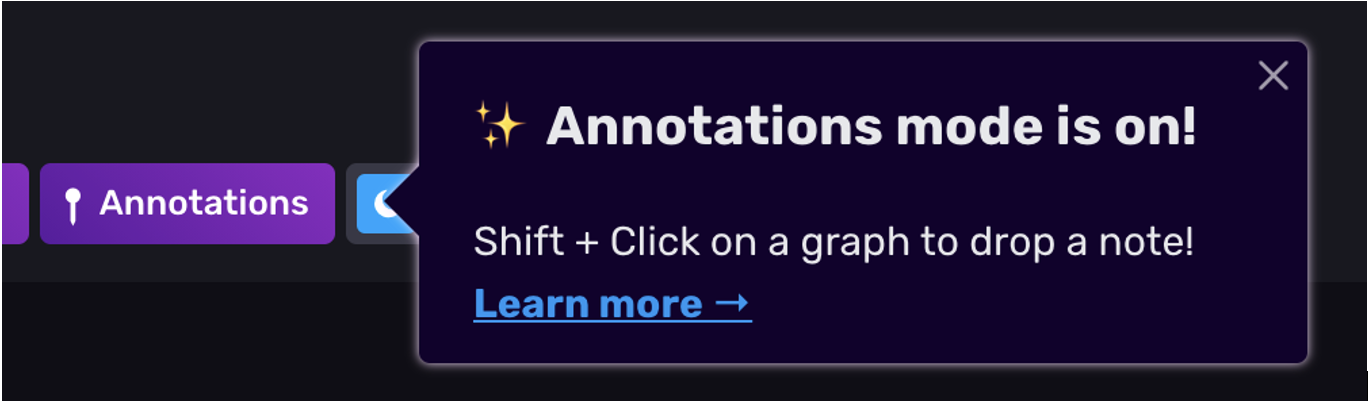
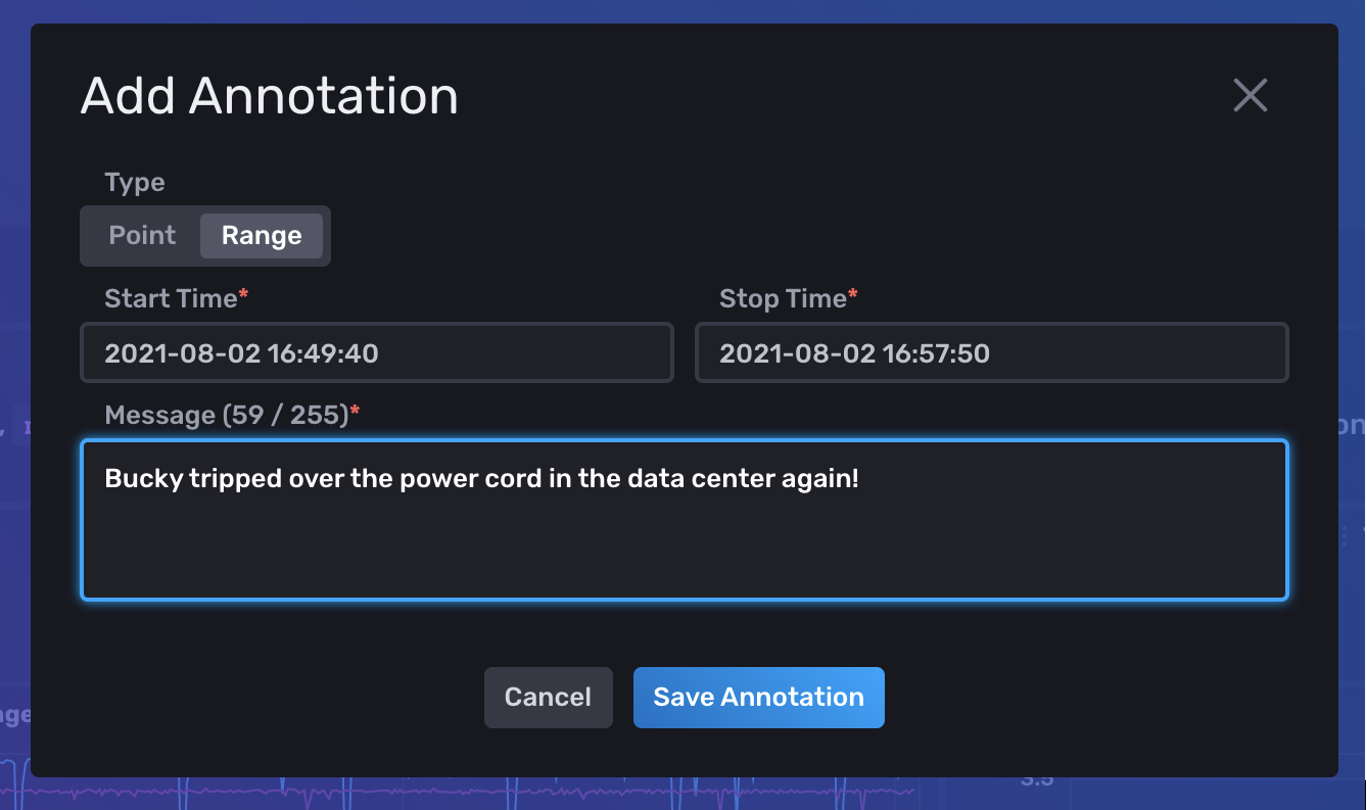
As the informational popover says, to add an annotation to a graph, simply hold down the shift key and click where you’d like to place the annotation. A box should open that allows you to enter a message. If you’d like to add a ranged annotation, simply hold down shift, then click and drag across an area of a graph you’d like to annotate.
The annotations you add will be visible to anyone else in your organization when they have the annotations button turned on in their dashboard. Annotations can be added to any line graph.
Conclusion
Annotations are a quick and easy way to share additional contextual information about the data being shown in a graph. This can help a team triage and troubleshoot faster because the important insights, hints, and information is available on the dashboard itself.
We’d love to hear what you think about the new annotations feature of InfluxDB Cloud. Join us in our Community Slack workspace and let us know!
