Pandas DateTime: When and How to Use It
By
Community
Developer
Dec 06, 2023
Navigate to:
As a Python developer, you commonly work with DateTime values, especially when dealing with data-related operations. Using DateTime data can be extremely helpful when analyzing or manipulating large amounts of data. One of the most popular and common libraries Python developers use today for this purpose is Pandas.
Using Pandas, we can take advantage of the DateTime data type it provides to easily work with date-time-related data and carry out certain operations. In this blog post, we’ll dive into the world of Pandas DateTime, exploring what it is, how it works, and the various ways you can use it.
What is Pandas DateTime?
Pandas DateTime is a data type the Pandas library provides to handle date and time data efficiently. It allows you to perform various operations on DateTime values, such as parsing strings into DateTime objects, formatting DateTime objects into strings, and performing arithmetic operations with DateTime data.
Let’s take a quick look at the Pandas DateTime object’s syntax with a simple example.
Pandas DateTime syntax
To create a Pandas DateTime object, you typically use the pd.to_datetime() function:
import pandas as pd

datetime_obj = pd.to_datetime('2023-09-16 15:30:00')
If you print the datetime_obj in the above code, you should get the following output:
2023-09-16 15:30:00Once you have a DateTime object, you can use it to perform various operations like filtering, grouping, and plotting time series data.
Pandas DateTime example
Let’s start with a simple example to understand how Pandas DateTime works. Take a dataset that has a column containing date and time information. You can start by creating a DataFrame, then converting a column to DateTime. You can then extract various components of DateTime.
import pandas as pd

# Sample data
data = {'timestamp': ['2023-09-16 08:00:00', '2023-09-16 09:30:00', '2023-09-16 11:15:00']}
df = pd.DataFrame(data)

# Convert the 'timestamp' column to DateTime
df['timestamp'] = pd.to_datetime(df['timestamp'])

# Extract various components of DateTime
df['year'] = df['timestamp'].dt.year
df['month'] = df['timestamp'].dt.month
df['day'] = df['timestamp'].dt.day
df['hour'] = df['timestamp'].dt.hour
df['minute'] = df['timestamp'].dt.minute

print(df)
In the above code, we display the DataFrame with the original ‘timestamp’ column. We also extract the year, month, day, hour, and minute from each timestamp and display them as separate columns. Not only is it easier to look at, understand, and make sense of the data, but it’s also easier to use these individual columns for further analysis.
            timestamp  year  month  day  hour  minute
0 2023-09-16 08:00:00  2023      9   16     8       0
1 2023-09-16 09:30:00  2023      9   16     9      30
2 2023-09-16 11:15:00  2023      9   16    11      15
Let’s break down the above code step by step to understand what’s actually happening.
Creating sample data
In the first step, we’ll create a dictionary to store the DateTime data. Let’s call it ‘data’ with a single key ‘timestamp’. Against this key will be a list of three date and time strings as its values. Now we can create a Pandas DataFrame called ‘df’. This DataFrame will have one column named ‘timestamp’ containing the date and time strings.
data = {'timestamp': ['2023-09-16 08:00:00', '2023-09-16 09:30:00', '2023-09-16 11:15:00']}
df = pd.DataFrame(data)
Converting ‘timestamp’ column to DateTime
In the next step, we need to convert the ‘timestamp’ column in the DataFrame ‘df’ from a string format to a Pandas DateTime format. For this, we can use the pd.to\_datetime()function. After this operation, the ‘timestamp’ column contains DateTime objects.
df['timestamp'] = pd.to_datetime(df['timestamp'])Extracting various components of DateTime
Finally, we need to extract various components of the DateTime objects stored in the ‘timestamp’ column and create new columns in the DataFrame for each extracted component. Here’s what each line does:
- df[‘year’] extracts the year component from the ‘timestamp’ column and creates a new ‘year’ column.
- df[‘month’] extracts the month component and creates a ‘month’ column.
- df[‘day’] extracts the day component and creates a ‘day’ column.
- df[‘hour’] extracts the hour component and creates an ‘hour’ column.
- df[‘minute’] extracts the minute component and creates a ‘minute’ column.
Here’s the code that does this:
df['year'] = df['timestamp'].dt.year
df['month'] = df['timestamp'].dt.month
df['day'] = df['timestamp'].dt.day
df['hour'] = df['timestamp'].dt.hour
df['minute'] = df['timestamp'].dt.minute
At this step, we have converted a string-based timestamp column into Pandas DateTime and then extracted various components such as year, month, day, hour, and minute.
Use cases for Pandas DateTime
Now that we understand how to use Pandas DateTime, let’s look at some specific scenarios and use cases. We can use Pandas DateTime in a number of different scenarios, which include time series analysis, filtering data, calculating time differences, and formatting data. Let’s explore each of these use cases with an example to understand them better.
1. Time series analysis
Time series analysis is an analytical technique employed to study data points collected or recorded at regular time intervals, enabling the examination of patterns, trends, and relationships within the data. It finds practical applications in various domains, including financial forecasting, weather prediction in meteorology, and healthcare for tasks such as patient monitoring and disease outbreak detection.
As mentioned, time series analysis involves working with data collected or recorded at regular intervals over time. Pandas DateTime is perfect for this use case. You can perform operations like resampling, aggregation, and plotting with ease. Let’s consider a simple example of a time series analysis as shown in the code below:
import pandas as pd
import numpy as np
import matplotlib.pyplot as plt

# Generate sample time series data
date_rng = pd.date_range(start='2023-01-01', end='2023-12-31', freq='D')
data = {'date': date_rng,
        'value': np.random.randn(len(date_rng))}
df = pd.DataFrame(data)

# Set the 'date' column as the index
df.set_index('date', inplace=True)

# Resample data to monthly frequency and calculate the mean
monthly_mean = df['value'].resample('M').mean()

# Plot the original time series data
plt.figure(figsize=(12, 6))
plt.subplot(2, 1, 1)
plt.plot(df.index, df['value'], label='Original Data')
plt.xlabel('Date')
plt.ylabel('Value')
plt.title('Original Time Series Data')
plt.legend()

# Plot the monthly mean
plt.subplot(2, 1, 2)
plt.plot(monthly_mean.index, monthly_mean.values, label='Monthly Mean', color='orange')
plt.xlabel('Date')
plt.ylabel('Mean Value')
plt.title('Monthly Mean Time Series')
plt.legend()

plt.tight_layout()
plt.show()
The above code generates a sample time series dataset with random values. These values are taken from each day of the year 2023. We set the ‘date’ column as the index of the DataFrame and resample the data to a monthly frequency. Using this, we’ll calculate the mean for each month. Using the library Matplotlib, we create two subplots, one for the original time series data and another for the monthly mean. Finally, we display both plots to visualize the original data and its monthly mean.
Running the above code should show you the time series plot as shown below:
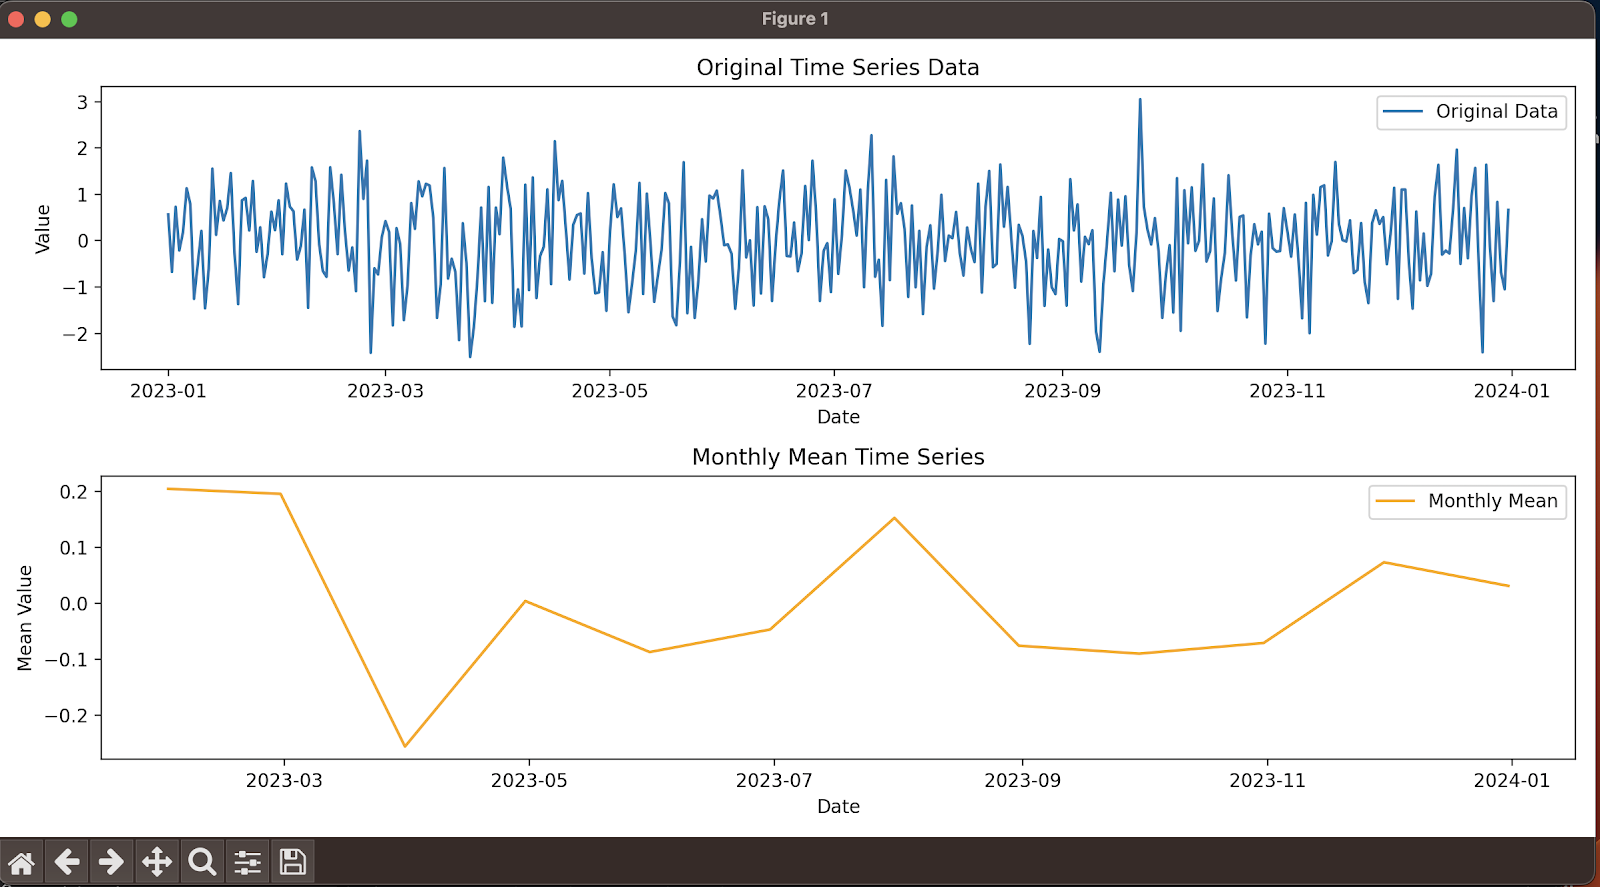 This code demonstrates the basics of working with time series data in Pandas, including data generation, resampling, and plotting.
2. Filtering data
You can easily filter your DataFrame based on specific date and time ranges. This is useful when you want to focus on a particular time period. For instance, consider the following code:
import pandas as pd

# Sample data with DateTime
data = {'Timestamp': ['2023-09-15 08:00:00', '2023-09-15 12:30:00', '2023-09-16 10:15:00', '2023-09-16 14:45:00'],
        'Value': [50, 75, 60, 85]}

df = pd.DataFrame(data)

# Convert the 'Timestamp' column to DateTime
df['Timestamp'] = pd.to_datetime(df['Timestamp'])

# Set 'Timestamp' as the DataFrame's index (important for time-based filtering)
df.set_index('Timestamp', inplace=True)

# Filtering data for a specific date range
start_date = '2023-09-15'
end_date = '2023-09-16'

filtered_df = df[start_date:end_date]

# Displaying the filtered DataFrame
print("Filtered Data:")
print(filtered_df)
In the above code, we create a DataFrame ‘df’ with columns ‘Timestamp’ and ‘Value’ to represent a time series of data. Then we convert the ‘Timestamp’ column to Pandas DateTime objects using pd.to_datetime(). This allows us to work with the timestamps as DateTime. In order to enable time-based filtering, we set the ‘Timestamp’ column as the DataFrame’s index using set_index(). After that, we define a start date and an end date to specify the date range we want to filter. In this case, let’s say we want data from ‘2023-09-15’ to ‘2023-09-16’.
Then we use these dates to filter the DataFrame, creating a new DataFrame ‘filtered_df’ that contains data only within the specified date range. Running the above code should print the following output:
Filtered Data:
                     Value
Timestamp
2023-09-15 08:00:00     50
2023-09-15 12:30:00     75
2023-09-16 10:15:00     60
2023-09-16 14:45:00     85
3. Calculating time differences
Pandas DateTime allows you to calculate time intervals and differences between DateTime values. This is valuable when analyzing time lags or durations.
import pandas as pd

# Create two DateTime objects
start_time = pd.to_datetime('2023-09-15 08:00:00')
end_time = pd.to_datetime('2023-09-15 10:30:00')

# Calculate the time difference
time_difference = end_time - start_time

print("Start Time:", start_time)
print("End Time:", end_time)
print("Time Difference:", time_difference)
When you run this code, it will display the start time, end time, and the time difference between them in terms of hours, minutes, and seconds. This is useful for tasks such as measuring the duration between two events or calculating time intervals in a time series dataset.
Start Time: 2023-09-15 08:00:00
End Time: 2023-09-15 10:30:00
Time Difference: 0 days 02:30:00
4. Grouping and aggregating
Grouping data by DateTime components (e.g., monthly, weekly) and applying aggregate functions can provide valuable insights into your dataset.
import pandas as pd
import numpy as np

# Generate sample time series data
date_rng = pd.date_range(start='2023-01-01', end='2023-12-31', freq='D')
data = {'date': date_rng,
        'value': np.random.randint(1, 100, size=len(date_rng))}
df = pd.DataFrame(data)

# Set the 'date' column as the index
df.set_index('date', inplace=True)

# Group data by month and calculate the sum
monthly_sum = df['value'].resample('M').sum()

print(monthly_sum)
In the above code, we generate a sample time series dataset with a ‘date’ column and a ‘value’ column containing random values for each day of the year 2023. Then, we set the ‘date’ column as the index of the DataFrame using set_index, which is important for time-based operations. After that, we group the data by month (resampling) using resample('M'), and then we apply the sum()aggregation function to calculate the sum of ‘value’ for each month.
Finally, we print the monthly_sumseries, which shows the aggregated sum of ‘value’ for each month in the time series:
date
2023-01-31    1612
2023-02-28    1485
2023-03-31    1413
2023-04-30    1689
2023-05-31    1667
2023-06-30    1645
2023-07-31    1544
2023-08-31    1655
2023-09-30    1230
2023-10-31    1689
2023-11-30    1436
2023-12-31    1366
Freq: M, Name: value, dtype: int64
5. Date formatting
Pandas DateTime also allows you to format DateTime objects into strings with custom date formats for better visualization or exporting data.
import pandas as pd

# Create a DateTime object
date_time = pd.to_datetime('2023-09-15 14:30:00')

# Format DateTime object into a custom string format
formatted_date = date_time.strftime('%Y-%m-%d %H:%M:%S')

print("Original DateTime:", date_time)
When you run this code, it will display the original DateTime and the custom-formatted date string:
Original DateTime: 2023-09-15 14:30:00
Formatted Date String: 2023-09-15 14:30:00
Formatting DateTime objects into custom strings is useful for better visualization, exporting data, or presenting date and time information in a specific format that suits your needs. You can customize the format string to include various components and separators as required.
FAQs
What is Pandas DateTime format?
Pandas DateTime format is a standardized way of representing date and time information. It includes components like year, month, day, hour, minute, second, etc. in a specific order.
How to use DateTime in Pandas?
You can use Pandas DateTime by converting strings to DateTime objects using pd.to_datetime(), performing various operations on DateTime data, and formatting DateTime objects into strings for display.
How to add DateTime to Pandas DataFrame?
To add DateTime to a Pandas DataFrame, you can create a new column and assign DateTime values to it using pd.to_datetime().
How to select data by DateTime in Pandas?
You can select data by DateTime in Pandas by creating a boolean mask that filters rows based on a specific date or time range.
Pandas DateTime is a powerful tool for working with date and time data in Python. Whether you’re analyzing time series data or performing date-based filtering, Pandas provides a flexible and efficient way to handle DateTime values. So, the next time you encounter DateTime data in your Python projects, remember to leverage Pandas to make your life easier.
This post was written by Siddhant Varma. Siddhant is a full stack JavaScript developer with expertise in frontend engineering. He’s worked with scaling multiple startups in India and has experience building products in the Ed-Tech and healthcare industries. Siddhant has a passion for teaching and a knack for writing. He’s also taught programming to many graduates, helping them become better future developers.
