We're going to GrafanaCon 2016
By
Chris Churilo
updated December 14, 2025
Use Cases
Navigate to:
We are excited to let you know that we will be at GrafanaCon2016 which will be held at the Intrepid Sea, Air & Space Museum on the Hudson River in NYC. Paul Dix, our CTO, will be there to meet with any attendee currently using InfluxData or have plans to do so. In preparation for this event, we wanted to hear from some of our users about how they are using InfluxDB and Grafana. Share with us your projects on twitter and we’ll place your entry in a raffle with a chance to win a free pass to GrafanaCon. We will select the winner on November 18, 2016 giving you plenty of time to get your questions ready for Paul!
To help inspire you, we are presenting you a few recent examples that have been shared with us by our users of solutions using InfluxDB and Grafana.
Currency Dashboard by Azahar Machwe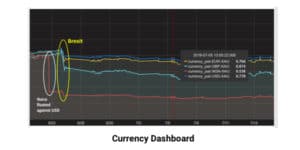 - In this example, Azahar built a time-series database that tracked the currency data over time - he even found some interesting data points around the time of Brexit!
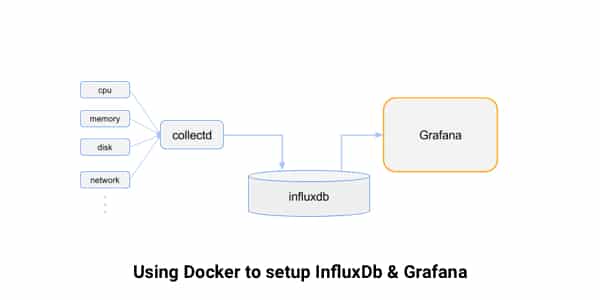
How to use docker to setup a simple monitoring stack using InfluxDB, collected, and Grafana by Xiao Han. Xiao provides a brief description of each tool and how to set it up.
Monitoring Anomalies in the Experimentation Platform by Deepak vashthimal & Roopa Penmetsa from eBay tech blog. It became a single point for monitoring & searching for anomalies in experiments for anyone in the company who runs experiments on the Experimentation platform.
