InfluxDB and Elementary School Science Fairs
By
Scott Anderson
updated December 14, 2025
Product
Use Cases
Developer
Navigate to:
I’m a proud father of an incredibly smart, talented, kind, and just all-around great 9 year-old daughter. Since she first learned to talk, she has been a “questioner,” curious about the world around her and how everything connects (you know, the kid who asks questions throughout an entire movie yeah, that’s her). As she’s grown older, her love of questions and need for answers has led her to gravitate toward math and science, both of which she excels at.
Every year her elementary school does a science fair and, as usual, she was all in. After some brainstorming and research, she wanted to know, “does playing video games affect your blood pressure?” Her hypothesis was that, due to the excitement and/or stress of playing, your blood pressure increases while playing. To test her hypothesis, she did the following:
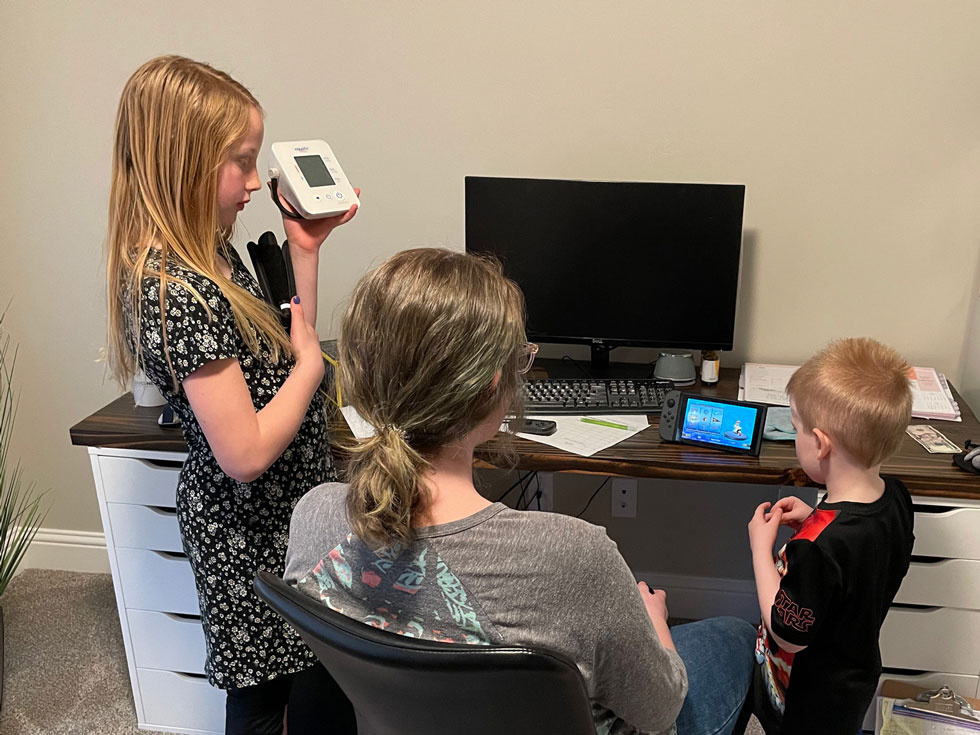
- Gathered test subjects (luckily we had a family dinner that provided a pool of willing participants that varied in age).
- Measured and recorded each test subject's blood pressure before playing.
- Had each test subject play Mario Kart 8 for 7 minutes (approximately two races).
- Measured and recorded each test subject's blood pressure after playing.
- Recorded the age and sex of each test subject.
I should interject and say that my wife and I support our daughter in whatever she sets out to do, but the work is hers to do. We’re just there to help. My daughter came up with her hypothesis, designed the experiment, made a list of supplies she needed, and then conducted the experiment. She’s pretty awesome.
Once she collected the data, she knew what questions she wanted to answer, but wasn’t sure of the best way to find the answers. Enter data-nerd-dad (me):
“I think I can help with this.”
I get to work with InfluxDB everyday, so I knew this is the type of data that InfluxDB would be really good at processing. So here’s what we did:
Convert results to line protocol
We first converted my daughter’s handwritten results into line protocol. We stored the data in a bloodpressure measurement, included name and age tags, and included fields for systolic (sys) and diastolic (dia) pressures.
Each test had two lines of line protocol; one for the initial blood pressure reading and one for the final blood pressure reading. The timestamps were arbitrary, but we wanted all the tests to align, so we used the same initial and final timestamps for all tests. Here’s what a result from a single test looked like in line protocol:
bloodpressure,name=Bob,age=32,sex=m sys=132,dia=80 1651003231
bloodpressure,name=Bob,age=32,sex=m sys=120,dia=70 1651003221
Write queries to answer questions
As with any data analysis, you first need questions to answer to know how to query the data appropriately. Here are the questions my daughter wanted to answer:
- What was the average change in blood pressure overall?
- Does sex matter?
- Does age matter?
So I began to build some queries and, while I was at it, a dashboard to visualize her results.
I built cells that displayed line graphs to show the change between the average starting and ending blood pressures as well as single stat cells to display the average numeric change of systolic and diastolic pressures. I did the same for sex segments and age segments. It took me about 20 minutes to build out the first version of the dashboard.
At this point, my daughter looked at the dashboard and said, “the change in numbers are hard to understand. Can we do a percentage change?”
Me, swelling with pride: “Absolutely.”
About 10 minutes later, all the single stat cells were updated to report the percentage change rather than just the mathematical difference. This is what our final dashboard looked like:

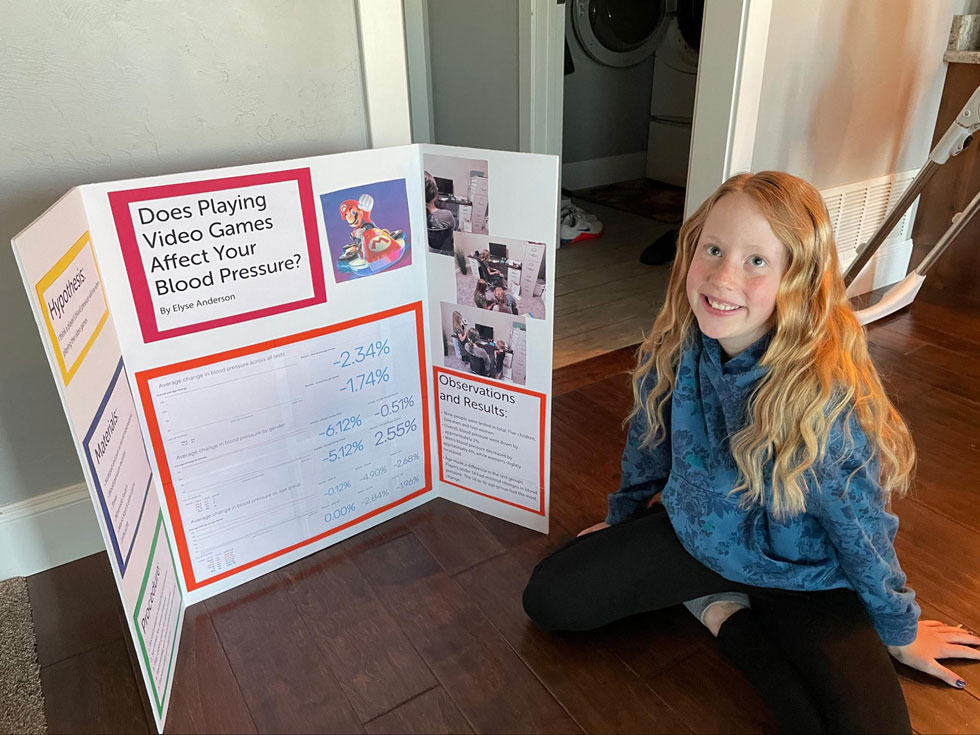
She asked if we could just use the dashboard on her project board, so we put the dashboard in presentation mode, toggled light mode (to save printer ink), printed the dashboard in tiles, taped them all together, and then glued them to her project board. Here was the result:
Her findings
While the sample size of the experiment wasn’t large enough to draw any concrete conclusions, there were some interesting results that my daughter observed:
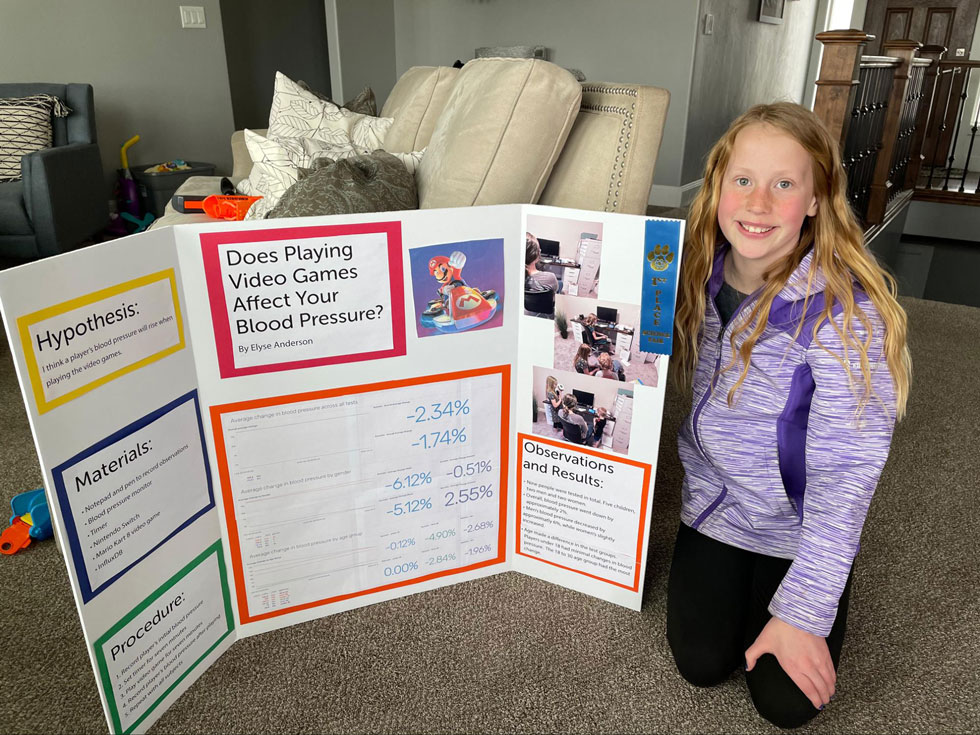
- Overall, blood pressure dropped by approximately 2% on average.
- The drop in blood pressure was higher in males than it was in females. Females saw almost no change in systolic pressure, but a slight increase in diastolic pressure.
- Test subjects under the age of 18 saw almost no change in blood pressure while subjects 19-30 years old saw the most significant change in blood pressure.
The result
It was a fun little experiment and my daughter got a taste of using InfluxDB to better understand the data she collected. AND she won her age group!
Blue ribbon or not, I’m incredibly proud of her. My daughter’s need to constantly ask questions and her love of learning are going to take her far in life. I’m excited to see where she goes and happy that I was able to introduce her to the powerful toolset I get to work with every day.
