Table of Contents
This post will walk through the steps to instrument a sample nodeJS/Express application, collecting our metrics with Telegraf, and storing them with InfluxDB. A subsequent post will cover the exploration of our data and building out a dashboard with Chronograf.
Why We Instrument
One thing I learned very quickly when getting into the application development scene is that applications in a development environment always seem to be all fine and dandy, but applications in production like to have problems. When your application is available to the whole wide world, you can be sure things will go wrong at times. Instrumenting your application affords you concrete evidence of the health of your application, allowing you to make smarter decisions for its progress over time and effectively handle issues that arise in a much more efficient manner.
The Process
So let’s learn how to instrument our application and start collecting some metrics. We’ll first need a sample application to monitor. I’ve generously provided a rather dilapidated-looking sample application for us to play around with that I built back in my school days, but feel free to substitute in your own nodeJS application. Let me present AmazonBay, an e-commerce app selling only one itemsurfboards.
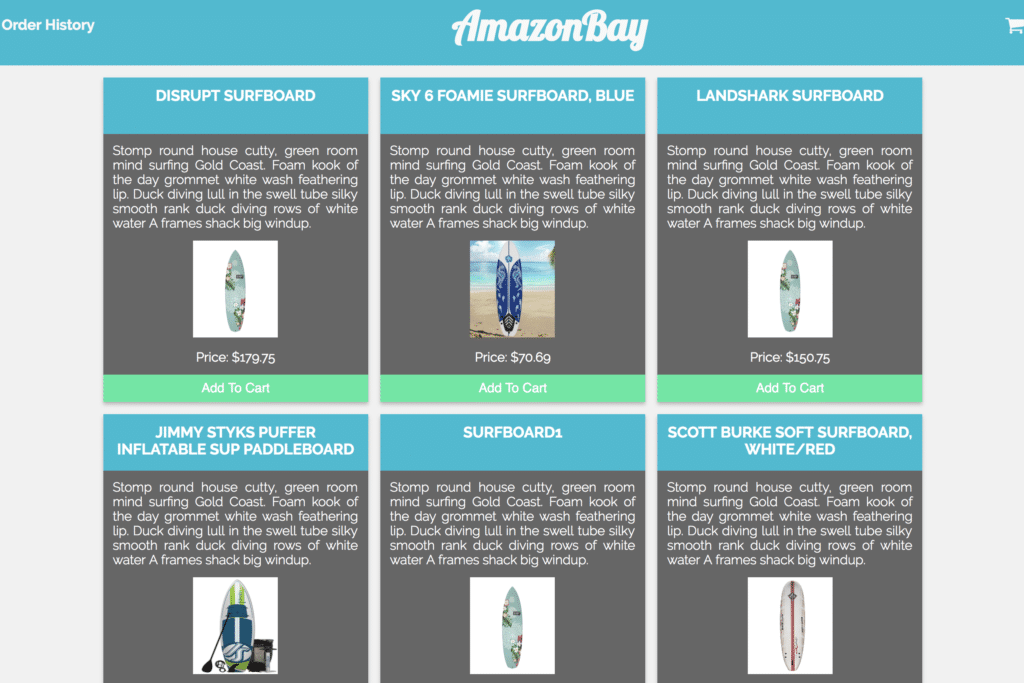 <figcaption> Yes, I’m aware the surfboard descriptions are all the same jumble of nonsense.</figcaption>
We’ll break it, fix it, and break it some more for good measure. However, I promise it will work by the end of this (I hope). You can clone down the repository here if you’d like to follow along. You’ll additionally need to have InfluxDB, and Telegraf installedthese links will take you to installation guides that can walk you through all that fun stuff.
There are a number of metrics libraries out there, and all have their pros and cons, but for the sake of time and simplicity, we will stick with IBM’s Node Application Metrics, available on GitHub, mostly because I felt their documentation was thorough and easy to get through. This metrics library will work with your Node application, regardless of whether you’ve pulled other libraries or frameworks into it, like ExpressJS for example. There are a few others, such as a NodeJS version of Coda Hale’s metrics library, or this express-node-metrics library condensed into a neat little npm package, and I would highly recommend testing out a few different ones to find the right fit.
First things first, we need to install this metrics library:
$ npm install appmetrics --saveNavigate to the server file (conveniently named server.js) and let’s require in the appmetrics library on the first two lines of the server file:
const appmetrics = require('appmetrics');
const monitoring = appmetrics.monitor();
As the documentation from the metrics library outlines, you must require in the appmetrics module first before any other require statements for any npm modules you will want to monitor. Appmetrics must be initialized first so that it can begin instrumenting modules for monitoring as they are loaded. The second line appmetrics.monitor() starts the data collection agent, thereby making the data available to collect and send on to InfluxDB.
Let’s add in the following sample code to our server file to check if anything is working:
monitoring.on('cpu', (cpu) => {
    console.log('[' + new Date(cpu.time) + '] CPU Process Percentage: ' + cpu.process + 'CPU System Percentage: ' + cpu.system);
});
Once the cpu event is triggered, this function will log the timestamp and the cpu process percentage (the percentage of cpu used by the application) along with the cpu system percentage. Start up your server with
$ node server.jsand you should momentarily see some output in the terminal.
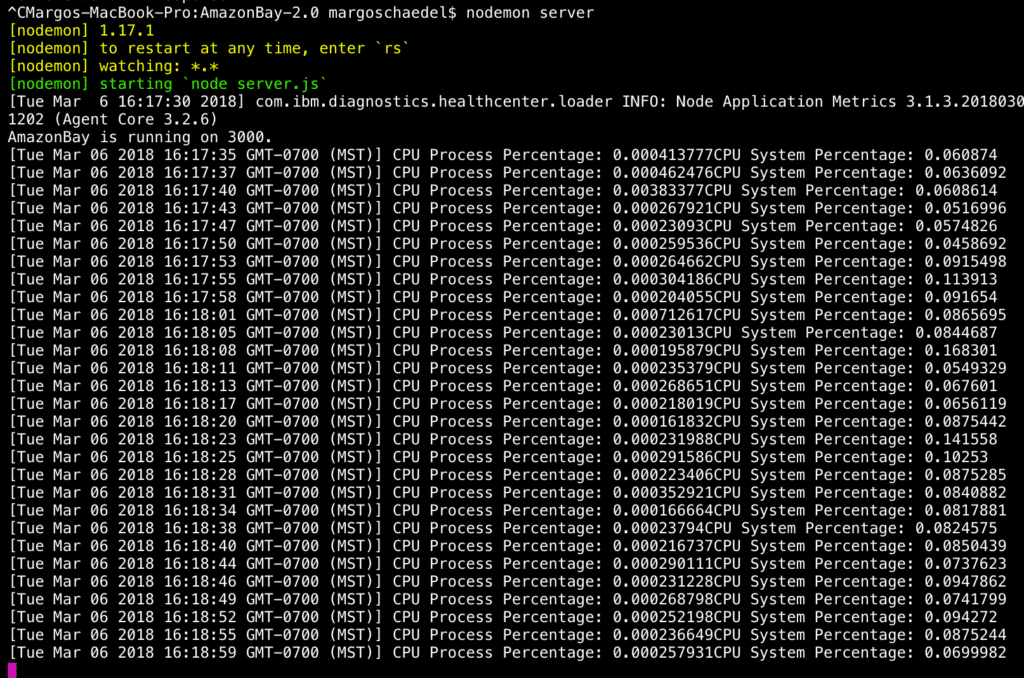 <figcaption> So many numbers!</figcaption>
Now while it’s satisfying to see that the application is indeed being monitored and we have got some data to dig into, it would make more sense for us to start collecting and storing it all together in one place. Enter Telegraf, our open source data collecting agent. We’ll send some data to InfluxDB (our database for storing time series data) via the HTTP listener service input plugin, which you can read all about here.
In the Telegraf config file, under the HTTP listener service input plugin, I’ve edited it so that once Telegraf is running, it will be listening on port 8186 for HTTP Post requests. It’s important to remember that the data being sent through must be in Influx Line Protocol; this particular plugin won’t accept any other format. Luckily for you, dear reader, we have a plethora of Telegraf plugins available (and you could always write your own!) that accept other data formats so there is something out there for everyone. For our purposes though, we’ll keep it simple and get some practice with Line Protocol.
Here is my config file:
# # Influx HTTP write listener
  [[inputs.http_listener]]
#   ## Address and port to host HTTP listener on
    service_address = ":8186"
#
#   ## maximum duration before timing out read of the request
    read_timeout = "10s"
#   ## maximum duration before timing out write of the response
    write_timeout = "10s"
#
#   ## Maximum allowed http request body size in bytes.
#   ## 0 means to use the default of 536,870,912 bytes (500 mebibytes)
    max_body_size = 0
#
#   ## Maximum line size allowed to be sent in bytes.
#   ## 0 means to use the default of 65536 bytes (64 kibibytes)
    max_line_size = 0
There are further edits you can make, such as if you want to enable TLS by specifying the file names of a service TLS certificate and key, or enable mutually authenticated TLS by including a list of authorized client connections, but we’ll save that for another day.
Start up Telegraf with
$ telegraf -config /usr/local/etc/telegraf.confand you should see evidence that it’s running:
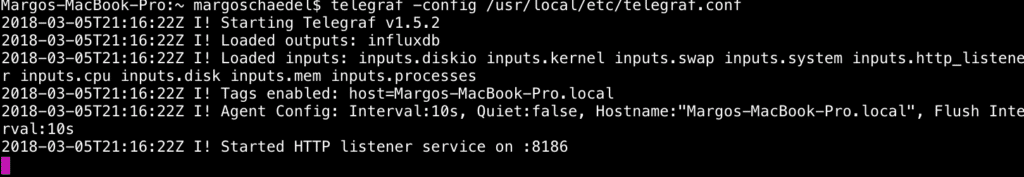 <figcaption> Things are happening.</figcaption>
Now that we have Telegraf successfully configured and running, it’s time to send some metrics on over to InfluxDB. Back in our server file, we will set up an HTTP Post request to the port our local Telegraf instance is listening on and see if anything happens.
monitoring.on('cpu', (cpu) => {
  const postData = `cpu_percentage,host=AmazonBay process=${cpu.process},system=${cpu.system} ${cpu.time}`;

  const options = {
    port: 8186,
    path: '/write?precision=ms',
    method: 'POST',
    headers: {'Content-Type': 'application/x-www-form-urlencoded'}
  };

  const req = http.request(options, (res) => {
    console.log(`STATUS: ${res.statusCode}`);
    console.log(`HEADERS: ${JSON.stringify(res.headers)}`);
    res.setEncoding('utf8');
    res.on('data', (chunk) => {
      console.log(`BODY: ${chunk}`);
    });
    res.on('end', () => {
      console.log('No more data in response.');
    });
  });

  req.on('error', (e) => {
    console.error(`problem with request: ${e.message}`);
  });

  req.write(postData);
  req.end();
});
There’s a lot going on here so let me elaborate. When the cpu event is triggered, we are calling a function which will execute the HTTP Post request. Our variable postData holds our cpu process, system, and timestamp values. In our options object, we’ve specified our port and path with the additional query parameter precision set to milliseconds, because InfluxDB’s timestamps default to nanoseconds. The host defaults to localhost which serves our present purposes. The rest of the code handles our request/response functionality and error paths.
Let’s start running it!
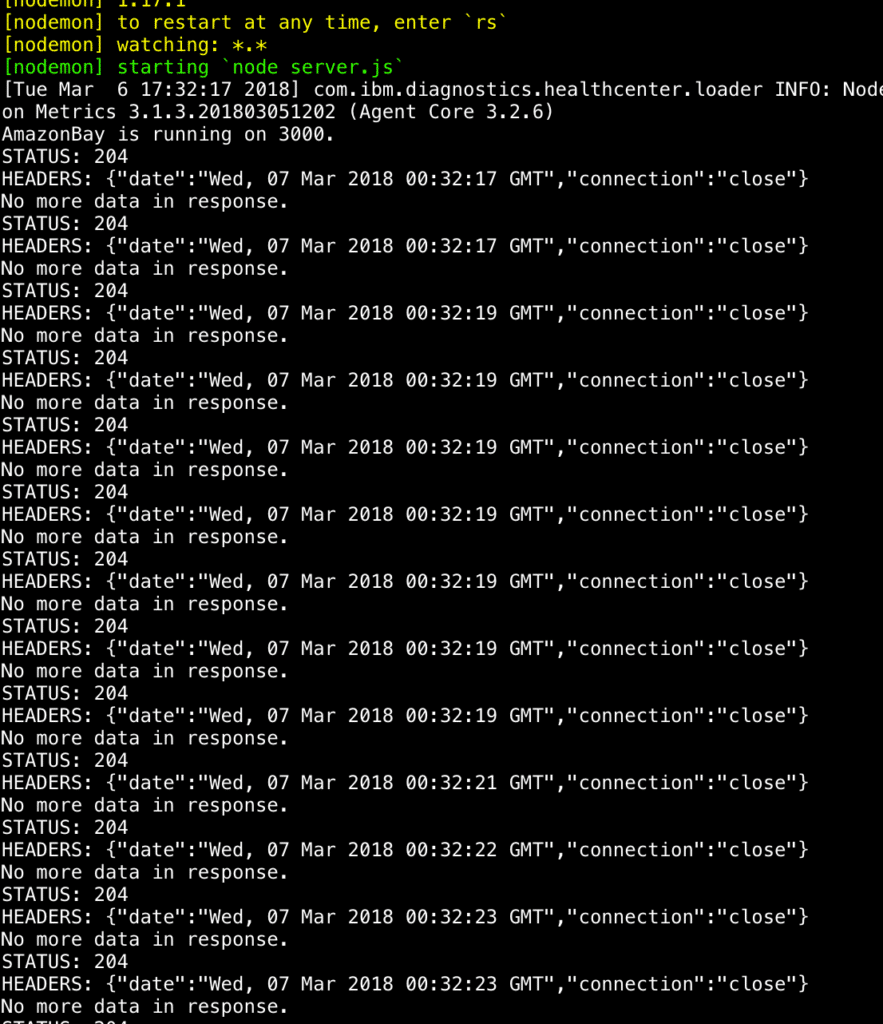 <figcaption> Logs Logs Logs</figcaption>
If we query our database, we should see some data stored there. You may have to adjust your time frame when querying so as not to overload your terminal with results.
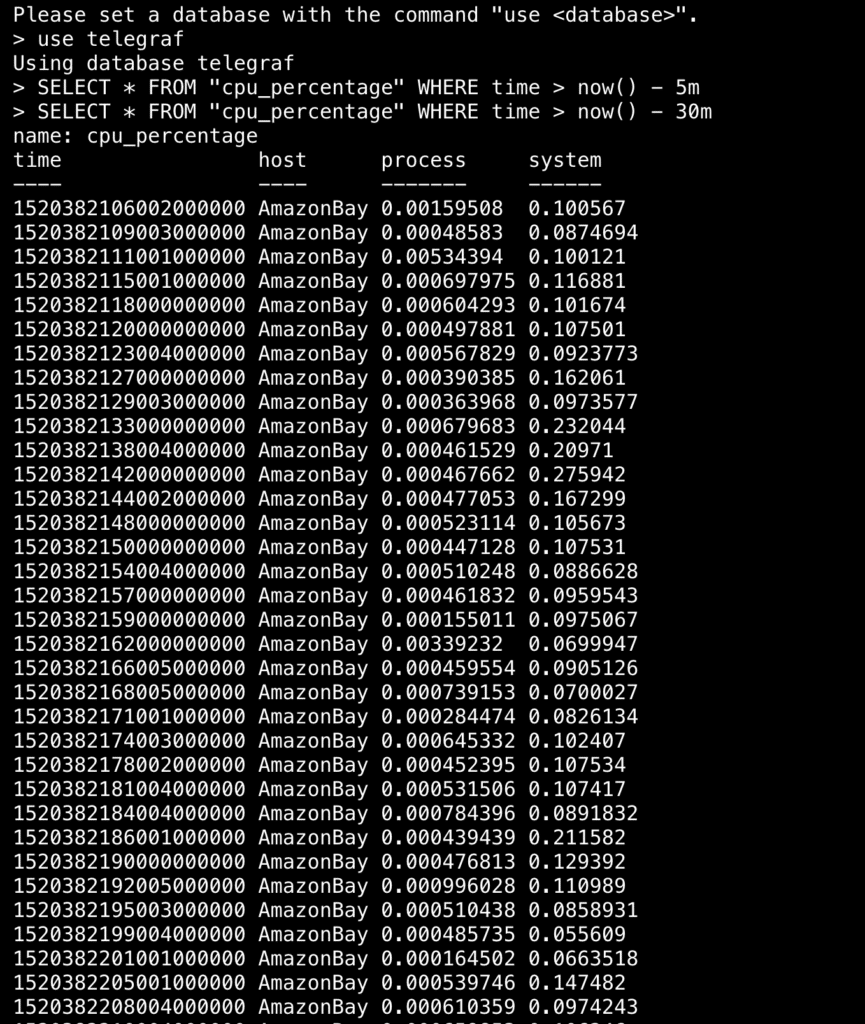 <figcaption> Just some data…</figcaption>
Next Steps
As you can see our data is now successfully being stored in InfluxDB. There are a number of other metrics available through this library that you can add in and store to InfluxDB. I’ve gone ahead and added a few more myself and pushed the finished app to GitHub: Instrumented-AmazonBay. In the next post, we will start exploring the data that’s being collected and build a dashboard within Chronograf. Thanks for reading and please feel free to reach out to me via [email protected], or hit me up on Twitter @mschae16 with any questions and/or comments.
