Table of Contents
(Update: InfluxDB 3.0 moved away from Flux and a built-in task engine. Users can use external tools, like Python-based Quix, to create tasks in InfluxDB 3.0.)
If you’re a 1.x user of InfluxDB, you might be a Kapacitor user as well. If so, you’re also familiar with TICKscripts, the data processing and transformation language for Kapacitor, the batch and stream processor for InfluxDB. Kapacitor is a great tool, but it’s largely a black box, so using and implementing TICKscripts to execute data processing tasks, checks, and notifications can be a challenging developer experience. Luckily, InfluxDB OSS 2.x and InfluxDB Cloud allow you to perform many of these transformations and alerts in a task. Tasks are Flux scripts that execute on a user-defined schedule. Flux is both the query and data transformation language in InfluxDB. Here are some of the advantages to using Flux over Kapacitor for data transformation work:
- You no longer have to maintain and learn two query languages (InfluxQL and TICKscripts) to create alerts, to execute continuous queries (now downsampling tasks), and to perform data transformations. Instead you can do that work with Flux.
- You are no longer working within a black box. You can use Flux to visualize the effect that each data transformation has on your data. You can verify that your tasks are producing the data you expect before running them on a schedule.
- You have access to more functions with Flux than with TICKscripts. You can also pivot data, manipulate timestamps, write custom functions, and more.
Yet trying to replace your Kapacitor workload with Flux tasks has the following disadvantages:
- The inability to perform real-time stream processing
- The inability to execute socket-based UDFs
However, InfluxDB Cloud and OSS 2.x are backward compatible with Kapacitor so you can always port your existing Kapacitor workloads over to InfluxDB Cloud or 2.x. We’ll perform the cost benefit analysis of upgrading your Kapacitor workloads to Flux tasks at the end of this post.
The aim of this blog is to help you translate your TICKscripts to Flux through pattern recognition. We’ll be translating the examples from the example directory in the Kapacitor repo. I encourage you to take a look at the following repo which contains the TICKscripts from that example directory and Flux task translations.
This blog assumes that you have a basic understanding of how Flux works. If you’re new to Flux I recommend reading the following two blogs first:
- TL;DR InfluxDB Tech Tips: Converting InfluxQL Queries to Flux Queries
- TL;DR InfluxDB Tech Tips – From Subqueries to Flux!
To gain a deep understanding of Flux, it’s important to understand:
- The basics of the language
- Annotated CSV, the output format of Flux queries
Example calculating error percent on Joined series
For our first translation, let’s convert the error_percent TICKscript to a Flux Task. In this TICKscript, we query for data from two different measurements (errors and views), find the sums of the values from the two measurements, join them, calculate the error percent ((sum of errors - sum of views)/ sum of errors), and then write the data to a new measurement. Let’s take a look at how the two scripts map to each other.
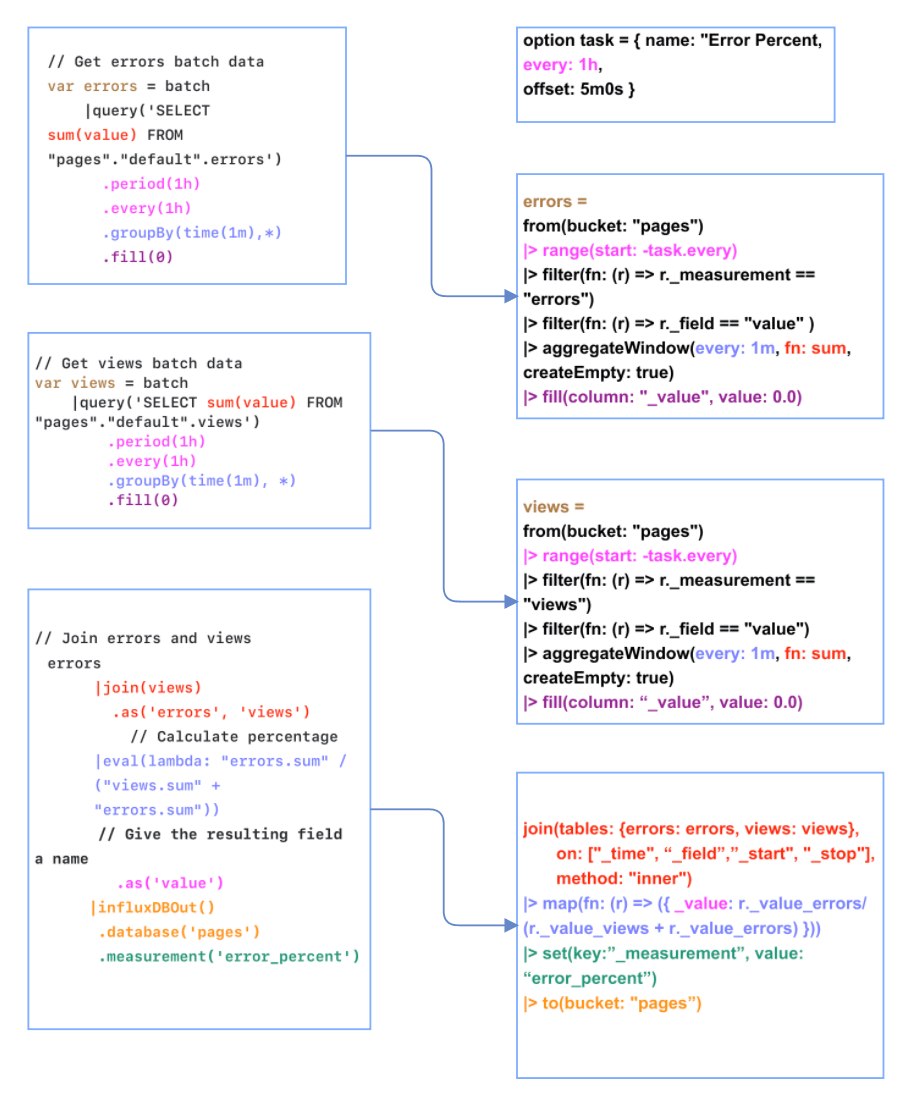
The TICKscript is on the left; the Flux script conversion is on the right.
First you need to define your task configuration options. Remember, Flux tasks currently only operate on batches of data. Specify the every option to determine the interval at which the task will run. Include an offset to avoid read and write conflicts. The offset option delays the task execution but has no effect on the range of data that’s being queried.
The every() property is equivalent to the every option in task configuration options. The period() property is equivalent to the duration of time we specify in the range() function, or how much data we want to query for. Use the aggregateWindow() function to window our data and apply the sum simultaneously, instead of selecting for the sum in the InfluxQL portion of the TICKscript and then applying the .groupBy property. Use the fill() function to fill empty windows of time with 0’s.
We follow this procedure for data from both measurements – errors and views – and store the results in a variable in Flux. Then use the join() function to join the data together. Now we can use a map() function to perform the percentage calculation and store it in a new column called “_value”. Finally, we use the set() function in lieu of the as() property and measurement() property to set the name of the measurement and newly calculated percentage. Lastly, use the to() function instead of the InfluxDBOut() node to write data to our new bucket/database.
A generic batch alerting example with standard deviation – TICKscript
A generic batch alerting example in Kapacitor might look something like:
// Step 1: Define thresholds
var info = {info_level}
var warn = {warn_level}
var crit = {crit_level}
var infoSig = 1
var warnSig = 2
var critSig = 3
var period = 10s
var every = 10s

// Step 2: Query for data.
var data = batch
  |query('''{InfluxQL_Query}''')
    .period(period)
    .every(every)
    .groupBy('host')

// Step 3: Define the conditions to trigger the alert.
var alert = data
  |eval(lambda: sigma("stat"))
    .as('sigma')
    .keep()
  |alert()
    .id('{{ index .Tags "host"}}/{alert_metric}')
    .message('{{ .ID }}:{{ index .Fields "stat" }}')
    .info(lambda: "stat" > info OR "sigma" > infoSig)
    .warn(lambda: "stat" > warn OR "sigma" > warnSig)
    .crit(lambda: "stat" > crit OR "sigma" > critSig)

// Step 4: Alert.
alert
.log('/tmp/{alert_name}_log.txt')- This generic batch alerting TICKscript example is a threshold alert. It contains the following steps: Define the thresholds for the raw values that we want to as well as the standard deviation thresholds.
- Query for our data.
- Define the conditions to trigger the alert.
- Alert. The log node logs all of your alerts. This alert endpoint isn't available in Flux, but almost every event handler is. See the complete list here.
- In the next section, we'll take a look at a generic batch alerting example in Flux. We'll discuss one approach in detail, but it's important to know that you have much more flexibility when it comes to writing Flux alerts than you do with Kapacitor alerts. However, more flexibility and power requires users to make some decisions around the best options for themselves.
A generic batch alerting example with standard deviation – Flux
Let’s look at the equivalent Flux task:
// Step 1: import Flux packages
import "influxdata/influxdb/monitor"
import "influxdata/influxdb/schema"
import "math"

// Step 2: define your task options.
// Always include an offset to avoid read and write conflicts. Period and every are defined by the every parameter.
option task = {
name: "generic",
every: 10s,
offset: 2s,
}

// Step 3: Define your thresholds.
infoVal = <info_level>
warnVal = <warn_level>
critVal = <crit_level>
infoSig = 1.0
warnSig = 2.0
critSig = 3.0

// Step 4: Query for data.
Data is grouped by tags or host by default so no need to groupBy('host') as with line 28 in generic_batch_example.tick
data = from(bucket: "<bucket>")
   |> range(start: -task.every)
   |> filter(fn: (r) => r._measurement == "<measurement>")
   |> filter(fn: (r) => r.host == "hostValue1" or r.host == "hostValue2")
   |> filter(fn: (r) => r._field == "stat")

// Step 5: Calculate the mean and standard deviation instead of .sigma and extract the scalar value.

// Calculate mean from sample and extract the value with findRecord()
mean_val = (data
   |> mean(column: "_value")
   // Insert yield() statements to visualize how your data is being transformed.
   // |> yield(name: "mean_val")
   |> findRecord(fn: (key) => true, idx: 0))._value

// Calculate standard deviation from sample and extract the value with findRecord()
stddev_val = (data
   |> stddev()
   // Insert yield() statements to visualize how your data is being transformed.
   // |> yield(name: "stddev")
   |> findRecord(fn: (key) => true, idx: 0))._value

// Step 6: Create a custom message to alert on data
alert = (level, type, eventValue)  => {
slack.message(
      // Will send alerts to the #notifications-testing channel in the InfluxData Slack Community
      url: "https://hooks.slack.com/services/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 ",
      text: "An alert \"${string(v: type)}\" event has occurred! The number of field values= \"${string(v: eventValue)}\".",
      color: "warning",
      )
      return level
      }
data
   // Step 7: Map across values and return the number of stddev to the level as well as a custom slack message defined in the alert() function.
   |> map(
       fn: (r) => ({r with
level: if r._value < mean_val + math.abs(x: stddev_val) and r._value > mean_val - math.abs(x: stddev_val) or r._value > infoVal then
             alert(level: 1, type: info, eventValue: r._value)
           else if r._value < mean_val + math.abs(x: stddev_val) * float(v: 2) and r.airTemperature > mean_val - math.abs(x: stddev_val) * float(v: 2) or r._value > okVal then
             alert(level: 2, type: ok, eventValue: r._value)
           else if r._value < mean_val + math.abs(x: stddev_val) * float(v: 3) and r.airTemperature > mean_val - math.abs(x: stddev_val) * float(v: 3) or r._value > warnVal then
             alert(level: 3, type: warn, eventValue: r._value)
           else
              alert(level: 4, type: crit, eventValue: r._value)
)

   // Use the to() function to write the level created by the map() function if you desire. This is not shown.
This generic batch alerting Flux example is a threshold alert. It contains the following steps:
- Import Flux packages. Flux code is organized into packages that contain one or more functions.
- Define your task options.
- Define your thresholds.
- Query for data.
- Calculate standard deviation from sample and extract the scalar value with findRecord().
- Create a custom message to alert on data. This function returns the standard deviations and calls the slack.message() function which sends a single message to a Slack channel. The alert() function also includes a type parameter which is used to identify the severity of the alert.
- Step 6: Map across each value at each timestamp and return the number of standard deviations each value is away from the mean to a new column called "level". The map() function evaluates whether or not each value is within 1, 2, or 3 standard deviations from the mean and also calls the custom alert() function. In this way, we are alerting on every value. This isn't a practical alert. In reality, you would probably only call the custom alert() function when the following conditions are met:
- The value exceeds the warn or crit thresholds.
- The value is more than 3 or 4 standard deviations away from the mean.
It’s important to recognize some key attributes about this generic batch alerting example with standard deviation in Flux:
- You can map across data and create new columns that contain metadata about our alerts. In this example, we create a level column that describes how anomalous our data is with conditional logic. You could add additional columns with whatever metadata you want.
- You can define custom functions.
- This is only one example of the myriad ways that you could execute this type of logic with Flux tasks.
Let’s discuss point 3 in a little more detail. Flux also contains a monitoring package. This package contains methods that are the Flux equivalent of commonly used TICKscript nodes (like StateDurationNode and StateChangesOnly) but it also contains the monitor.check() and monitor.notify() functions. These functions write a lot of metadata about your checks and notifications to the _monitoring bucket. Some users prefer to use these functions when creating alert tasks to have even more visibility into their alerts. There are two main approaches when it comes to using the monitoring package:
- Use 2 Flux tasks to generate an alert:
-
- The first task checks your data and evaluates whether or not your data meets the alert conditions.
- The second task sends an alert message or notification.
This is the way that tasks are created in the InfluxDB UI. Learn more about this approach here.
- Use 1 Flux task. Combine the check and notification work into one task. See an example of this approach here.
We’ll discuss the advantages and disadvantages of the three types of generic batch alerts approaches we learned about today in a future post. The main takeaway you should have right now is that Flux is very flexible.
A cost benefit analysis
This cost benefit analysis is complex. If you’re performing a large amount of stream-based Kapacitor tasks, I wouldn’t recommend switching to InfluxDB Cloud or InfluxDB OSS 2.x. Yes, there is backwards compatibility and you could run those Kapacitor tasks while upgrading to the latest version of InfluxDB. However, most users in this situation prefer to wait until streaming functionality is available in Flux tasks. The main exception is when users discover that Flux allows them to process and transform their data in ways that aren’t possible in Kapacitor. Sometimes, the need for more advanced analytics carries Kapacitor users over the barrier of having to migrate their instance and set up backwards compatibility to handle their streaming tasks. Finally, some users recognize that adopting the latest versions of InfluxDB and learning Flux will help them future-proof their time series data pipeline against maintaining and training on 3 separate languages – InfluxQL, Continuous Queries, TICKscripts.
Let’s take a moment to recap by highlighting the pros and cons of each tool. The advantages of using Kapacitor and InfluxDB 1.x include:
- The ability to perform stream processing
- The ability to create socket-based UDFs to make Kapacitor extensible to other languages
The disadvantages of Kapacitor and InfluxDB 1.xinclude:
- A challenging user experience. Kapacitor is very much a black box. It's harder to use and it's harder to train people on.
- 1.x users must learn InfluxQL, Continuous Queries, and TICKscripts to maintain their time series data.
The advantages of using Flux include:
- More functionality including the ability to:
- Easier developer experience.
- Insert yield() statements after every line of Flux code to see how each function is affecting and transforming your data. Use yield() functions like print statements.
- The ability to write metadata about your checks or transformations work.
- Maintaining one language, Flux, for all of your time series management is easier than maintaining and training on InfluxQL, Continuous Queries, and TICKscripts.
Further reading
This blog assumes that you have some experience with Flux already, but if you don’t you might be interested in the following resources:
- Checks and Notifications: This section of the Time to Awesome book describes how the checks and notifications system works in InfluxDB and how the UI generates checks and notifications.
- Alert Task: This covers another example of a basic alert task in Flux.
- Querying with Flux: If you're new to Flux, this is a great resource.
- InfluxDB Essentials: This free InfluxDB University course is a great resource for people who are new to InfluxDB Cloud or InfluxDB 2.x. In this course you'll get an introduction to all of the components of InfluxDB including the UI, Telegraf, and Flux.
- Beginner Flux: Another free InfluxDB University course.
- TL;DR InfluxDB Tech Tips: Converting InfluxQL Queries to Flux Queries: This a great resource for beginner Flux users who are familiar with InfluxQL.
