Write Millions of Points From CSV to InfluxDB with the 2.0 Python Client
By
Anais Dotis-Georgiou
updated December 14, 2025
Product
Use Cases
Developer
Navigate to:
Previously we showed you how to Write Points from CSV to InfluxDB with Telegraf. Today we will learn how you can write millions of points to InfluxDB 2.0 with the InfluxDB Python Client on your local machine in a matter of seconds. The inspiration for this blog and this exercise comes from Mark Litwintschik’s Benchmark. In the benchmark, Mark compares the query times for data from the Billion Taxi Rides Dataset against several databases. InfluxDB is excluded from the benchmark, but we thought we would give it a shot and share our results.
The 2.0 InfluxDB Python Client benchmark
As InfluxDB is an open source TSDB and since Mark’s Benchmark uses paid instances, we decided to modify the benchmark to highlight the capabilities of the OSS version. We hope to get you excited about the type of data ingestion you can execute at home. For our benchmark, a CSV containing 4.6M data points (a portion of the Billion Taxi Rides Dataset) is written to InfluxDB.
Here are the results of the Benchmark:
| InfluxDB 2.nightly 24.10.2019 | ||
| Method | Data Points | CPU [seconds] |
| Line Protocol over HTTP POST | 1,193,288 | 412 |
| Python(RX) single thread | 4,600,000* | 21 |
Benchmark conditions: 1 min test
- Data: 2,000 threads, automatic batching (if supported on client)
- Each thread writes 100 data points in 1 sec interval
- HW: Linux 5.2.9-1, AMD Ryzen 7 3700X 8-Core, 16GB
- ReactiveX parameters: flush interval 10ms, batch size 200,000
- Telegraf parameters: metric_batch_size, metric_buffer_limit has no effect on result
- Python 3.7, single thread batch_size 50000, flush_interval 10000
The multiprocessing capabilities of the new InfluxDB Python Client outperform HTTP POST by approximately 3 orders of magnitude.
 <figcaption> I love the InfluxDB Python Client</figcaption>
Sparknotes of multiprocess writes from CSV to InfluxDB with the 2.0 Python Client
The script that accompanies this benchmark can be found here. To learn about how to use the 2.0 InfluxDB Python Client, please read this blog or take a look at the client repo. The important points to notice about the script include:
- Line 44: Create the InfluxDBWriter class and include the url to the CSV file that you want to read from.
- Line 46: Configure the batch_size and flush_interval to 50,000 and 10,000 respectively to accommodate larger write batches.
- Lines 93-100: Specify your tags, fields, and timestamps here.
- Line 158: Instantiate the InfluxDBWriter as a multiprocessing process.
- Line 164: Create process pool for parallel encoding.
- Line 179: Write data to InfluxDB after converting incoming HTTP stream into sequence of Line Protocol.
Requirements: Please note that you need Python 3.7 to execute multiprocessing. I recommend setting up additional tooling like virtualenv, pyenv, or conda-env.
Conclusion
The write rate of the new Python Client is pretty wild. I can’t think of many situations where I’d need to write millions of points to my machine, but sometimes it’s just fun to try. I wrote the first 1M points of this taxi dataset using this script. I saved a portion of that dataset to a CSV file that was saved locally. I ran the client in a Conda environment with Python 3.7 and wrote to a local InfluxDB v2.0.0 Alpha instance. Observing System and Database performance metrics are useful for performing this type of benchmark, as they can help highlight performance issues and facilitate tuning. I used InfluxDB Cloud to monitor my local InfluxDB instance and my system to see how well my machine could fare.
I used the pre-built dashboard templates to look at my System Stats and InfluxDB metrics at a glance. I was able to write 1M points in 2m32s, but as you can see there were indeed some bottlenecks. Taking a look at the InfluxDB Monitoring Dashboard, we can see the Local Object Store IO spikes and so does the Memory Usage.
 <figcaption> Monitoring my local InfluxDB v2.0.0 Alpha instance on InfluxDB Cloud</figcaption>
The System Stats dashboard shows that my System Load and Disk IO was quite high. I also noticed that my CPU usage and Memory Usage is reasonable. This indicates that I might be able to change my batch size to increase my performance by utilizing more CPU and Memory.
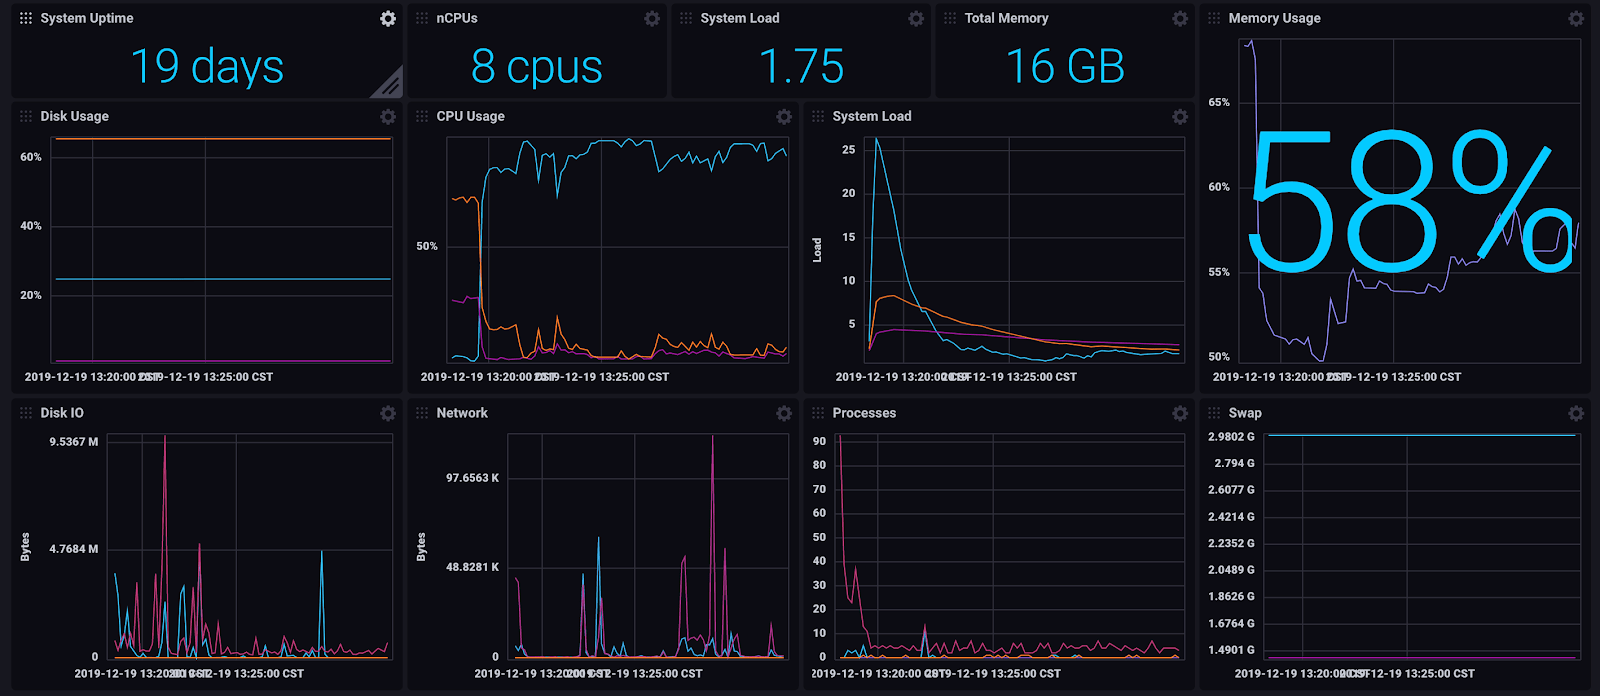 <figcaption> Dashboard for System Stats, complete with Disk Usage, CPU Usage, System Load, Memory Usage, and Disk IO. Usage_Idle (light blue)</figcaption>
Finally, I think it’s important to remember that I achieved this type of performance on the Alpha on my machine (while running other processes…whoops). Imagine what the Beta where stability and performance are prioritized will look like! I hope this benchmark got you thinking about time series possibilities. As always, if you run into hurdles, please share them on our community site or Slack channel. We’d love to get your feedback and help you with any problems you run into.
