JSON to InfluxDB with Telegraf and Starlark
By
Sam Dillard
updated December 14, 2025
Product
Use Cases
Developer
Navigate to:
Data platforms or databases with sets of APIs for flexibly working with data are quintessential backbones for those who rely heavily on being able to change how they obtain data and work with their data over time. A good data platform will provide you the necessary tools to glean the insights you need to solve tangible problems. That platform should also hopefully make it so you don’t have a bad time doing it!
In this blog post, I’m talking about data (metrics) acquisition in the context of JSON and using Telegraf to accomplish it, by converting JSON to Line Protocol.
The JSON data format is ubiquitous in the world of metrics which makes it deserving of at least one blog entry on its own. If you have time series data in the JSON format and want it in a platform with which you can make sense of it all, this post is for you…so let’s get to it.
[SPOILER ALERT] We will be turning this JSON:
{
   "stats": [{
       "fields": {
           "count": "1"
       },
       "tags": [{
           "field": "group",
           "value": "Engineering"
       }, {
           "field": "state",
           "value": "New"
       }]
   }, {
       "fields": {
           "count": "34"
       },
       "tags": [{
           "field": "group",
           "value": "Engineering"
       }, {
           "field": "state",
           "value": "In Progress"
       }]
   }, {
       "fields": {
           "count": "1"
       },
       "tags": [{
           "field": "group",
           "value": "Engineering"
       }, {
           "field": "state",
           "value": "On Hold"
       }]
   }, {
       "fields": {
           "count": "95"
       },
       "tags": [{
           "field": "group",
           "value": "Engineering"
       }, {
           "field": "state",
           "value": "Closed"
       }]
   }, {
       "fields": {
           "count": "1"
       },
       "tags": [{
           "field": "group",
           "value": "Engineering"
       }, {
           "field": "state",
           "value": "Canceled"
       }]
   }]
}.into this Line Protocol:
stats,group=engineering,state=new count=1i 1614800220766085000
stats,group=engineering,state=in_progress count=34i 1614800220766115000
stats,group=engineering,state=on_hold count=1i 1614800220766121000
stats,group=engineering,state=closed count=95i 1614800220766126000
stats,group=engineering,state=canceled count=1i 1614800220766130000
Note: some background on Telegraf and the value it brings can be found in these resources:
- Optimizing InfluxDB Performance for High Velocity Data
- Sam Dillard [InfluxData] | Performance Optimization in InfluxDB
- Sam Dillard [InfluxData] | Optimizing InfluxDB Performance in the Real World | InfluxDays SF 2019
Telegraf has many different Input Plugins that let you collect JSON data, including:
Once you’ve collected JSON data using one more of the above, Telegraf has two plugins that let you to transform it:
This post is about option #2, the Starlark Processor Plugin, but the gist of the JSON Parser is:
- It's useful for simple (usually "flat") JSON.
- It takes parameters to determine what keys will be Measurements, Tags, Fields, and your timestamp.
- It implements GJSON for drilling down into only the parts of the JSON you need.
- None of the above is useful for more complex (nested) JSON.
Now onto Starlark. Starlark (spec here) is a dialect of Python. It is not Python but looks, and mostly acts, like it. It is implemented as an embedded scripting language in Telegraf. Check out some pre-written examples here.
Having a dialect of a language as pervasive as Python embedded in Telegraf makes for a low barrier to entry. Using Starlark in Telegraf vs. a separate Python script/process gives the user access to:
- Client behavior framework built into Telegraf
- Native access to other Telegraf plugins
- Access to Telegraf's Metric object
- No parsing Line Protocol
- No generating own Line Protocol
Below is a hypothetical topology of a single Telegraf instance configured with a Starlark processor to parse JSON from two different sources:
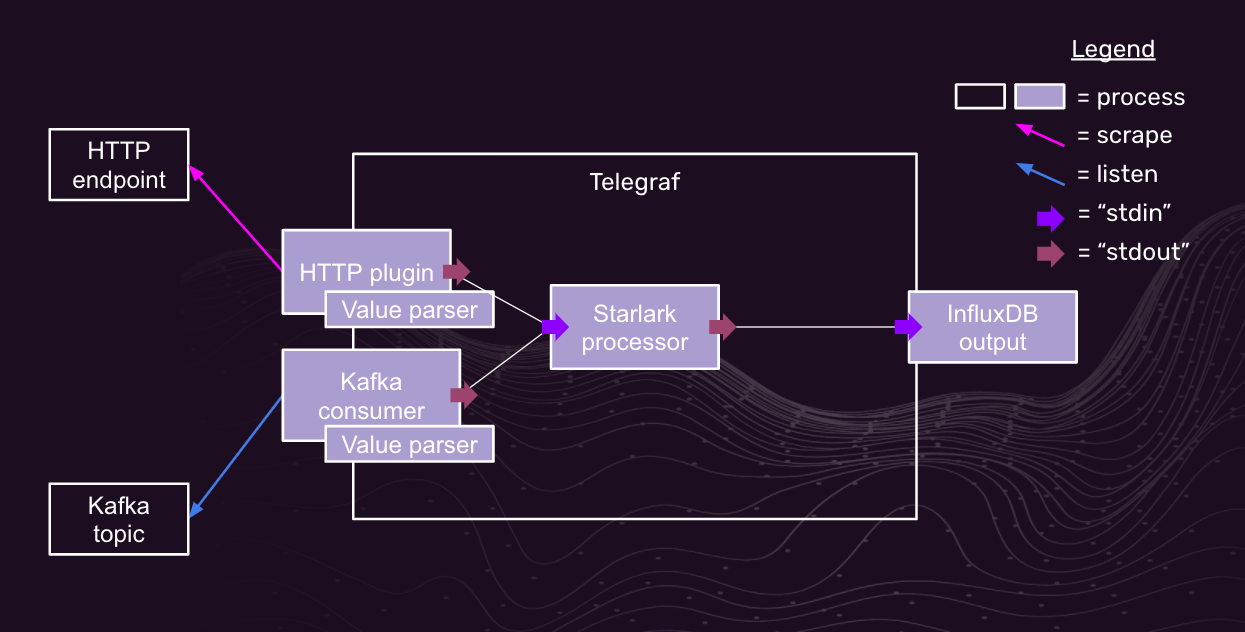
This topology uses the following software components:
- Telegraf itself, of course
- Telegraf HTTP Input plugin
- Telegraf Apache Kafka Consumer plugin
- Telegraf Starlark Processor plugin
- Telegraf InfluxDB Output plugin
Now let’s dive into what configuring this looks like:
You may have noticed the “Value parser” process in the above diagram. This is one extra bit of configuration that serves to avoid any default parsing of the JSON fed through the input/s you’ve chosen. It simply puts the entire untouched “blob” of JSON into a Field called value. This value Field is going to contain all the information that Starlark is going to need…and we will end up dropping the Telegraf Metric that contained it in the first place.
Configuration of the HTTP Input Plugin and the Value parser in Telegraf:
[[inputs.http]]
   urls = ["<URL>"]
   data_format = "value"
   data_type = "string"
The first two lines enable the HTTP Plugin and set an endpoint to be scraped. The next (last) two lines invoke the Value parser and tell it to pass the entire blob as a string. And we’re done.
Configuration of the Starlark processor:
[[processors.starlark]]
    namepass = ["file"]
    script = "/path/to/<script>.star"
And that’s it. Full example Telegraf configuration here.
In the video below, I run through an example of coding the Starlark necessary to parse the JSON earlier in this blog post, only this time the JSON is coming from a file (not an HTTP endpoint). Below is the final code in <script>.star:
load("json.star", "json")

def apply(metric):
   j = json.decode(metric.fields.get("value"))
   metrics = []
   for group in j["stats"]:  # Array of JSON elements to become Metrics
       new_metric = Metric("stats")
       new_metric.fields["count"] = int(group["fields"]["count"]) # Set "count" Field
	# Set `group` and `state` Tags
       new_metric.tags["group"] = group["tags"][0]["value"].lower().replace(" ", "_")
       new_metric.tags["state"] = group["tags"][1]["value"].lower().replace(" ", "_")
       metrics.append(new_metric)

   return metrics
Again, the final output:
stats,group=engineering,state=new count=1i 1614800220766085000
stats,group=engineering,state=in_progress count=34i 1614800220766115000
stats,group=engineering,state=on_hold count=1i 1614800220766121000
stats,group=engineering,state=closed count=95i 1614800220766126000
stats,group=engineering,state=canceled count=1i 1614800220766130000
Let’s break down the line protocol shown above:
- The Measurement name is
stats - There are two tags:
groupandstate(Groupis now lowercase just a best practice) - The
grouptag can have a value ofengineering(Engineeringnow lowercase) - The state tag can have values of
new,in_progress,canceled,on_hold, orclosed(now lowercase and spaces replaced with underscores) - There is one field,
count, which is an integer - At the end of each line in Line Protocol is a timestamp in Unix time format (the number of seconds since January 1, 1970)
- Note that we can pass through a timestamp provided by the JSON (event time). If one does not exist, one will be provided by Telegraf (processing time)
So there you have it Telegraf converting JSON to Line Protocol using Starlark. If you want to see more code samples of how to use the Telegraf Starklark plugin, check out this blog post.
And, if you have time series data exposed/emitted in JSON and would like to wrangle it into useful graphs and alerts, get started by signing up for a free InfluxDB Cloud account. Once you do, feel free to ask any questions in the ever-helpful InfluxDB community and community Slack channel. Enjoy!
