Community Spotlight: A Native iOS App for Your InfluxDB Data
By
Ashley Fowler
May 19, 2026
Use Cases
Developer
Navigate to:
One of the things we love most about building an open source platform is seeing what the community creates with it, and independent developer Anton Havekes recently built something we just had to share.
Anton put together Influx Dashboard, a native iOS app that connects to your InfluxDB instance and brings your time series data straight to your phone. We’re genuinely thrilled to see this kind of work come out of the community.
A quick note before we dive in: this is entirely Anton’s project, built and published by him. InfluxData has no commercial relationship or financial stake in the app. We’re sharing it simply because we think it’s a great piece of community work and because surfacing what people build on InfluxDB is something we’ll always make time for. So, thank you, Anton, for the awesome work you’ve done!
Here’s how it works.
What is Influx Dashboard?
Influx Dashboard is a mobile-first visualization tool for InfluxDB. It supports InfluxDB versions 1, 2, and 3—including Core, Enterprise, and Cloud editions—and gives you a full-featured charting experience on your phone.
Think of it as the community-built, mobile companion to the InfluxDB 3 Explorer UI. Instead of opening a browser on your laptop, you open an app. Instead of sitting at a desk, you monitor your data from wherever you are.
Key features include:
- Real-time line, bar, gauge, and pie charts
- Support for SQL queries
- An intuitive drag-and-drop dashboard builder
- Direct, secure connections to your InfluxDB server
- Works with any kind of time series data: server metrics, IoT sensors, weather stations, factory equipment, and more
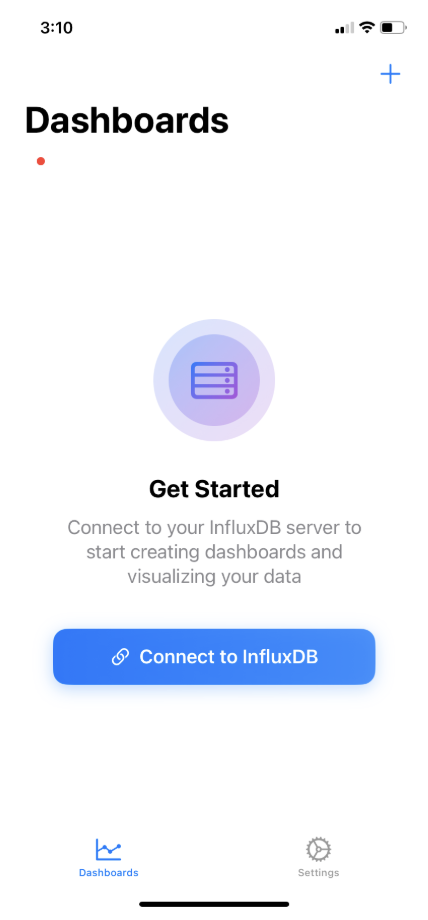
Step 1: Download the App
Influx Dashboard is available on the Apple App Store for $4.99 (InfluxData is not commercially affiliated with this app and receives no proceeds from purchases). Once downloaded, open the app, and you’ll be ready to connect to your InfluxDB server.
Step 2: Connect to Your InfluxDB Server
Before you can see any data, you’ll need to connect the app to your InfluxDB instance. Tap Add Server on the main screen.
You’ll need a few things from your InfluxDB setup:
Server URL: the address of your InfluxDB instance
API Token: your authentication token (found in InfluxDB under Management → Tokens)
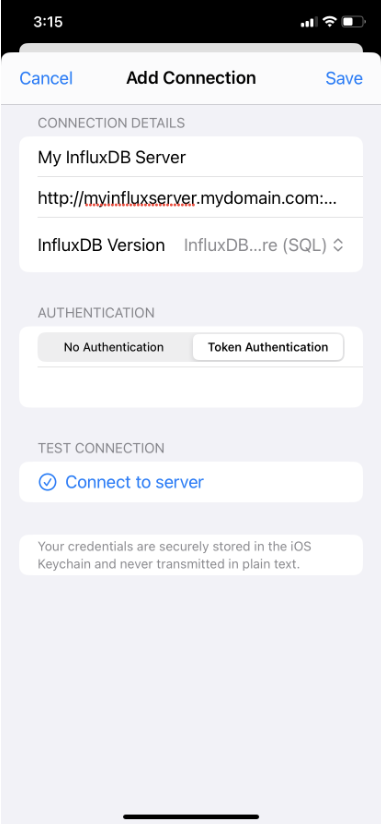
If you’re using InfluxDB Cloud, your server URL will look something like https://us-east-1-1.aws.cloud2.influxdata.com. If you’re connecting to a self-hosted instance, your admin can provide the URL and token.
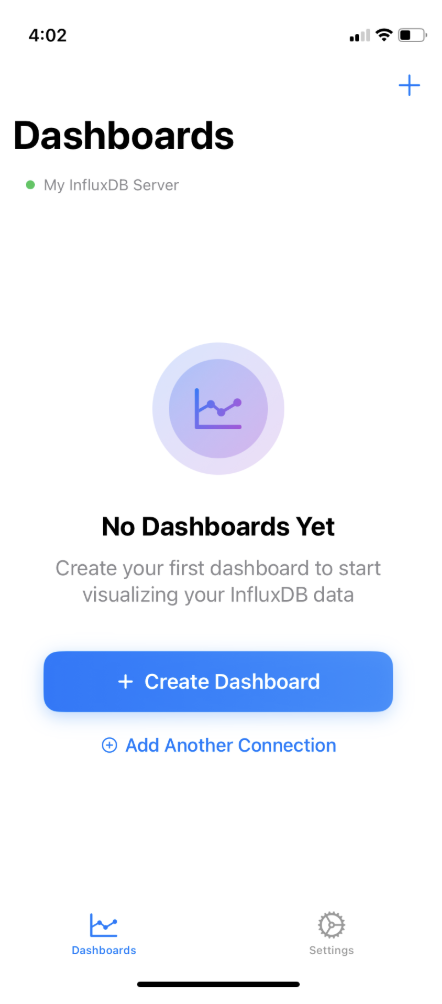
Once connected, the app loads your available databases, and you’re ready to build your first dashboard.
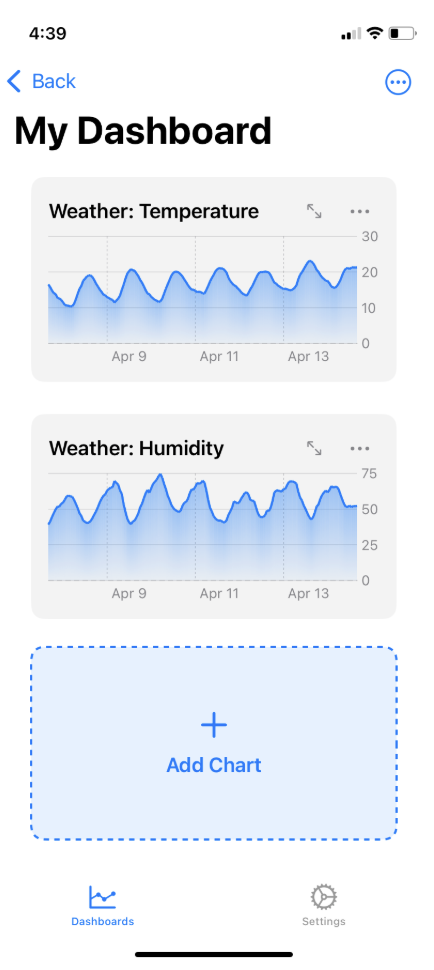
Step 3: Build Your Dashboard
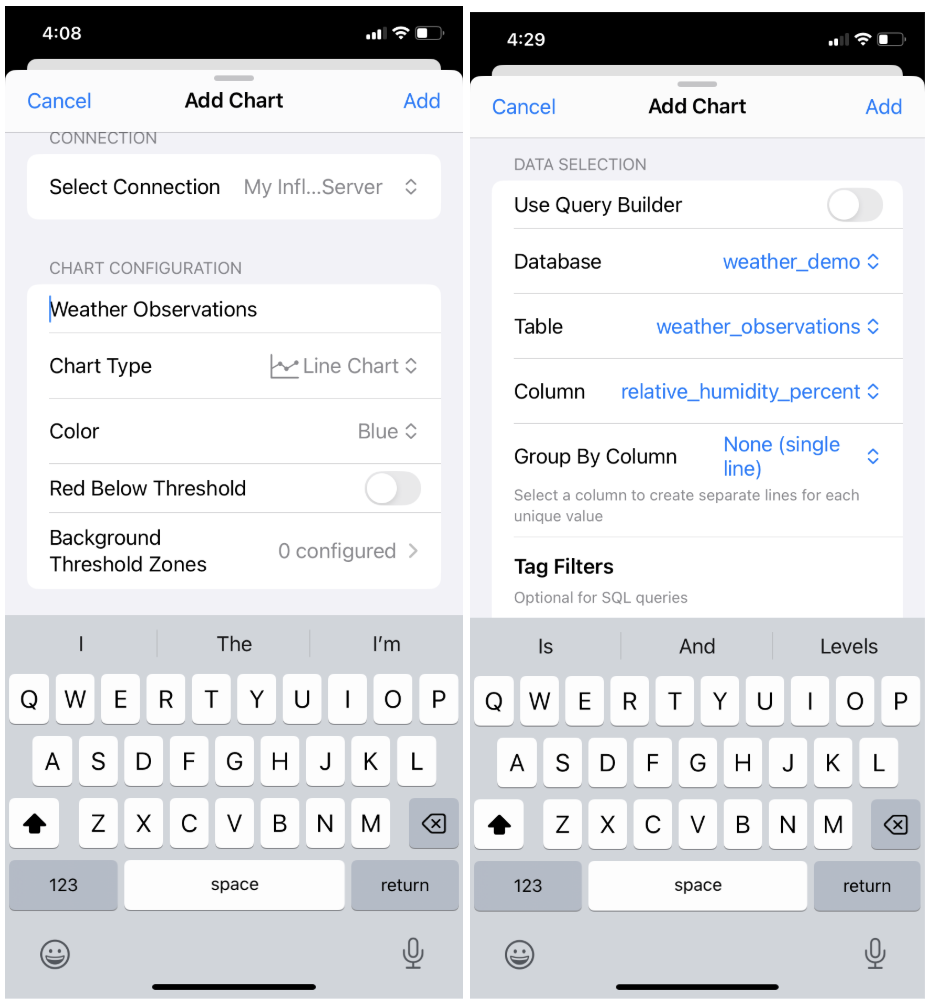
Tap + New Dashboard and give it a name. Then tap Add Chart to create your first visualization.
The chart builder is straightforward, even if you’ve never written a database query before. You’ll see options for:
Chart Title: give your chart a descriptive name
Chart Type: choose from line, bar, gauge, or pie
Database: select which InfluxDB database to query
Table: select the specific measurement or table within that database
Column: choose which field to visualize
Time Range: pick how far back to look (last hour, last 24 hours, last 7 days, and more)
Aggregation Window: control how data points are grouped over time to smooth out your chart
Step 4: Query Your Data
One of the things that makes Influx Dashboard powerful is that it works with virtually any kind of time series data. During our testing, we connected to several different databases, each representing a completely different real-world use case:
Server monitoring: CPU usage and memory metrics from a live server, showing system health at a glance.
Industrial IoT: Factory sensor data streamed via MQTT, the kind of data you’d see in a manufacturing or industrial environment.
Weather stations: Real-time weather observations, including temperature, humidity, wind speed, and barometric pressure, from stations across multiple locations.
Personal IoT sensors: A live “feels like” temperature sensor from a personal weather station in Holualoa, Hawaii.
The app handled all of them identically: same interface, same workflow, completely different data. That versatility is one of Influx Dashboard’s biggest strengths.
Step 5: Explore Your Charts
Once your charts are built, they appear on your dashboard and refresh automatically with live data.
Tap any chart to expand it to full screen for a closer look. From the full-screen view, you can inspect trends, zoom in on specific time windows, and get a clearer picture of what your data is doing.
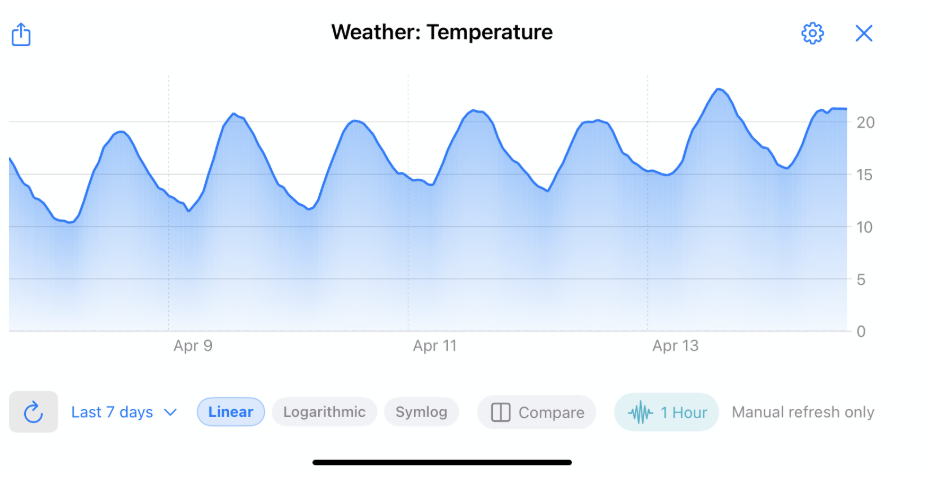
Use the time range selector at the top of the dashboard to zoom in or out, from the last hour to the last 30 days. This is especially useful when you’re looking for a specific event or trying to understand a longer trend.
Step 6: Manage Your Servers
From the Settings screen, you can manage your server connections, add new servers, or update your credentials. If your organization uses multiple InfluxDB instances, for example, a production server and a staging server, you can easily switch between them. You can also rename or delete servers you no longer need, keeping your workspace clean as your infrastructure evolves.
Why this matters
DevOps engineers, IoT developers, data engineers, and system administrators often need visibility into their time series data when they’re nowhere near a laptop, from a factory floor, at a remote deployment, or just away from their desk. Influx Dashboard closes that gap. Not through an official InfluxData product, but through something a community member decided to go build.
That’s exactly the kind of activity an open source ecosystem should produce, and it’s exactly why we wanted to share it.
Get started
- Download Influx Dashboard on the Apple App Store (independently developed by Anton Havekes—InfluxData is not affiliated with this app and receives no proceeds from purchases).
- Don’t have InfluxDB yet? Get started free with InfluxDB 3 Core.
- Explore the InfluxDB 3 Explorer UI at docs.influxdata.com
- Built something on InfluxDB you want to share? Join the conversation at the InfluxData Community Forums.
