Table of Contents
With over 500,000 residential, business, and wholesale customers across multiple markets in the United States, WideOpenWest (WOW!) is one of the United States’ largest broadband providers. They aim to connect homes and businesses to the world with fast and reliable internet, TV, and phone services.
WOW!’s challenge
As a data-driven organization, WOW!’s support team wanted to detect network outages using data from the network nodes (devices), rather than customer calls. But WOW!’s support engineering team faced challenges from the diversity of their distributed field equipment. WOW!’s networks consist of both brownfield and greenfield builds, which are cable and fiber, or all-fiber networks, respectively. WOW!’s nodes (modems and other DOCSIS devices) are different models, created by different vendors, and come with their own set of specifications. It’s cost prohibitive for WOW! to make every network a greenfield build and buy uniform technology because WOW! has networks all over the United States and monitors upwards of 800,000 modems. Monitoring this massive number of varying technologies kept WOW!’s engineering team locked in a disjointed legacy observability solution.
WOW!’s legacy monitoring platforms offered insight into their infrastructure, but diverse vendor-locked data collection, monitoring restrictions, and technical requirements led to separate platforms and dashboards for different groups of networks and nodes. The lack of a centralized observability platform meant WOW! engineers had no way of analyzing all their nodes and networks in one place. In addition to the complexities added by WOW!’s disjointed dashboards and platforms, WOW!’s engineering team used a time series database that failed regularly.
WOW!’s engineering team needed to better understand the health of each node and their networks overall. The engineers hypothesized that a centralized datastore with real-time and historical analytic viewing capabilities will provide more visibility into the node and network health.
The solution
Time series benchmark testing introduced WOW! engineers to InfluxDB’s superior write speeds. When WOW! engineers decided to modernize their legacy system, they selected InfluxDB Enterprise (now available as InfluxDB Clustered) as the time series database backend. InfluxDB offered WOW! engineers something no other vendors or monitoring solutions could – the flexibility to work around all restrictions to create a single monitoring platform.
The architecture
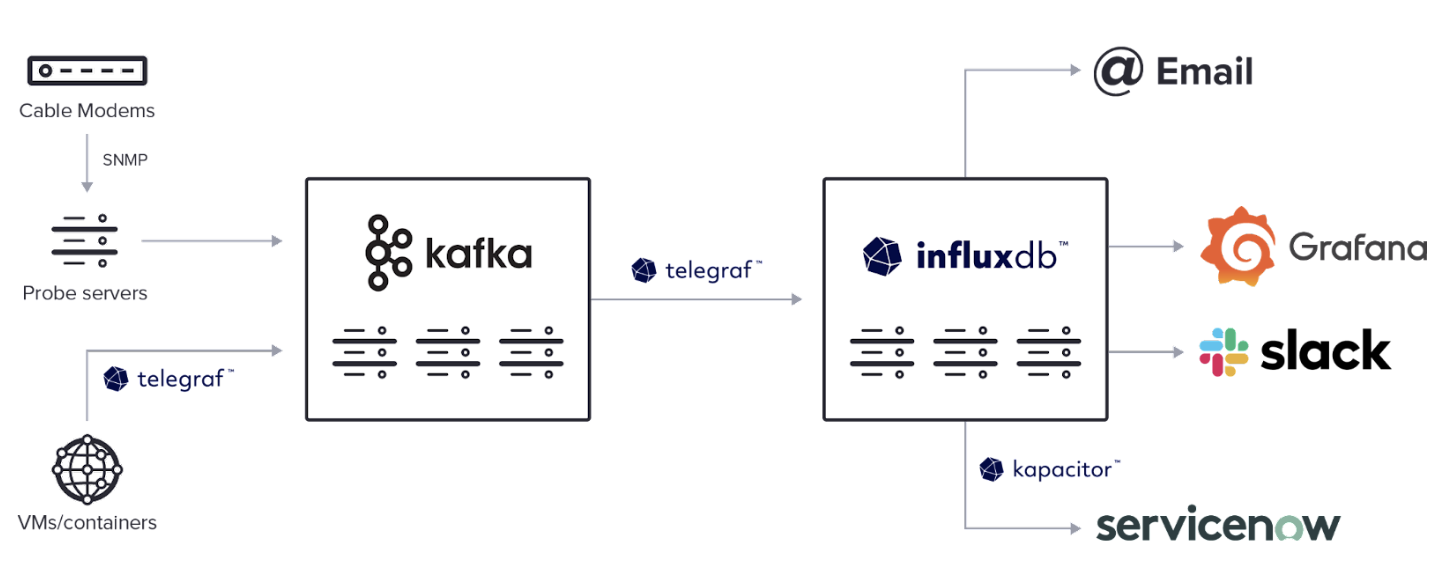
WOW!’s monitoring platform consists of a four-node InfluxDB cluster in production and a two-node InfluxDB cluster running on OpenStack for testing. WOW! engineers use InfluxDB to derive insight from real-time analytics, create visualizations, and trigger alerts and the troubleshooting process. WOW! engineers leverage InfluxDB’s alerting frameworks to send alerts via Slack, email, and ServiceNow, their automatic ticketing platform. WOW! engineers use Grafana to create customized dashboarding. This includes custom dashboarding for real-time analytics and historical trend analysis.
The engineers built a Kafka cluster and placed it between the data sources and InfluxDB. This provides an additional layer of redundancy and control of the data flow. WOW! engineers use Simple Network Management Protocol (SNMP) polling and traps to collect data from roughly 650,000 cable modems in five-minute cycles. WOW! engineers collect data from most of their virtual machines (VMs) and containers using Telegraf. After the modernization, WOW! engineers implemented an infrastructure-as-code system using Ansible. The engineers now use Ansible to automate cluster setup and installation.
Leveraging Telegraf, InfluxDB, and Grafana, also known as the TIG stack, created a complete picture of WOW!’s device and network health. This led to higher functionality and lower downtimes.
To learn more about WideOpenWest, read the full case study here.
