Alerting with Grafana and InfluxDB Cloud Serverless
By
Anais Dotis-Georgiou
updated October 20, 2023
Product
Navigate to:
This article was originally published in The New Stack and is reposted here with permission.
Combining these two platforms provides an efficient, scalable and customizable tool for real-time data monitoring and alerting.
In the data analytics and visualization world, it is crucial to have a system that not only effectively monitors your data, but can also alert you about any potential discrepancies or anomalies that may arise. One powerful tool set that enables you to monitor and alert on time series data is Grafana and InfluxDB Cloud Serverless. Grafana is a popular open source platform for data visualization, while InfluxDB Cloud is a time series platform built on the Apache ecosystem.
Combining these two platforms provides an efficient, scalable and customizable tool for real-time data monitoring and alerting. This blog post guides you through the process of using Grafana to create insightful alerts with the InfluxDB Cloud Serverless platform, providing you with a robust system that keeps you informed and ready to take action when your data exhibits unexpected behavior.
Requirements
The following tutorial assumes that you meet the following requirements:
- A Telegraf installed on your machine
- An InfluxDB Cloud Serverless account
- A local Grafana or Grafana Cloud instance
For this example, we’ll use Telegraf to write CPU metrics to InfluxDB Cloud. I chose this dataset solely to demonstrate how to alert with Grafana, but you can use any Telegraf plugin or dataset you desire. Configure your Telegraf agent by following this documentation. Alternatively, you can use the InfluxDB UI to configure Telegraf by following the instructions in this blog post. (Please note that while the post references InfluxDB 2.x, the UX for configuring Telegraf is the same in InfluxDB Cloud 3.0).
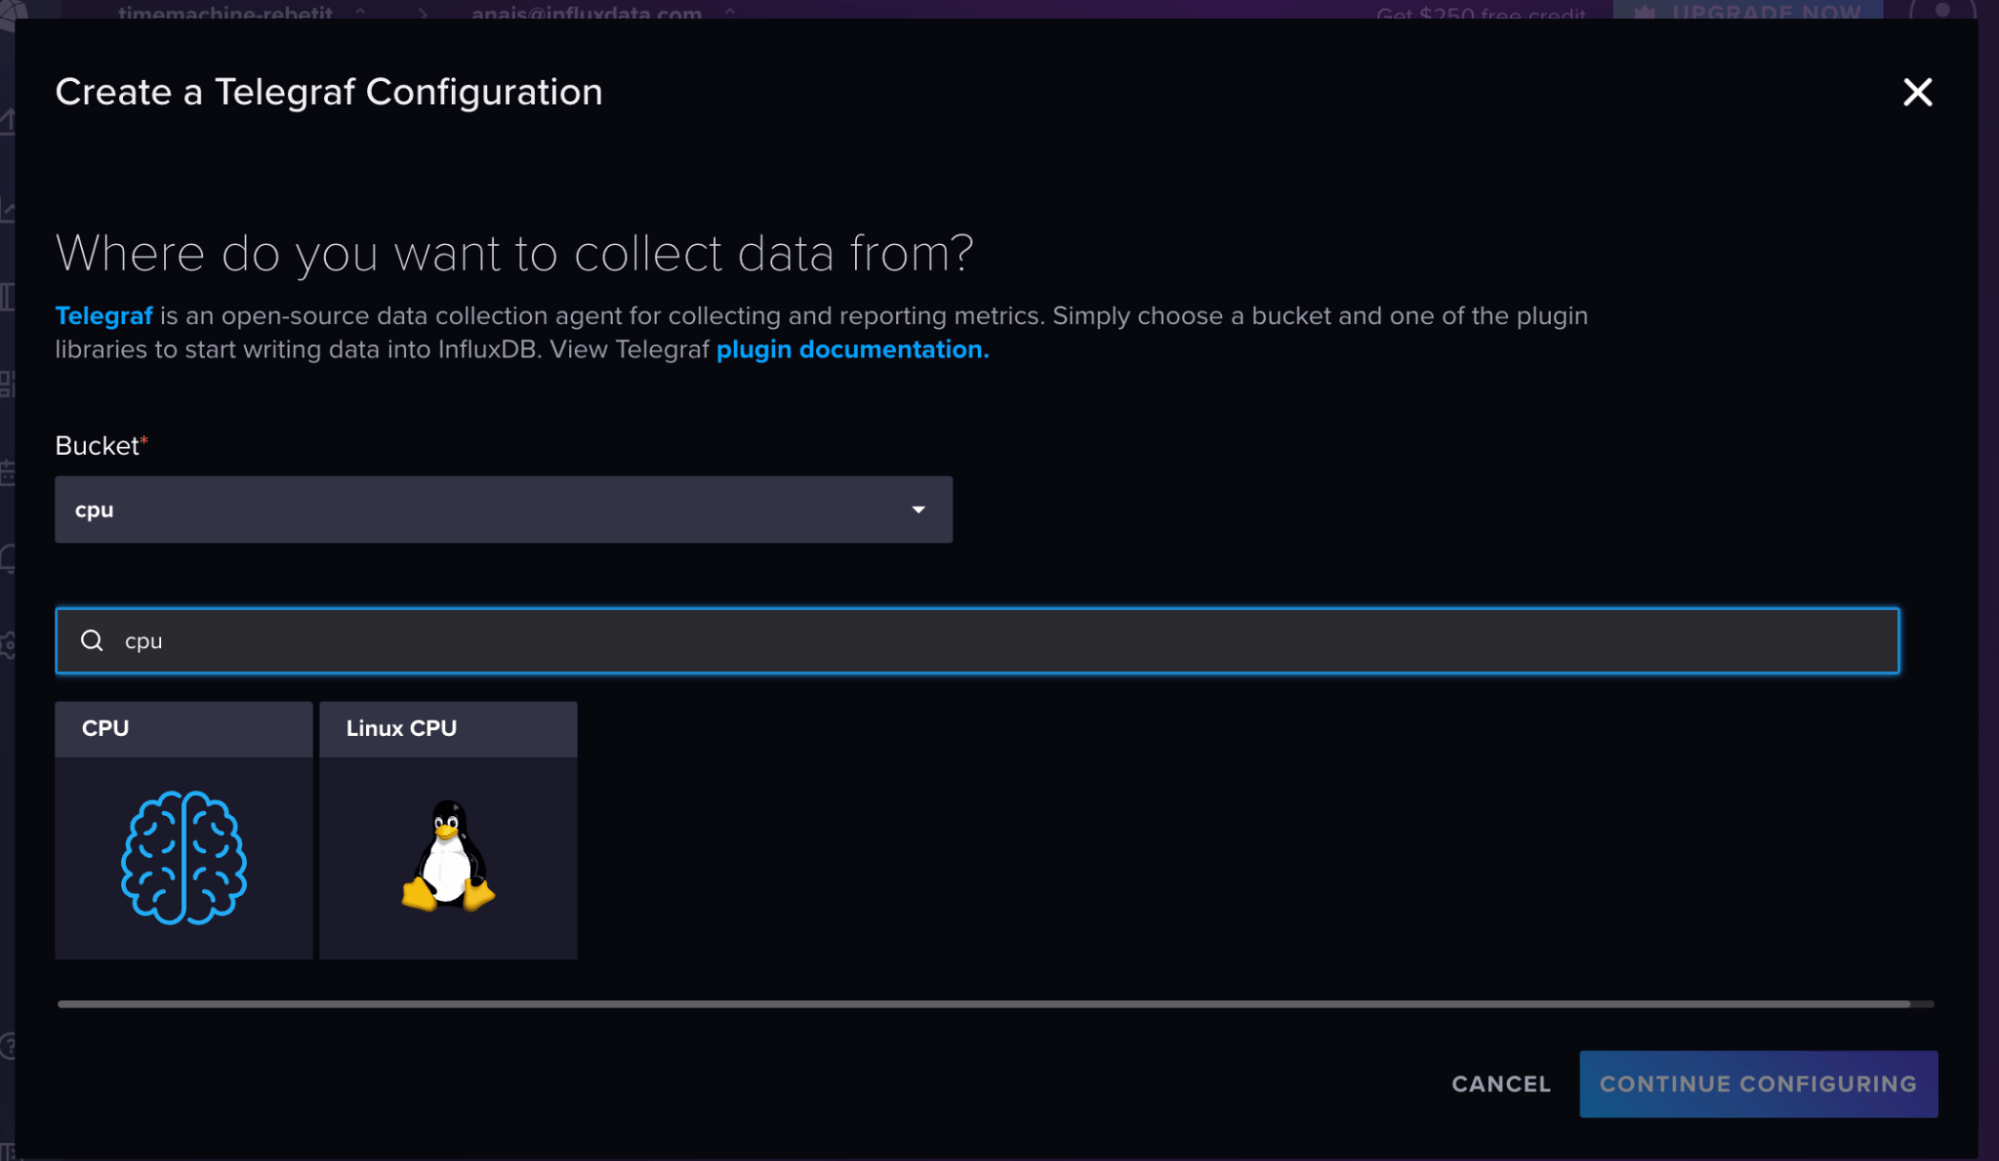
You can also follow these steps to configure the Telegraf agent from the UI:
- From the home page click on Add Data.
- Under Telegraf Reporting Agent, select Configure Agent.
- Click on + CREATE CONFIGURATION.
- Select a bucket to write data to (I already created a bucket called “cpu”).
- Search for and select the CPU plugin.
- Follow the pop-up instructions.
Next, I verified that I can successfully query data from InfluxDB Cloud 3.0 with the Data Explorer:
Use Grafana to query and visualize data
Before we can alert with Grafana, we must first query and visualize our data. Follow this documentation on how to:
- Get started with Grafana.
- Create and configure the Flight SQL data source.
- Query InfluxDB with Grafana.

For this tutorial I used the Grafana Cloud free trial. If you navigate to the Explore page, you can create a query within Grafana to verify that you have successfully configured the Flight SQL plugin. Make sure to select Flight SQL as your source.

Set up a Grafana alert
This post covers setting up the most basic alert with Grafana. However, Grafana has advanced alerting capabilities. To learn more about these advanced alerting features in Grafana, please see the following documentation. While the UI has changed some, I followed this tutorial to get started.
First, navigate to the Alerting page from Home > Alerts & IRM > Alerting. From there, go to Manage alert rules.
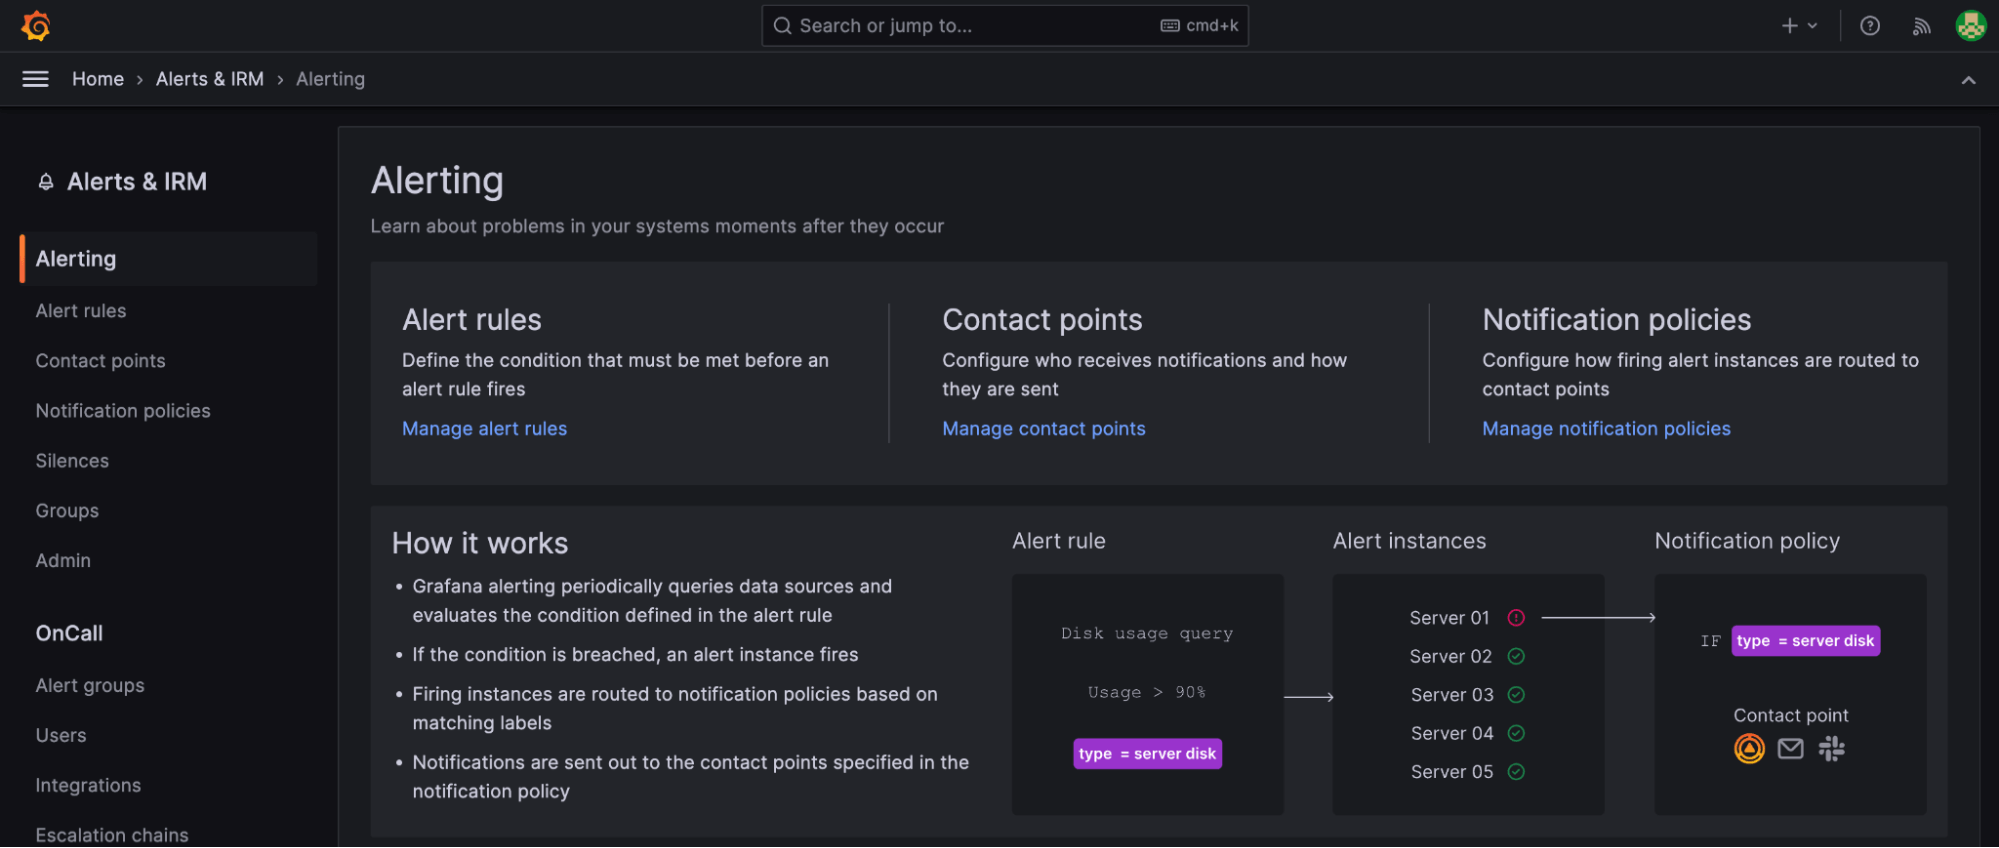
Add a new rule.

Query your data to select a condition for the alert.
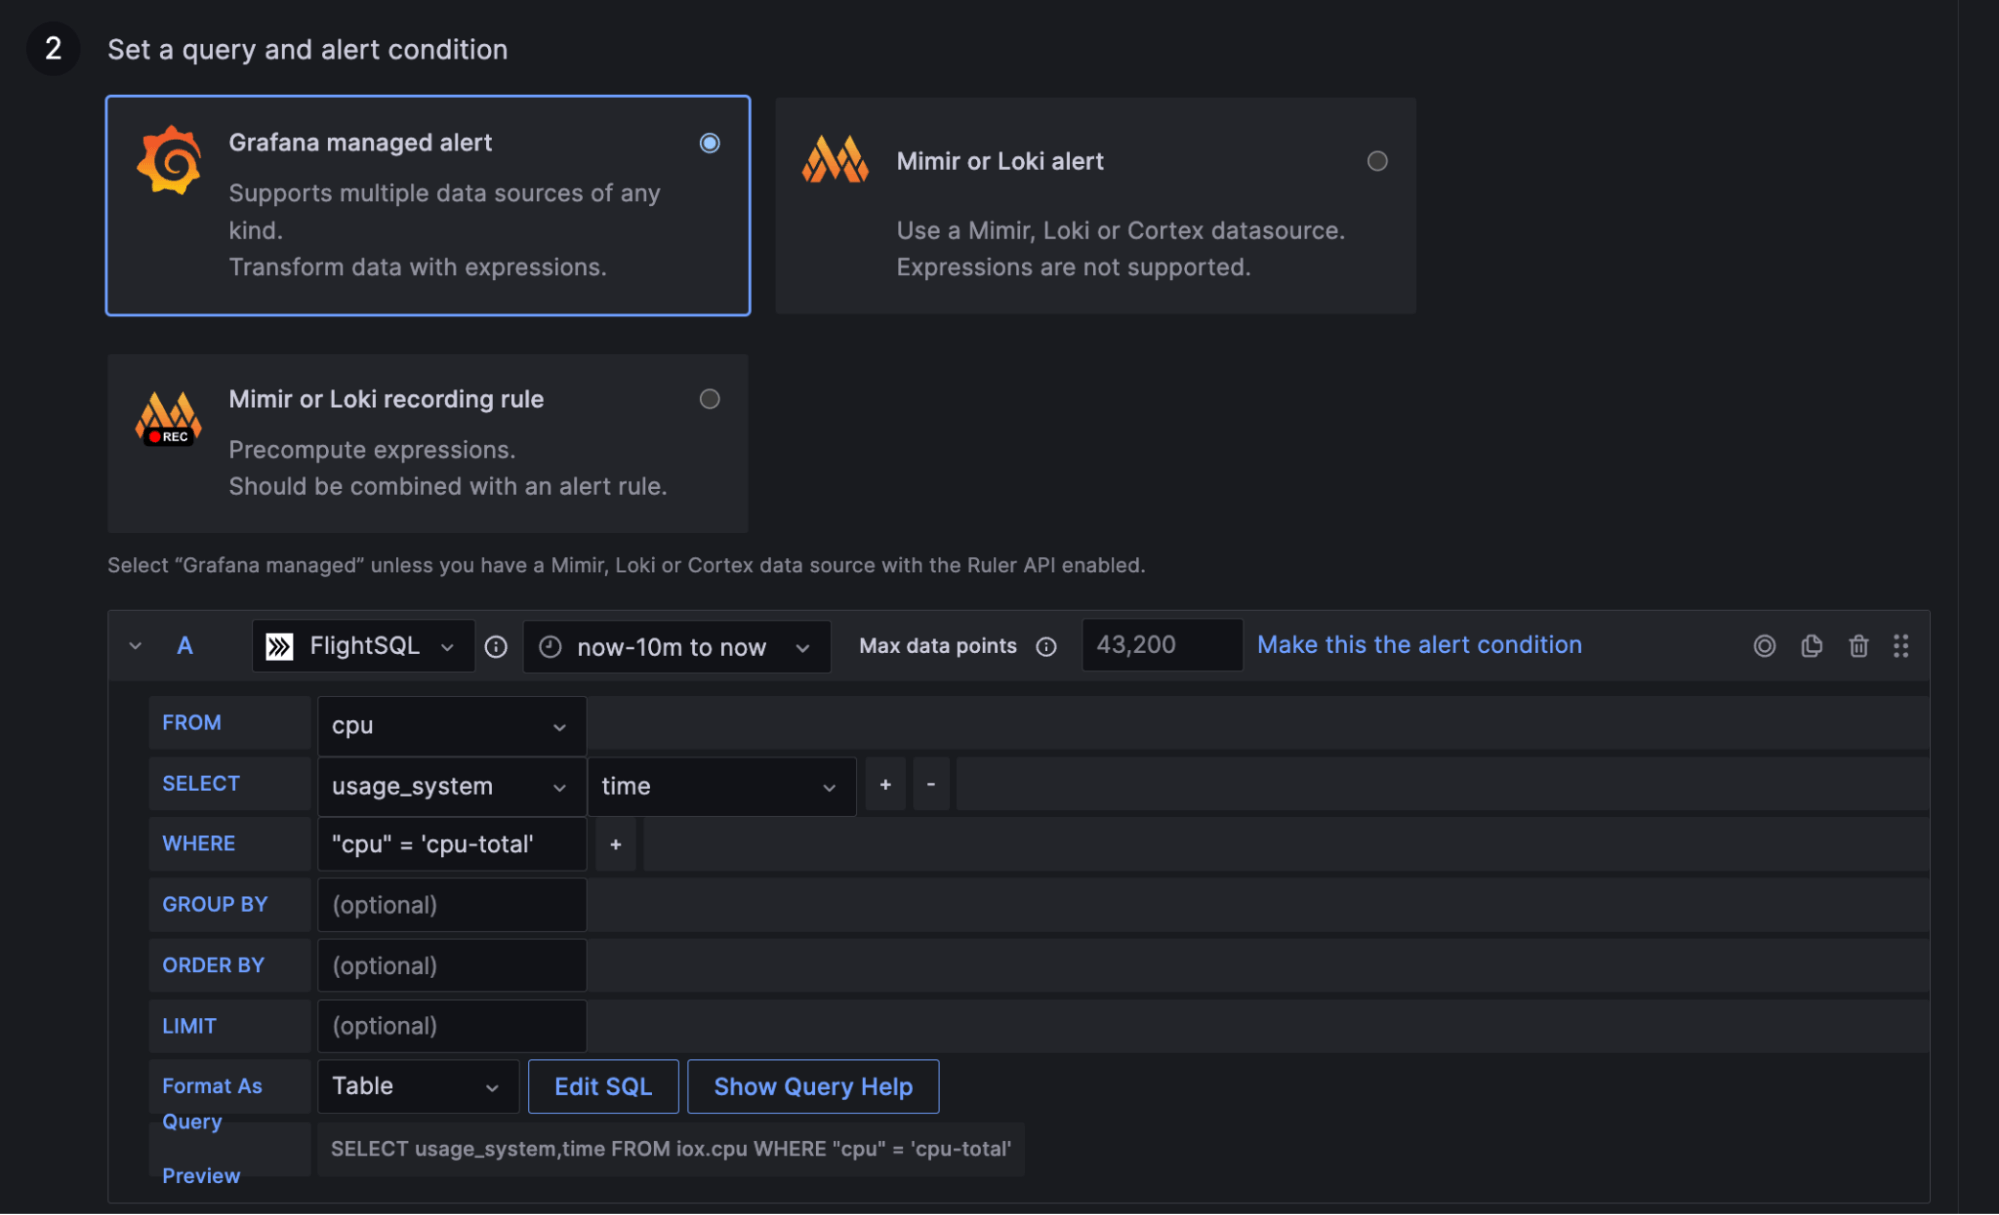
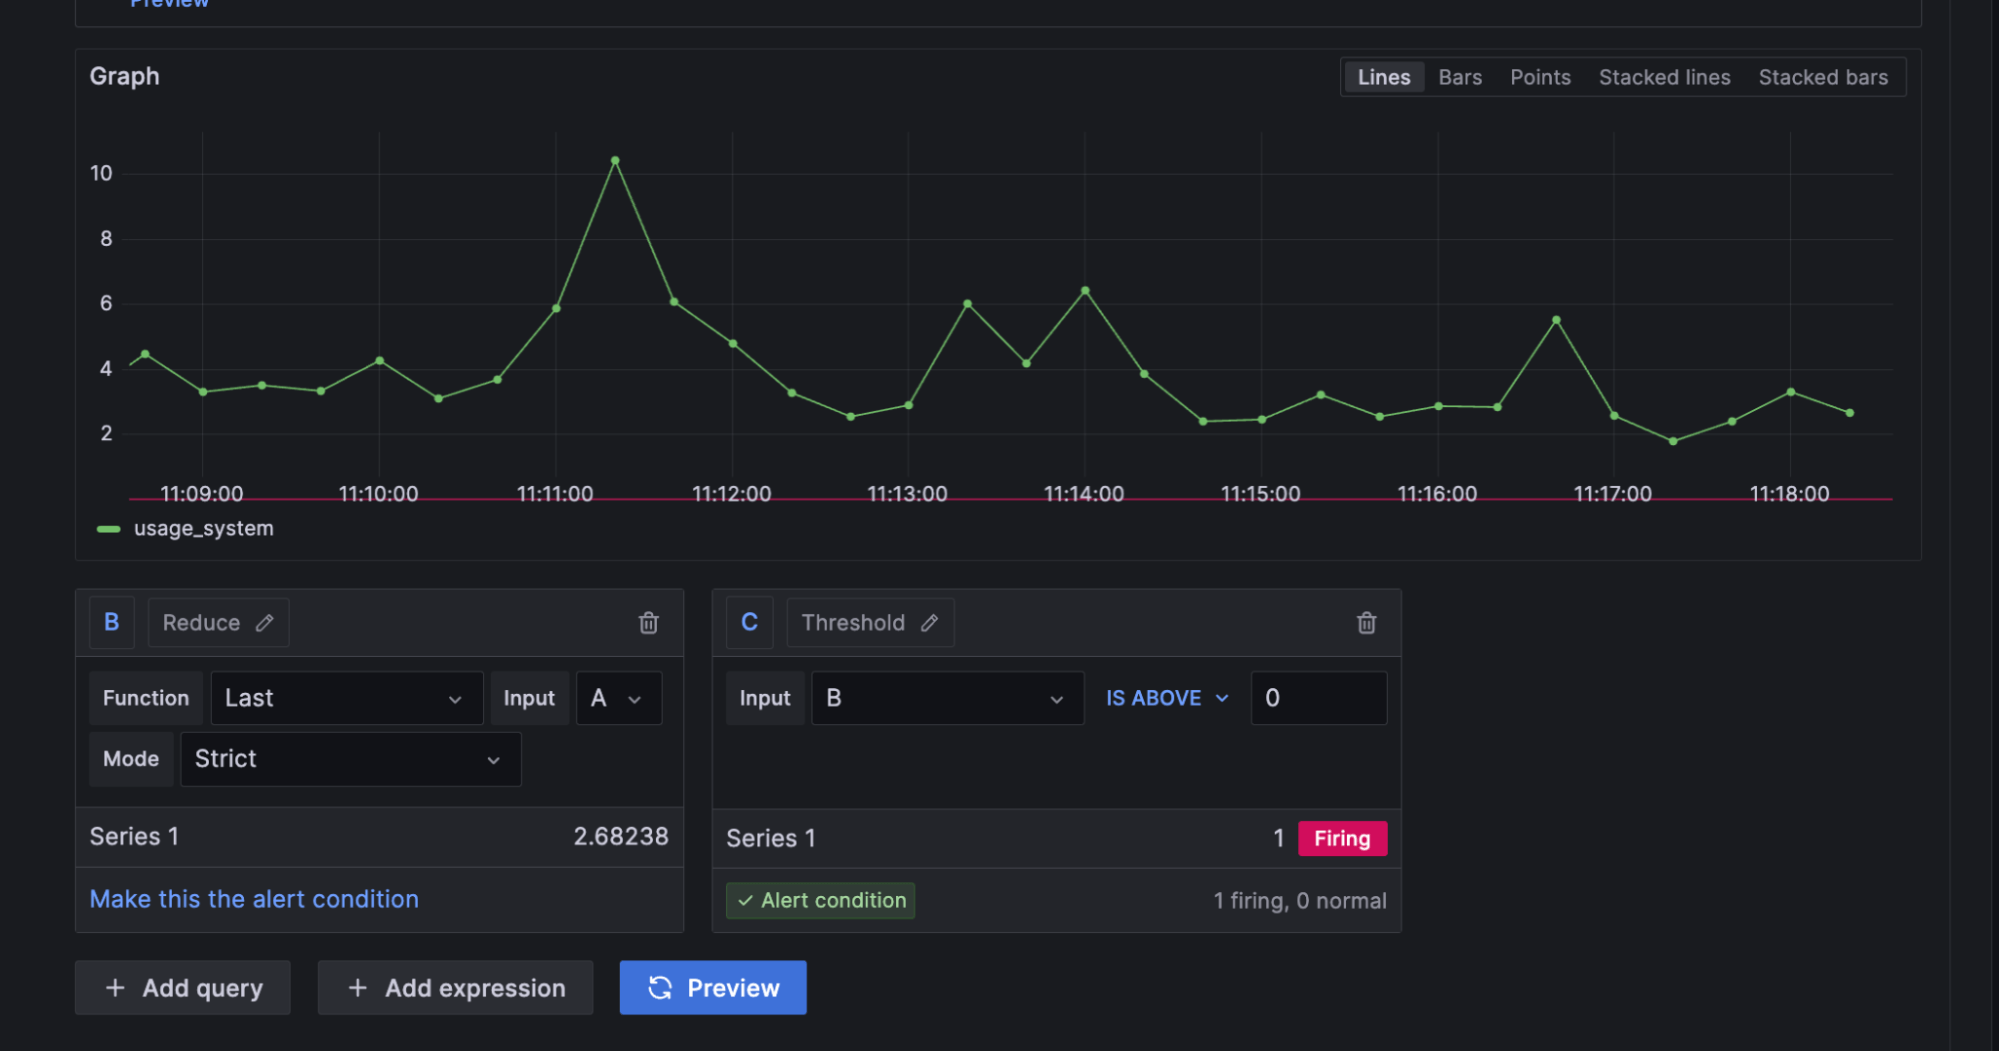
For this alert, I just selected usage_system data for total CPU. Verify that you are getting the correct data in the graph below the query builder. Then select the function that you wish to reduce your data to and any thresholds you want to create for your alert criteria. For this example, I selected the last value and made the threshold above 0 to test the alert.
Set the alert evaluation behavior, or how frequently you want your alert to run. Make sure to also assign your alert to an evaluation group.

To send an alert to contact points like email or Slack, navigate to the Contact Points page under Alerts & IRM. Click + Add contact point.

The easiest way to test your alert is likely through email. However, you can also join our InfluxDB Community Slack channel. There is a #notifications-testing channel with this webhook URL that you can use if you want to test a Slack notification.

Click Test to test your alert and verify that you’re getting a message in the InfluxDB Community Slack channel or your email.
Final thoughts
Grafana is a robust visualization and alerting tool. While this tutorial just scratches the surface of what’s possible with both Grafana and InfluxDB, it’s worth exploring them further to see how they can improve your workflows and business operations.
