Applying Machine Learning Models to InfluxDB with Loud ML & Docker for Time Series Predictions
By
Anais Dotis-Georgiou
updated December 14, 2025
Product
Use Cases
Developer
Navigate to:
I love learning about data science. I like to play with various machine learning models to try to understand when to use them, how they work, and how to evaluate them. However, diving head-first into machine learning is intimidating. I wanted to create this tutorial to show data science enthusiasts how quickly you can apply high-performance machine learning models to your time series data with Loud ML and InfluxDB.
The following topics will be covered in this tutorial:
- How to create and configure InfluxDB, Loud ML, and Chronograf Docker containers over a bridge network
- How to train your machine learning model with Loud ML on your InfluxDB database to predict values
- How to use Chronograf to view those predictions
- A preview into 1-Click Machine Learning
The repo for this project can be found here. For this project I have chosen to make an offline prediction on the average_usage_system field from the default telegraf database. Please keep in mind that I don’t keep InfluxDB running, so the data is very sparse. It is a poor choice for good machine learning (ML) predictions. However, I chose to use this data because it is easily accessible and will be easier for you to get started. While this tutorial only covers offline ML, please know that Loud ML offers online ML capabilities as well. If you are new to Docker, you might want to check out Tips for new Docker Users. In that post, I go over the mistakes I made as a new Docker user, and some tips for how to avoid them.
1. How to create and configure InfluxDB, Loud ML, and Chronograf Docker containers over a bridge network
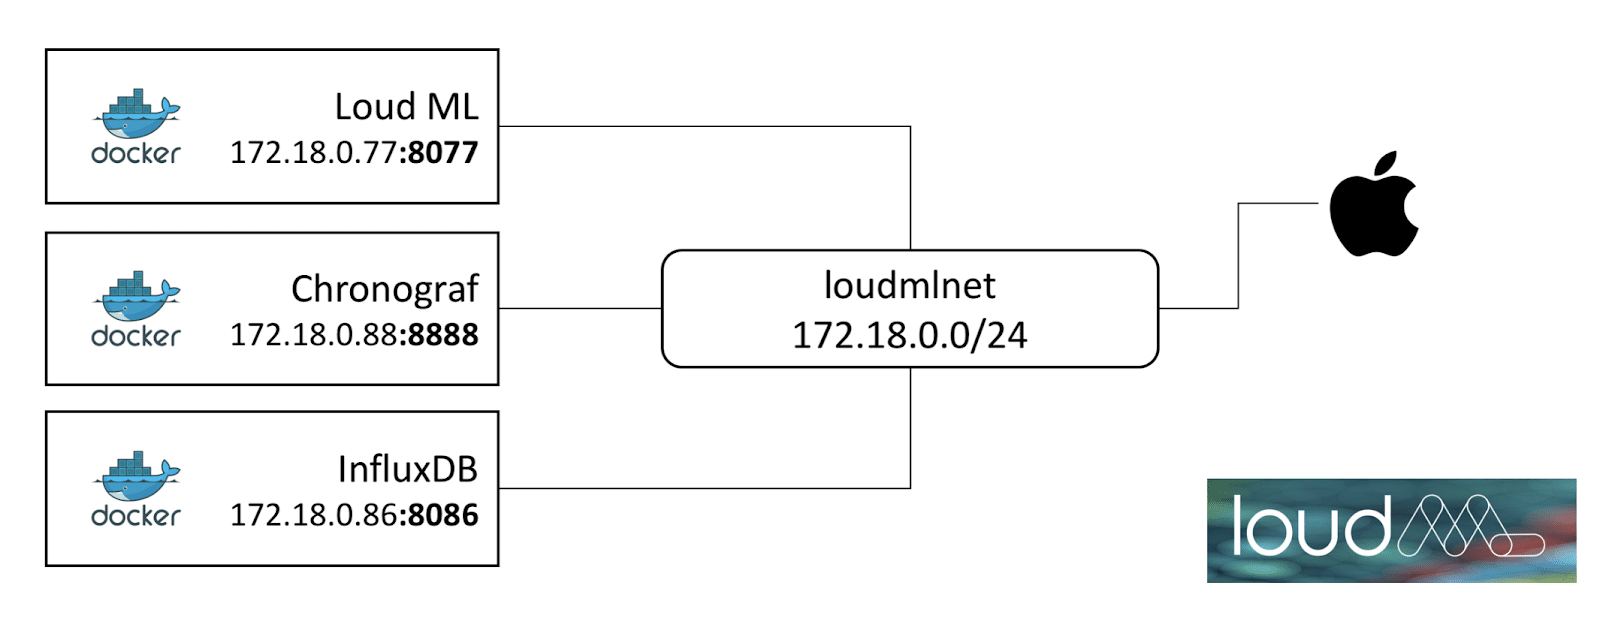
Pictures are worth a thousand words. Here is what we want our Docker network to look like. We will be subdividing 172.18.0.0 into three subnets (172.18.0.77, 172.18.0.88, 172.18.0.86) each with 24 bits according to IPv4 protocol. Each of those subnets are assigned to a port so that the address of the particular service on the particular system is defined.
- Create a network "loudml2" and specify subnetwork values directly using the
--subnetoption.
docker network create --subnet=172.18.0.0/24 loudml2- Find where InfluxDB stores data. For this tutorial, I am using the default telegraf database.
$INFLUXDB="/usr/local/var/influxdb"- Set up local storage to be shared with the containers and create config and model files (
$LOUDMLTEL="/Users/anaisdotis-georgiou/ContainerData/LoudML2").
mkdir $LOUDMLTEL/chronografcd $LOUDMLTELtouch config.ymltouch influxdb.conftouch model.json- Modify
config.yml:
datasources:
  - name: telegraf
    type: influxdb
    addr: 172.18.0.86:8086
    database: telegraf

storage:
  path: /var/lib/loudml

server:
listen: 0.0.0.0:8077- Modify
influxdb.conf. Make sure that the location of your data matches your$INFLUXDB:
[meta]
  # Where the metadata/raft database is stored
  dir = "/usr/local/var/influxdb/meta"

[data]
  # The directory where the TSM storage engine stores TSM files.
  dir = "/usr/local/var/influxdb/data"

  # The directory where the TSM storage engine stores WAL files.
wal-dir = "/usr/local/var/influxdb/wal"- Modify
model.json:
{
        "offset": "30s",
        "features": {
            "io": [
                {
                    "metric": "avg",
                    "field": "usage_system",
                    "name": "mean_usage_system",
                    "default": 0,
                    "measurement": "cpu",
                    "anomaly_type": "low_high"
                }
            ]
        },
        "bucket_interval": "5m",
        "min_threshold": 75,
        "max_threshold": 95,
        "name": "telegraf",
        "default_datasource": "telegraf",
        "interval": "1m",
        "max_evals": 5,
        "type": "timeseries",
        "span": 10,
        "forecast": 5,
        "seasonality": {
            "daytime": true,
            "weekday": true
        }
}
"anomaly_type":"low-high" specifies that values that are either too “low” or too “high” will be included in the anomaly detection.
"min_threshold": 75 & "max_threshold": 95 specify thresholds for anomaly detection. These values were picked randomly because my dataset is very sparse, and I don’t expect to be able to perform accurate anomaly detection.
"bucket_interval": "30m" Finding the right bucket aggregation interval is important. The data is averaged over the bucket interval. If the bucket interval value is too low will, training will take a very long time, and you run the risk of overfitting. Choosing a bucket interval that is too long could result in a model that is less sensitive and smooth out interesting anomalies. Typically the bucket span tends to be between 10 minutes and 1 hour or similar to the average duration between anomalies. The span (10*5m=50m) determines the number of bucket intervals that will be used to predict the next value.
"interval": "1m" specifies the interval at which to run live anomaly detection.
"forecast": 5 Best practice is to set forecast=½span.
"seasonality": {"daytime": true, "weekday": true} is specified because I tend to use my machine during the day on weekdays.
- Create the InfluxDB container and bind the appropriate directories and modified influxdb.conf.
docker run -p 8086:8086 --net loudml2 --ip 172.18.0.86 --name influxdb2 -v $INFLUXDB:/var/lib/influxdb -v $LOUDMLTEL/influxdb.conf:/etc/influxdb/influxdb.conf:ro influxdb -config /etc/influxdb/influxdb.conf- Create the Chronograf container and bind the appropriate directories and configuration files.
docker run -p 8888:8888 --net loudml2 --ip 172.18.0.77 --name chrono2 -v $LOUDMLTEL/chronograf:/var/lib/chronograf chronograf- Create the Loud ML container and bind the appropriate directories and configuration files.
docker run -ti -p 8077:8077 --net loudml2 --ip 172.18.0.88 --name loudml2 -v $LOUDMLTEL:/var/lib/loudml:rw -v $LOUDMLTEL/config.yml:/etc/loudml/config.yml:ro -v $LOUDMLTEL/model.json:/etc/loudml/model.json:ro loudml/community2. How to train your machine learning model with Loud ML on your InfluxDB database and predict values
- Start a bash shell inside of the
loudml2container:
docker exec -ti loudml2 bash to
- Navigate to the directory where our
model.jsonwas bound.
cd /etc/loudml

- Create the model
loudml create-model model.json

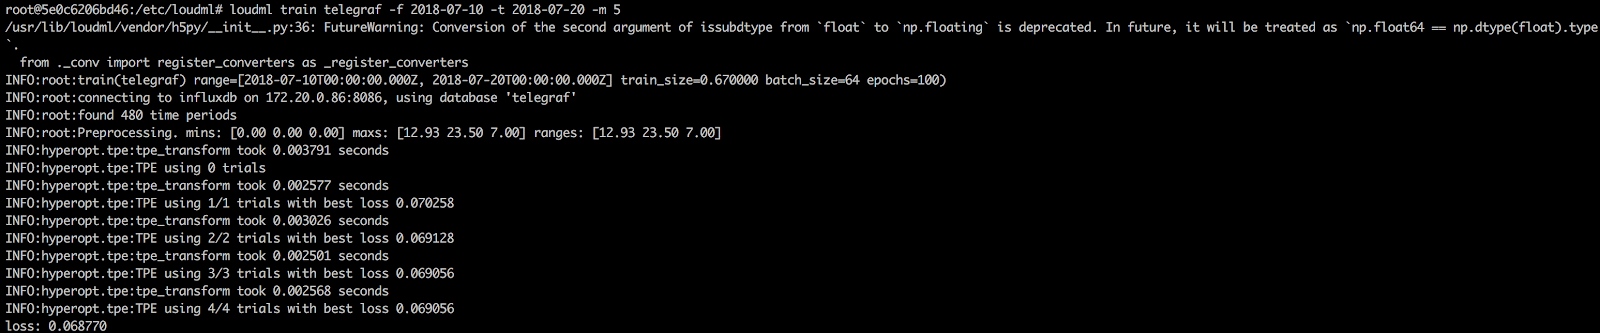
- Train the model
loudml train telegraf -f 2018-07-10 -t 2018-07-20 -m 5
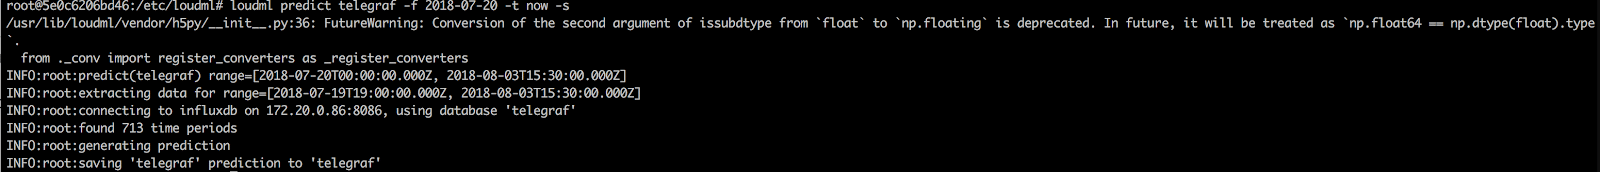
- Predict values. Use
-sto save the output inside InfluxDB so that you can use your favorite visualization tool.
loudml predict telegraf -f 2018-07-20 -t now -s
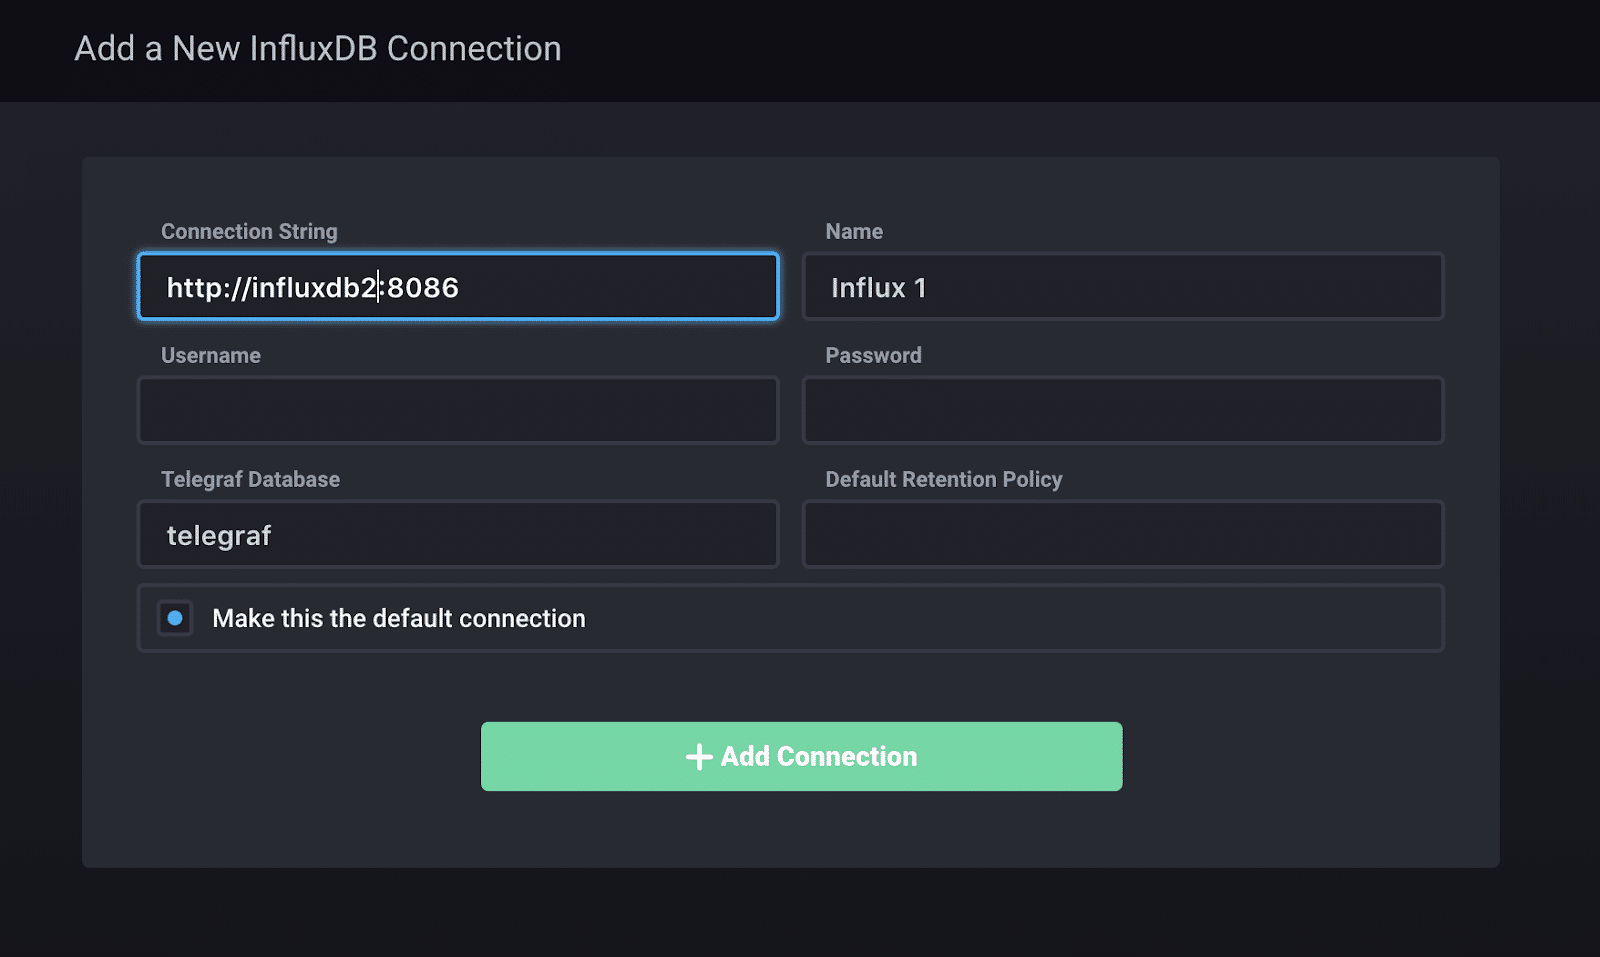
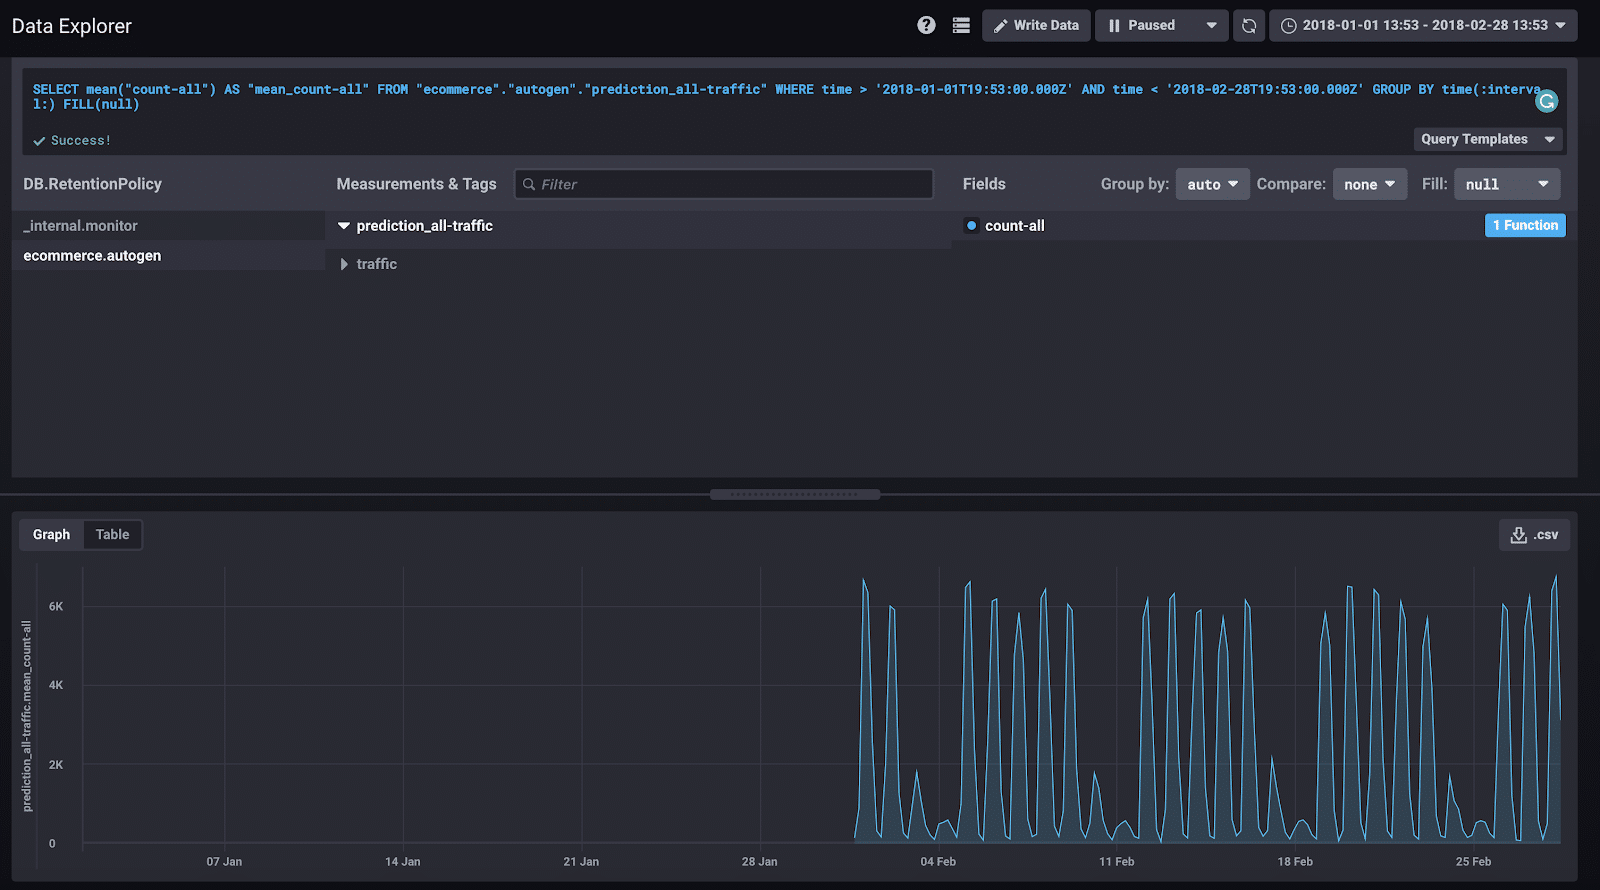
3. How to use Chronograf to view those predictions
- Visit http://localhost:8888/
- Connect the
influxdb2container like so:
- Check out your predictions.
4. A preview into 1-Click Machine Learning
One thing I love about InfluxData is our open source offerings. Our community has grown tremendously because the OSS versions of the TICK Stack are powerful and versatile. Telegraf has over 160 plugins, 153 of which were written by community members. Researchers at CERN used the OSS version to help them “determine the fundamental structure of the universe”. Loud ML is another exemplary community success story. Loud ML has forked InfluxData’s repo and added 1-Click Machine Learning to Chronograf to support the configuration and deployment of their machine learning models. Loud ML makes applying ML models to your time series data incredibly easy. By contrast, if I decided to use TensorFlow by itself, I would have to select a model, evaluate it, and tune it. That’s a lot of work and requires a deep understanding of ML for time series data. Fortunately, I don’t have to understand anything about ML to create high-performing models and evaluate them using Loud ML. With 1-Click Machine Learning, you can create and train a model with the click of a button. You simply query your data, apply a feature and aggregation interval, and click to predict.
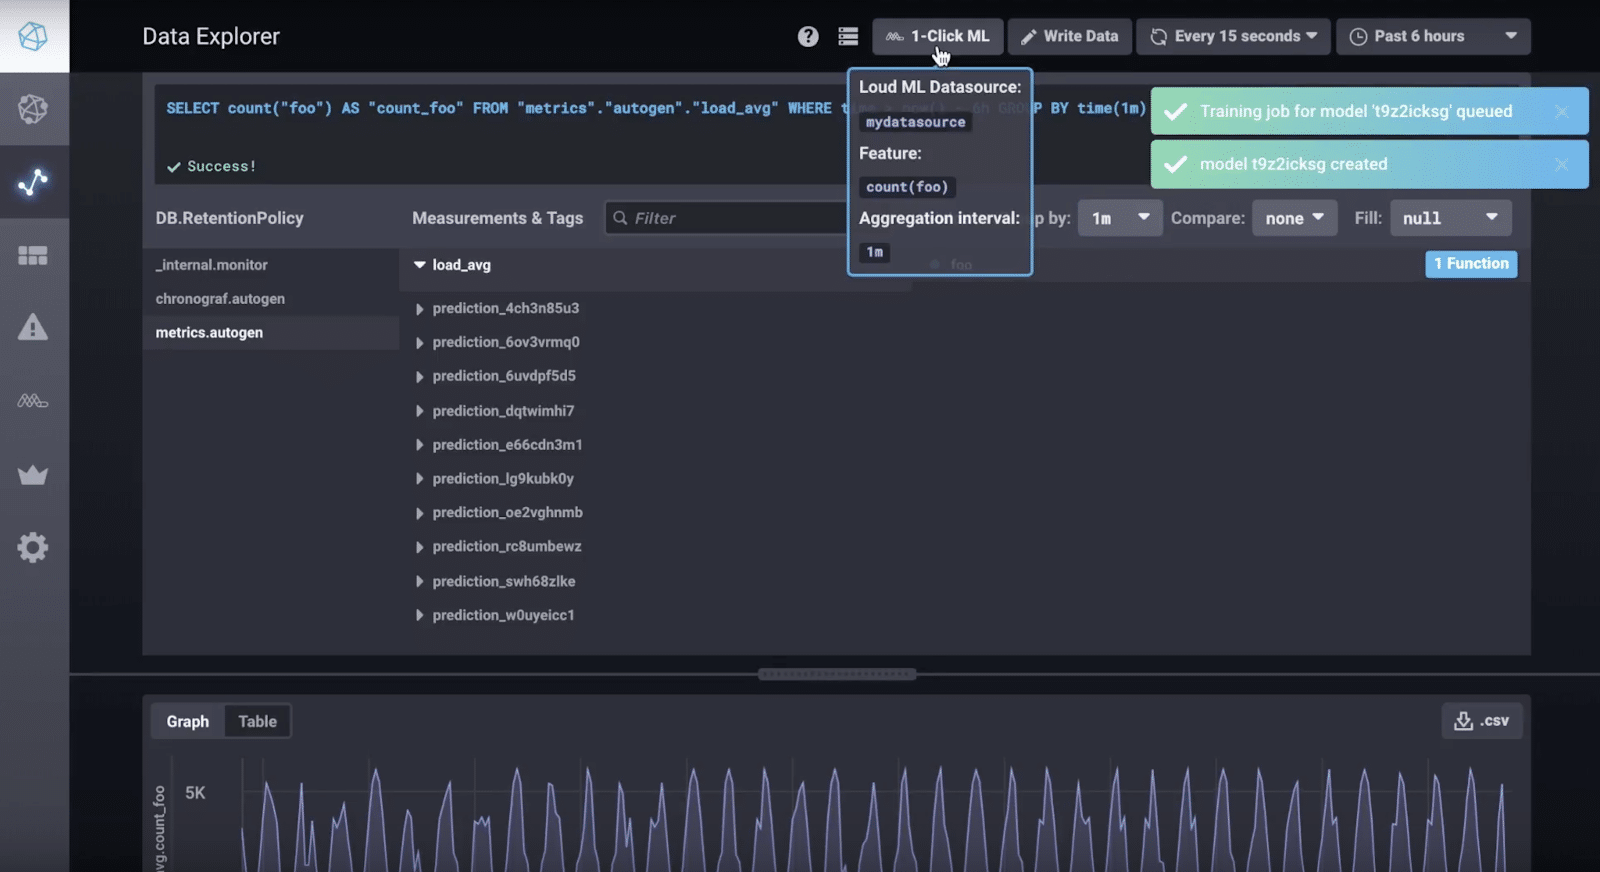 <figcaption> The standard Chronograf instance is replaced with the forked version from LoudML which includes 1-Click ML</figcaption>
Once the training is completed, you can select a Forecast time interval to output a prediction onto.
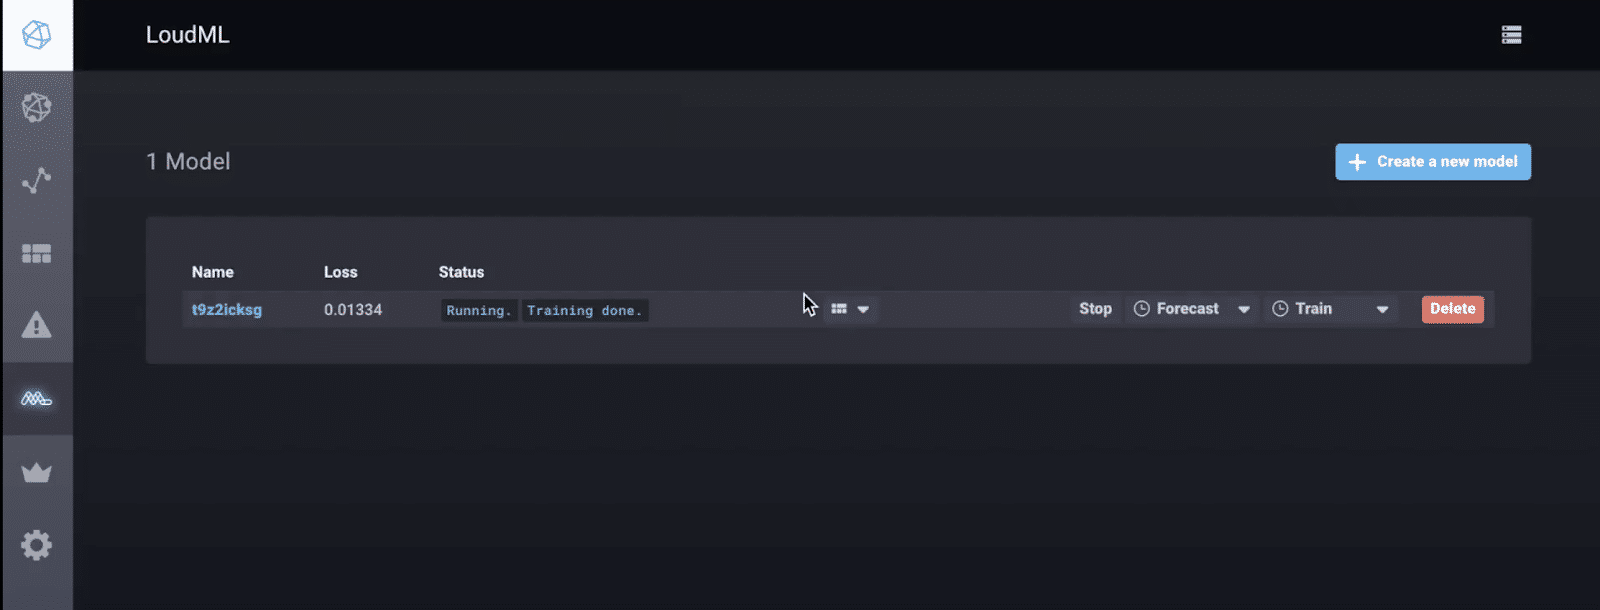 <figcaption> The forked version of Chronograf from LoudML which includes 1-Click ML</figcaption>
Take a look at this preview to get a taste for Loud ML’s 1-Click Machine Learning that will be available end of August.
I hope this tutorial helps get you started on your time series ML journey. If you have any questions, please post them on the community site or tweet us @InfluxDB. Special thanks and congratulations to Sébastien Léger and the whole Loud ML team.
