How to Build an IoT Gateway with InfluxData and Balena
By
David G. Simmons
updated December 14, 2025
Use Cases
Developer
Navigate to:
Note: Since this article has been written, resin.io has been renamed balena. Text occurrences of resin.io in the original article are now replaced by the updated name balena.io.
Motivation
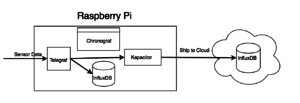
In many IoT installations users want to collect all the data for a site, or series of sensors, in a central location before shipping to the cloud. This piece of infrastructure is commonly called a Gateway. Gateways can perform a variety of functions but commonly collect, aggregate, store, analyze, and visualize data coming from the sensors. Gateways are also responsible for then forwarding all this data to the backend system, often the cloud. The InfluxData TICK Stack ably performs all of these functions, acting as a complete IoT Data platform. For this example we’re going to use a Raspberry Pi as they are relatively inexpensive and easily obtained, but there are a variety of available gateway devices on the market from Samsung ARTIK and others.
Architecture
Requirements
To follow this walkthrough you are going to need the following:
- A Raspberry Pi
- An InfluxDB Cloud instance
- Spin up an Uno with your free trial, or use an existing instance.
- A balena.io (formerly resin.io) Account
- The above getting started documentation is for a RaspberryPi 3
Follow the instructions above to connect your RaspberryPi. When the walkthrough has you deploying code, stop.
Fork the Repository
Fork this repository to your own Github account and then clone it to your local machine so you have a local copy. Then add the balena remote to enable pushing to your device:
$ git remote add resin <resin_user>@git.resin.io:<resin_user>/<application_name>.gitConfigure the Stack
This repository gives you the ability to easily configure the different members of the stack. The configuration files for each product live in the config directory. To change the configuration, just edit the influxdb.conf, telegraph.conf and capacitor.conf files.
telegraf.conf
This file controls the Telegraf configuration. Telegraf is a plugin-driven, agent-based, data collection tool. It contains plugins to collect data from many standard sources. In addition, telegraf has a number of utility plugins to help gather data from sources that aren’t implemented. It also provides an easy interface for building your own plugin.
The plugins that are enabled in this installation can be divided into the following groups:
- Managing sensor ingest:
- This will listen for any data posted to the Gateway by other sensors in the environment.
- Currently enabled:
http_listener
- Network monitoring:
- These plugins help you troubleshoot network issues.
- Currently enabled:
nstat,dns_query,ping
- Host level monitoring:
- These plugins give you data about the gateway host itself.
- Currently enabled:
cpu,mem,diskio,swap,system,disk,kernel,processes
- TICK Stack Monitoring:
- These plugins give you more data about the TICK Stack installation itself:
- Currently enabled:
influxdb,kapacitor,internal
kapacitor.conf
This file controls the Kapacitor configuration. Kapacitor is a stream processing tool for processing, monitoring, and alerting on time series data. The configuration you will need to change will be for your metrics shipping to a cloud instance.
To enable shipping change the configuration in the [[influxdb]]name="cloudInflux" section. You will need to provide connection credentials to a running InfluxDB server that is reachable from the device. Spinning up an Uno instance on InfluxDB Cloud is a great way to give this a try. Change the lines with ???? to the proper values for your instance:
[[influxdb]] enabled = true ???? default = false name = "cloudInflux" urls = ["https://{{cloud-instance}}.influxcloud.net:8086"] ???? username = "myUser" ???? password = "myPass" ???? timeout = 0 insecure-skip-verify = false startup-timeout = "5m" disable-subscriptions = true subscription-protocol = "http" subscriptions-sync-interval = "1m0s" kapacitor-hostname = "" http-port = 0 udp-bind = "" udp-buffer = 1000 udp-read-buffer = 0 [influxdb.subscriptions] [influxdb.excluded-subscriptions]
influxdb.conf
This file controls the InfluxDB configuration. InfluxDB is a scalable datastore for metrics, events, and real-time analytics. You shouldn’t need to change any of the configuration in this file. Enabling the [[graphite]], [[opentsdb]], or [[udp]] sections is not recommended. If you need to write these formats with this setup please use the socket_listener plugin on telegraf to write that data. This ensures that the metric shipping will operate as expected.
Push code and complete configuration
Once you have configured the repo just run git push resin master to deploy your code to your RaspberryPi. Check the logs for the instance through the balena dashboard. Once your installation spins up, Chronograf will be available at http://<device_ip>:8888 on your local network. Follow the instructions from #3 onward to setup your Chronograf instance.
One more step is required to enable metrics shipping to the cloud: defining and enabling the Kapacitor TICK script that accomplishes this. Use the balena.io dashboard to open a command line in your instance and run the following commands:
$ kapacitor define shipToCloud -dbrp telegraf.autogen -tick /usr/src/app/toCloud.tick -type stream $ kapacitor enable shipToCloudAfter this you will be able to see your Telegraf data in your InfluxDB Cloud instance!
$ influx -host {{cloud-instance}}.influxcloud.net -port 8086 -username {{username}} -password {{password}} -ssl -database telegraf Connecting InfluxCLI to {{cloud-instance}}.influxcloud.net:8086 ... Connected to https://{{cloud-instance}}.influxcloud.net:8086 version 1.2.4-c1.2.4 InfluxDB shell version: v1.2.4 > use telegraf > show measurements name: measurements name ---- cpu disk diskio dns_query influxdb ...You’ve now successfully built an Influx Data IoT Gateway device to collect, manage and store your local IoT Sensor data stream and then forward that data on to your upstream cloud instance of InfluxDB for further aggregation and processing.
Why install on a gateway?
Why would you install the TICK stack on the gateway, and then forward all that data on to your cloud instance? Why not just send it all to the cloud in the first place and be done with it? Both are good, and valid, question which I will try to answer.
The first answer is that it’s an architectural choice. Some designers may choose not to use a gateway device at all. Some may, but not provide any sort of data storage/analytics on their gateway. It’s a perfectly valid design choice, but it has the potential to make local data analysis mode difficult in a highly distributed system.
This leads directly to my second answer which is that it enables localized data analysis. Let’s imagine that you have a highly distributed IoT deployment with thousands of sensors deployed in hundreds of locations. It’s certainly possible and with Influx Data fairly easy to do your analysis and visualization on your backend cloud-based system. But for a local plant manager that doesn’t care at all about any of the other sites, having local analytics is extremely powerful. The overhead and cost for providing such a powerful tool at the local level is fairly low, and the benefits would seem to our weight those costs.
Build your own
If you’ve seen our Built with InfluxData page, you know what’s coming next. Go build something! Use what you’ve learned here to build your own IoT system based on InfluxDB, let us know what you’ve built, and we’ll send you some cool swag!
