Building Custom Interfaces For InfluxDB
By
Todd Persen
updated December 14, 2025
Company
Navigate to:
In addition to shipping with a basic admin interface, InfluxDB also allows you to create custom interfaces with a little bit of HTML and JavaScript and drop them into the admin interface as plugins. This makes it easy to build custom dashboards or reporting interfaces that you can share with others. In this post, we’ll walk through the basic concepts of building a plugin and put together a quick visualization example.
Getting Started
You’ll need to be running version 0.3.2 or greater of InfluxDB for this to work (brew update && brew upgrade influxdb). First, it helps to know how the admin interface is structured so that you get a better sense of the world in which your custom interface will live. The admin interface is built as a single-page application written in AngularJS. Custom interfaces are loaded within an iframe, so that they are effectively isolated from the rest of the admin interface. This means that you will need to load your own JavaScript and CSS assets, but also means that you’re free to build the application as you wish. The only requirement is that you build it as a single-page application, so that it doesn’t navigate the browser away from the container.
Since the admin interface is responsible for authentication, it exposes an InfluxDB connection that can be accessed from within the iframe so that you aren’t required to re-authenticate your custom interface when it loads. You can access this as window.parent.window.influxdb or just parent.influxdb, and the interface will conform to that of the InfluxDB JavaScript Library.
How InfluxDB Organizes Custom Interfaces
When you look at the InfluxDB configuration file, you’ll see a variable called AdminAssetsDir. This is the path that admin interface assets are served from. The index.html that ships with InfluxDB is the starting point for the admin interface. There is also a subfolder called interfaces which is where the custom interfaces live. By default, InfluxDB comes with an interface called default, but you can make your own by creating a subfolder with an appropriate name. These names should be lowercase and underscored, as they will be converted into human readable names automatically. Let’s call this oneexample.
Starting With Some HTML
This example interface is going to pull in some data from an InfluxDB instance and graph it for us, just like we might want on a dashboard. Let’s start by setting up an quick framework, which will be a basic HTML page with jQuery, D3, Rickshaw, and Bootstrap. Notice that we don’t need to include the InfluxDB library because it’s already loaded in the parent container, which we’ll leverage. We’ll also add a div with an id of chart, so that we can insert a graph into it.
<html>
  <head>
    <title>InfluxDB Custom Interface Example</title>
    <script src="http://code.jquery.com/jquery-2.0.3.min.js" type="text/javascript"></script>
    <script src="http://d3js.org/d3.v3.min.js" type="text/javascript"></script>
    <script src="http://influxdb.org/javascripts/vendor/rickshaw.js" type="text/javascript"></script>
    <script src="/javascripts/interfaces/example.js" type="text/javascript"></script>

    <link href="http://influxdb.org/stylesheets/vendor/rickshaw.css" media="screen" rel="stylesheet" type="text/css">
    <link href="//netdna.bootstrapcdn.com/bootstrap/3.0.2/css/bootstrap.min.css" media="screen" rel="stylesheet" type="text/css">
  </head>
  <body>
    <div class="container">
      <div class="row">
        <div class="col-md-12">
          <h1>Important Dashboard</h1>
          <div id="chart_container">
            <div id="y_axis"></div>
            <div id="x_axis"></div>
            <div id="chart"></div>
          </div>
        </div>
      </div>
    </div>
  </body>
</html>
Save this as index.html inside the subfolder called example, which should leave us with a structure like this:
admin/
  index.html
  interfaces/
    default/
      index.html
    example/
      index.html
Connecting With Some JavaScript
Next, we need to fetch data from the server and graph it on the page. To do this, we just need to use the InfluxDB object from the parent window (remember, this is available as parent.influxdb) and then hand the data off to Rickshaw and D3 for graphing. For this example, we’ll assume that there is a table called posts from which we can query data grouped by day.
$(function() {
  $("input").click(function() {
    parent.influxdb.query("SELECT COUNT(message) FROM posts WHERE time > now() - 365d GROUP BY time(24h);", function(points) {
      var data = points.map(function(point) {
        return { x: point.time / 1000, y: point.count };
      }).reverse();

      var graph = new Rickshaw.Graph({
        element: document.querySelector("#chart"),
        width: 1100,
        height: 200,
        renderer: 'line',
        series: [{ data: data, color: 'steelblue' }]
      });

      var xAxis = new Rickshaw.Graph.Axis.Time({ graph: graph });
      var yAxis = new Rickshaw.Graph.Axis.Y({
        graph: graph,
        orientation: 'left',
        element: document.getElementById('y_axis')
      });

      xAxis.render();
      yAxis.render();
      graph.render();
    });
  });
});
Finish It Off With A Little Style
To make the graph look nice, we can add a little bit of CSS to enhance the layout of the axes and labels. This is pretty standard, but should give you an idea how to get started on your own styling.
#chart_container {
position: relative;
font-family: Arial, Helvetica, sans-serif;
margin-top: 20px;
}
#chart {
position: absolute;
left: 30px;
}
#y_axis {
position: absolute;
top: 0;
bottom: 0;
width: 30px;
}
#y_axis > svg {
padding-bottom: 20px;
}
.x_tick {
bottom: -15px !important;
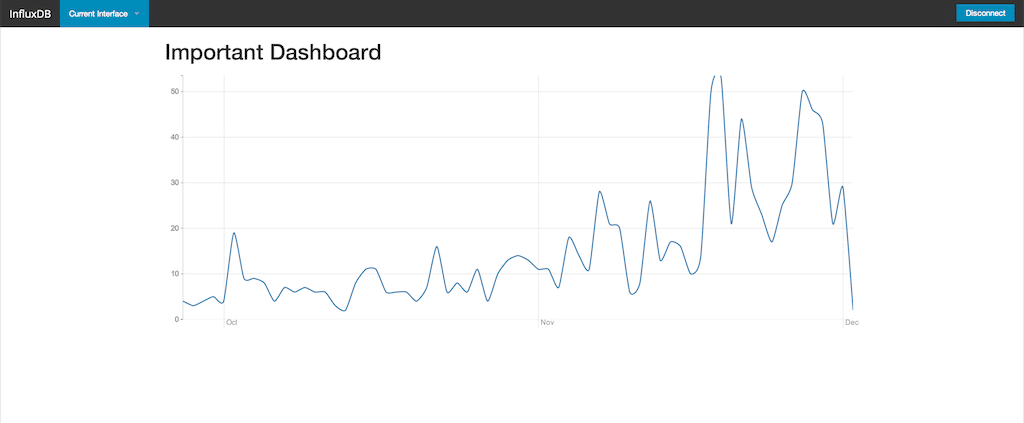
}Seeing It All Come Together
If we put all of the pieces in the right place, we should see our interface appear under the Interfaces tab when logging in as a database user. Though it’s an extremely simple case, the resulting output should look something like this:
Alternatively, you could fork the admin interface repo, which is built with middleman, and use the asset pipeline to separate your components more cleanly. You can use the default interface as an example.
If you end up building an interface that you want to share, send us a pull request!
