Chronograf 1.6 Released: Introducing Log Viewer and Additional Sharing Capabilities
By
Russ Savage
updated December 14, 2025
Product
Navigate to:
Chronograf is continually evolving as our customers discover new ways to derive value from the InfluxData Platform. In this release, we focused on two overarching themes: viewing log data and sharing context. Head over to the downloads page to grab the latest release.
Viewing Logs Stored in InfluxDB
If you haven’t had a chance to read our previous post on storing log data in InfluxDB, you should take a look! We introduced the first iteration of the Chronograf Log Viewer at InfluxDays London and have been working on improvements since. We believe in a “metrics first” approach to monitoring, and our goal with the Log Viewer is to provide a simple and intuitive way to use metrics to unlock the value of your logs.
Once you have log data flowing into InfluxDB using the Telegraf Syslog Input Plugin, you can immediately start to visualize and explore your data in Chronograf. Many users are already using the tabular display we introduced in 1.5 for displaying log data in their dashboards, but we wanted to go a step further and provide a dedicated Log Viewer within Chronograf.
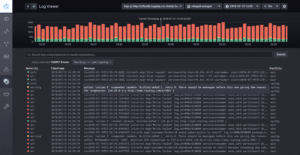
The Log Viewer provides additional custom features specifically tailored for logs.
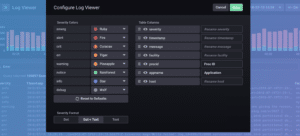
The logs histogram across the top is broken out by log level to indicate when events of interest may have occurred. Clicking one of the histogram bars narrows the display of the logs to the window of time represented by that bar. The colors used in the histogram are also customizable.
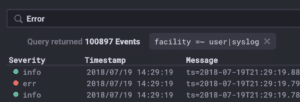
Once you’ve focused in on a time range, you can further filter the log information on display by clicking any of the column values in the table. Finally, you can use regular expressions in the search bar to filter the log messages even further. Let us know what you think about the overall experience on the InfluxData Community site!
Building and Sharing Context
The next big focus for this release is sharing. As you use Chronograf, you are inherently building context about your system and the telemetry data being collected. You are building context around the timeframe when something may have happened, or building context around a host, region, or service that is causing or experiencing an issue. We want to build tools and features that allow you to quickly share that context with other members of your organization.
Sharing your Hard Work
The first step in sharing context is sharing the dashboards you are looking at. Creating a powerful dashboard takes time and it is the codification of all the context you have about a specific system or application. Once you have your dashboard built and showing the important metrics, others are going to want to use it. In our 1.4 release we worked towards our goal by introducing Organizations and shared dashboards. In this release, we’ve added the ability to export and share a file containing a dashboard specification as well as the ability to import it into another instance of Chronograf.
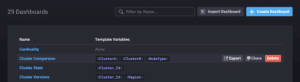
The ability to export dashboards allows you to quickly share them with others or backup versions in source control. You could even create a repository of pre-configured dashboards for your system or application to help new users get started quickly.
Sharing Your View of the World
Sharing your dashboard is only the beginning. When you open your Chronograf dashboards in the latest release, you may notice that template variable values are now displayed and kept in sync in the address bar of your browser. This means that you can quickly send those URLs to another user allowing them to see exactly what you see.
This also means you can programmatically build links into your dashboards from other places, including Kapacitor alerts. Now when your TICKscript fires an alert, you can add a link to a triage dashboard and directly jump to the timeframe of the incident along with providing other valuable context and ensuring that the person viewing the dashboard sees precisely what you need them to see.
Your Dashboards are More Flexible than Ever
When dashboards are shared among more people, they tend to stick around longer, but having too many dashboards can be overwhelming. When multiple users share the same dashboard, each one of them might want to see something slightly different in the same view, and they shouldn’t have to clone or import a copy of the dashboard to see it.
The new template variable types we’re introducing in this release make your dashboards more dynamic than ever.
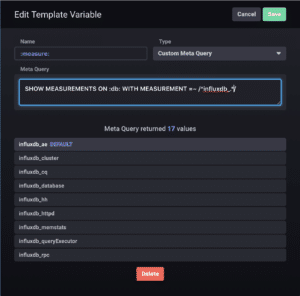
The Custom Meta Query type allows you to use any valid InfluxDB Meta Query to populate values for a template and leverage some of the more advanced meta query features.
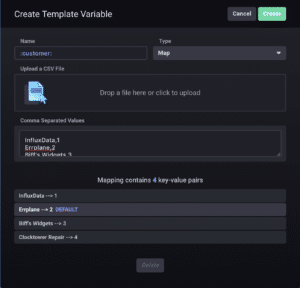
The Map type template variable allows you to build out a list of Key Value pairs for your variables which is useful when using identifiers in queries. The Key will display in the UI, while the value will be substituted into the query. So you can upload a mapping of customer names to customer identifiers in the system, and make your dashboard more user-friendly.
Active Incident Investigation
Dashboards can serve different purposes. Sometimes, they are displayed in the office so that trends can be identified and KPIs tracked at a glance. Other times, dashboards are actively being used for incident investigation.
The last template variable type we added is a free text input, which can allow you to actively manipulate the queries in your dashboards without having to manually edit the query.
One great use case is to combine it with a Table Graph to actively filter the results of the table when looking for something. You can dynamically add additional where clauses to queries or provide dynamic regular expressions for filtering.
We Want Your Feedback
Chronograf is the user interface for the TICK Stack, and we want to build features and improvements that make our users’ lives easier. That means we need to hear from you, our users, to make that happen.
This release contains the first iteration of our Log Viewer and these additional sharing features. We have so many ideas on how to improve them going forward, and we’d love to hear what your ideas are as well. Please engage with us through the community or open issues directly on Github and let us know what you’d like to see as we continue to evolve.
Chronograf has come a long way since some of our early releases. I encourage you to take a new look and tell us what you think.
Happy sharing!
