Table of Contents
Timbergrove is an American-based creative technology studio and consulting firm. For over a decade, Timbergrove has been using hardware and software to solve business problems.
Timbergrove has a unique culture compared to other workplaces. They use their status as an IBM Preferred Business Partner to draw on enterprise-grade resources while remaining lean and agile. Timbergrove balances the fun, scrappy startup vibe with solid processes and methodologies that their enterprise clients can trust.
They specialize in data integration, IoT, and custom software development. Timbergrove also works on IBM Maximo and Websphere projects. Their clients include Fortune 500s, startup companies and solopreneurs alike.
How Timbergrove gives building managers an easy introduction to IoT with InfluxDB
Recently, as part of Timbergrove’s broader Moonshot IoT offering, they created a smart workplace kit to help building managers get started with IoT. The goal is to deliver immediate value to end users, and to balance easy onboarding with extensibility.
"We don't want to give our users a locked-down solution that ties them to a single sensor provider, nor do we want to give them a 'box of parts' that requires an arm and a leg worth of labor". - Aspen Hollyer, software developer, Timbergrove
The smart workplace kit started as a simple prototype to meet the needs of their own office building. This blog post highlights how Timbergrove used InfluxDB to monitor the temperature, humidity, and occupancy of their office. As a sneak peak, here’s a sample Grafana dashboard for their building managers:
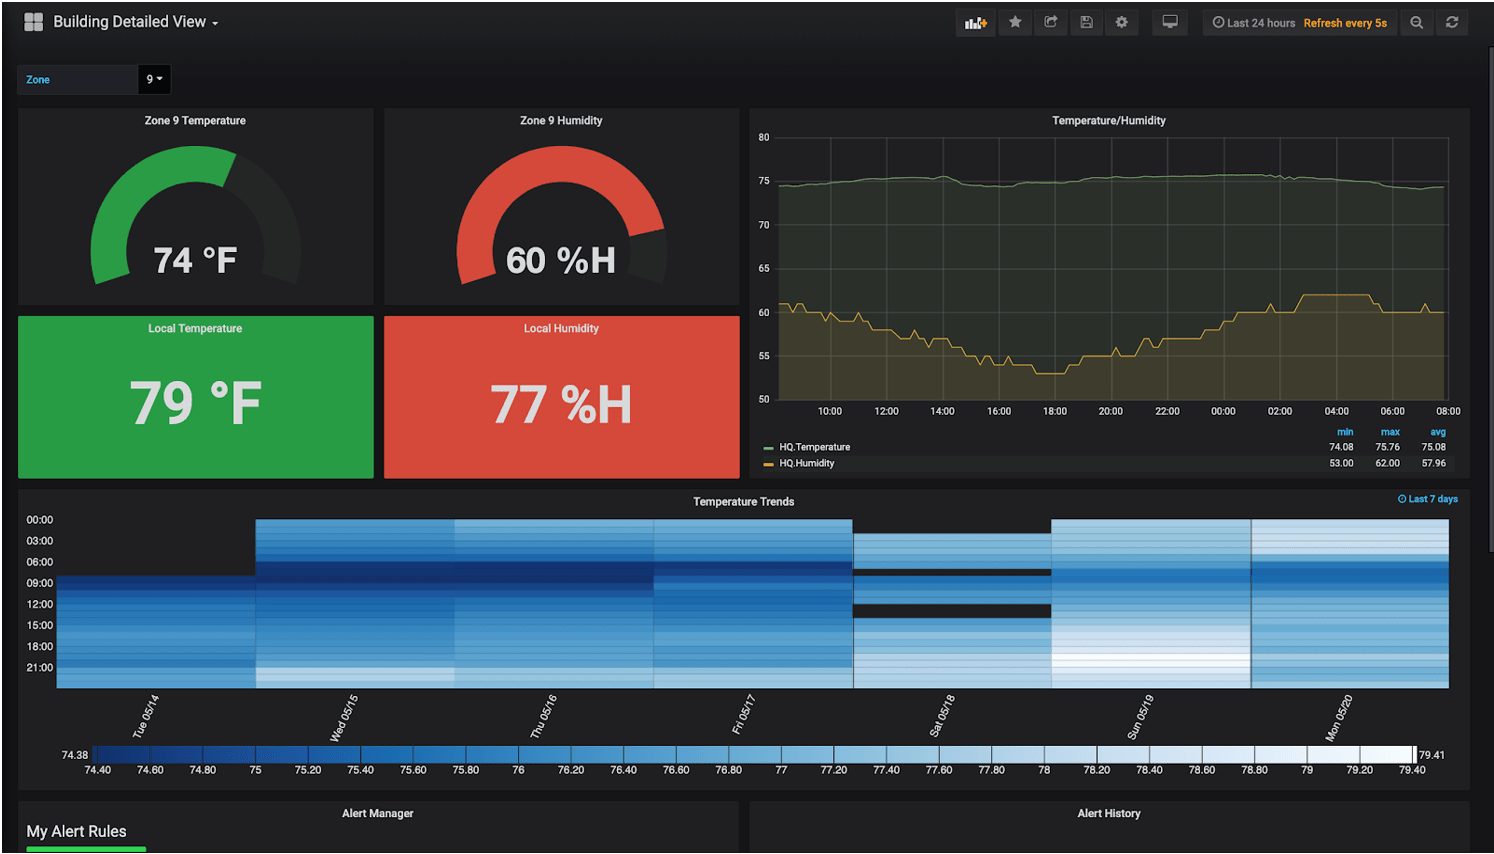
This dashboard features gauge plots, line plots, and heatmap panels to easily monitor their office environment.
IoT devices
At Timbergrove, developers are constantly experimenting with wireless sensor nodes and gateways, so they had quite a few devices on-hand. For this office monitoring solution, they ended up going with Digi SmartSense devices for humidity and temperature monitoring.
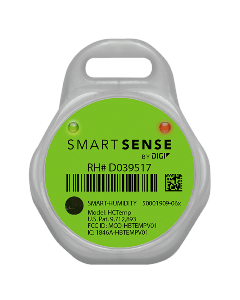
These devices have a long battery life and are easy to mount almost anywhere. With a couple of well-placed repeaters, they are able to cover their ~35,000 square foot space with a single gateway.
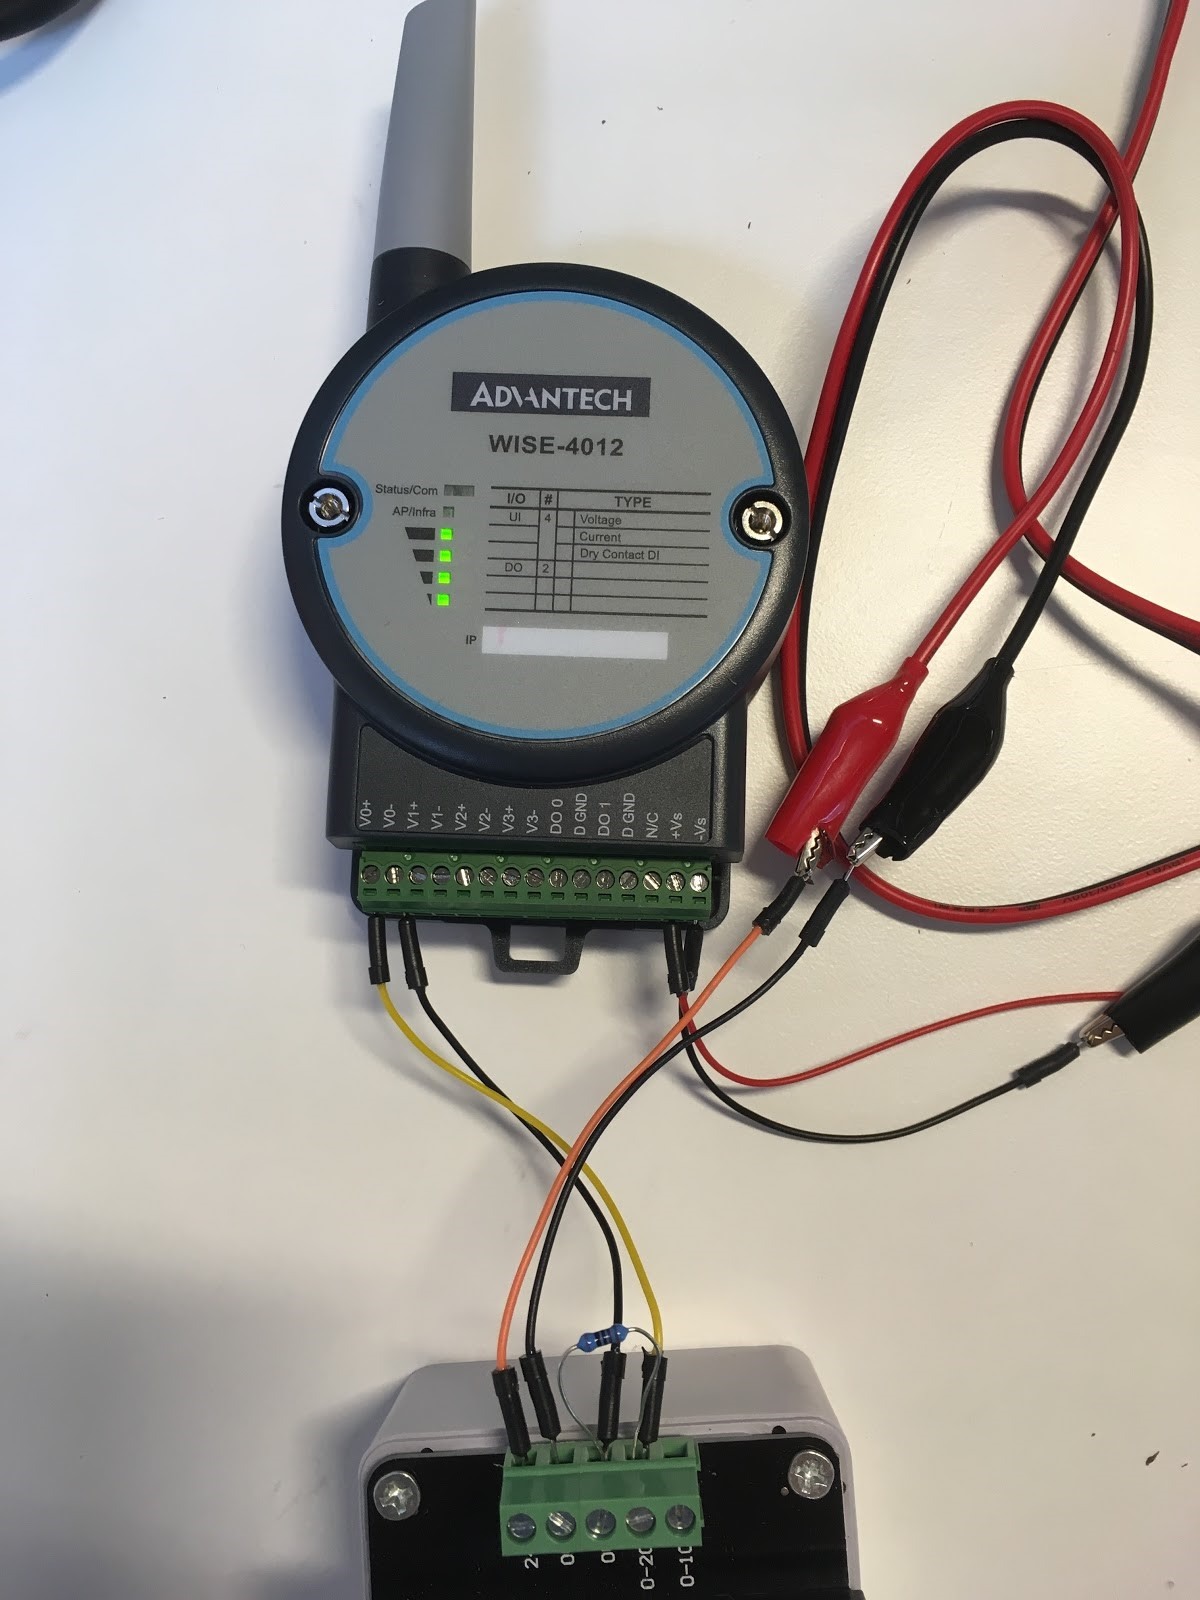
For power monitoring, they have explored many options. For the smart workplace kit, they decided on CT sensors with this Advantech WISE-4012 node:
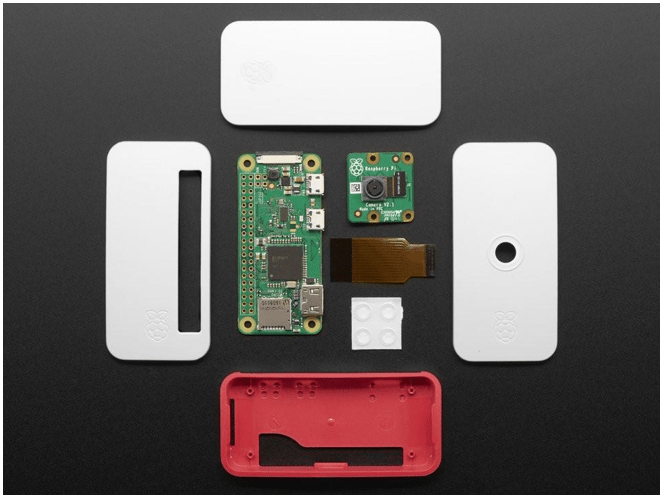
Timbergrove also monitors occupancy in shared spaces using Pi Zero-Ws with camera modules. While it’s overkill for simple motion detection, the solution is flexible and allows building managers to request more advanced features (e.g. people-counting or facial recognition) in the future if they wish.
Data flow to cloud
Digi exposes to a queue for data integration. Timbergrove strives to work with partners who make data integration easy. That’s how they keep their offering flexible without incurring huge development costs. As for the devices they manage themselves, Timbergrove use IBM’s Watson IoT Connection Services.
While Watson comes with some great developer tools and robust data governance, the end-user tools were lacking. To fill the gaps, Timbergrove explored several options and eventually settled on InfluxDB and Grafana.
Why did they make that choice? Several reasons. Alone, InfluxDB is the most popular open source time series database, and Grafana is the top open source tool for visualizing time series data. Together, they work seamlessly. Grafana has helper tools for constructing InfluxDB queries with all kinds of aggregations and filters.
"We can also set template variables based on InfluxDB tags, which makes it relatively easy to create dynamic dashboards that 'update themselves' as we add new sensors and devices. And when we want to work with InfluxDB more directly, we find that the documentation is very well-written with numerous examples. The TICK Stack gives us plenty of tools to explore and process our data. Though it took some customization to get all of the features we wanted, we are quite happy with this solution." - Aspen Hollyer, Software Developer, Timbergrove
Streaming to InfluxDB
For the smart workplace kit, Timbergrove streams data from their Digi queue and from IBM Event Streams (a managed Kafka service) to InfluxDB. Although they provide Grafana dashboards to their users, they also like to use Chronograf internally for exploring and visualizing data. Here, they were playing around with the built-in Holt-Winters forecasting algorithm to generate predictions on their temperature data:
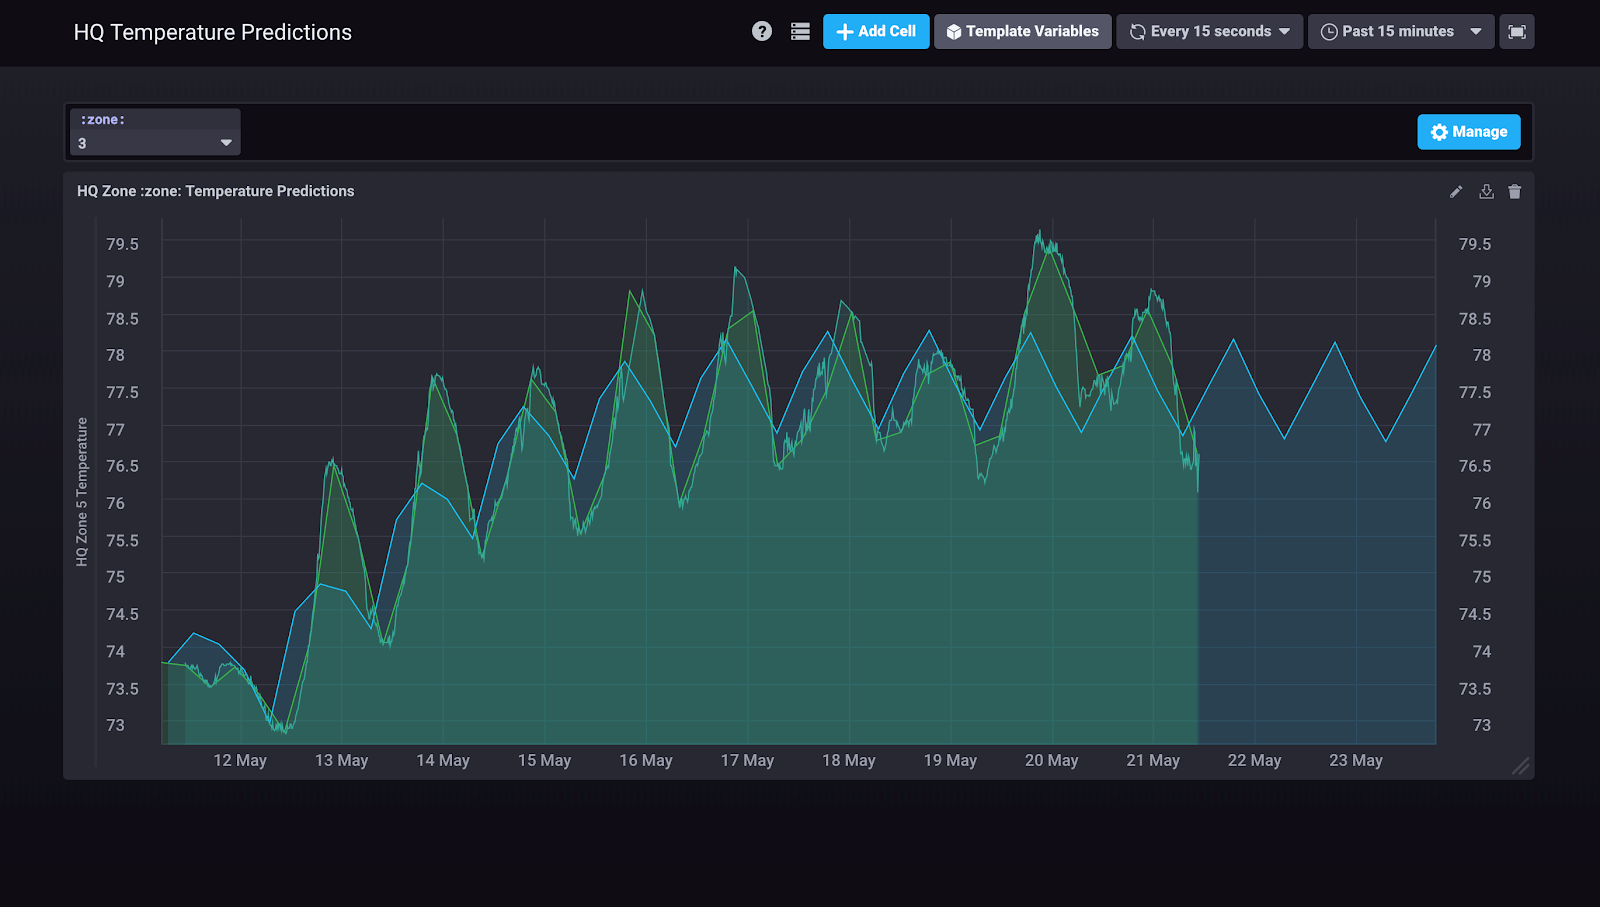 <figcaption> Office Temperature (F) vs. Time(days)</figcaption>
The Green line represents the raw data. The blue line represents the prediction emitted by the Holt-Winters forecasting function.
Visualizing IoT data from InfluxDB with Grafana
With InfluxDB as their data source, Timbergrove easily creates beautiful dashboards for their end users in Grafana:
- The first dashboard allows users to monitor the temperature and humidity levels in different building zones.
- The second dashboard displays the conference room occupancy status.
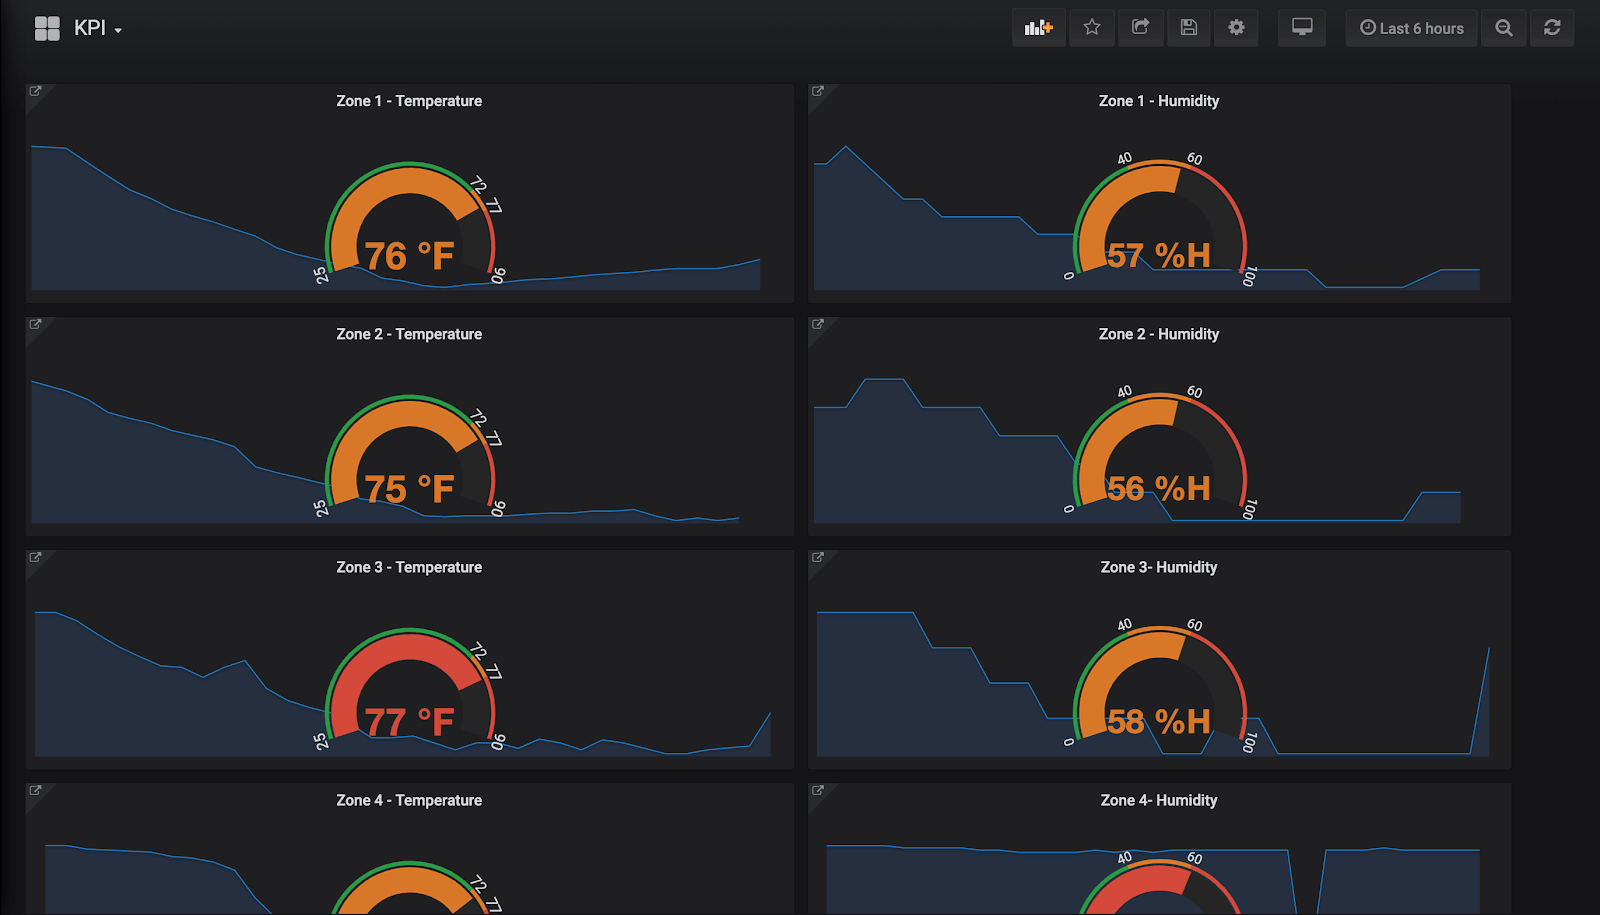
This KPI Dashboard displays the temperature and humidity for each building zone. Users can click any panel to drill down to a detailed dashboard for a specific building zone.
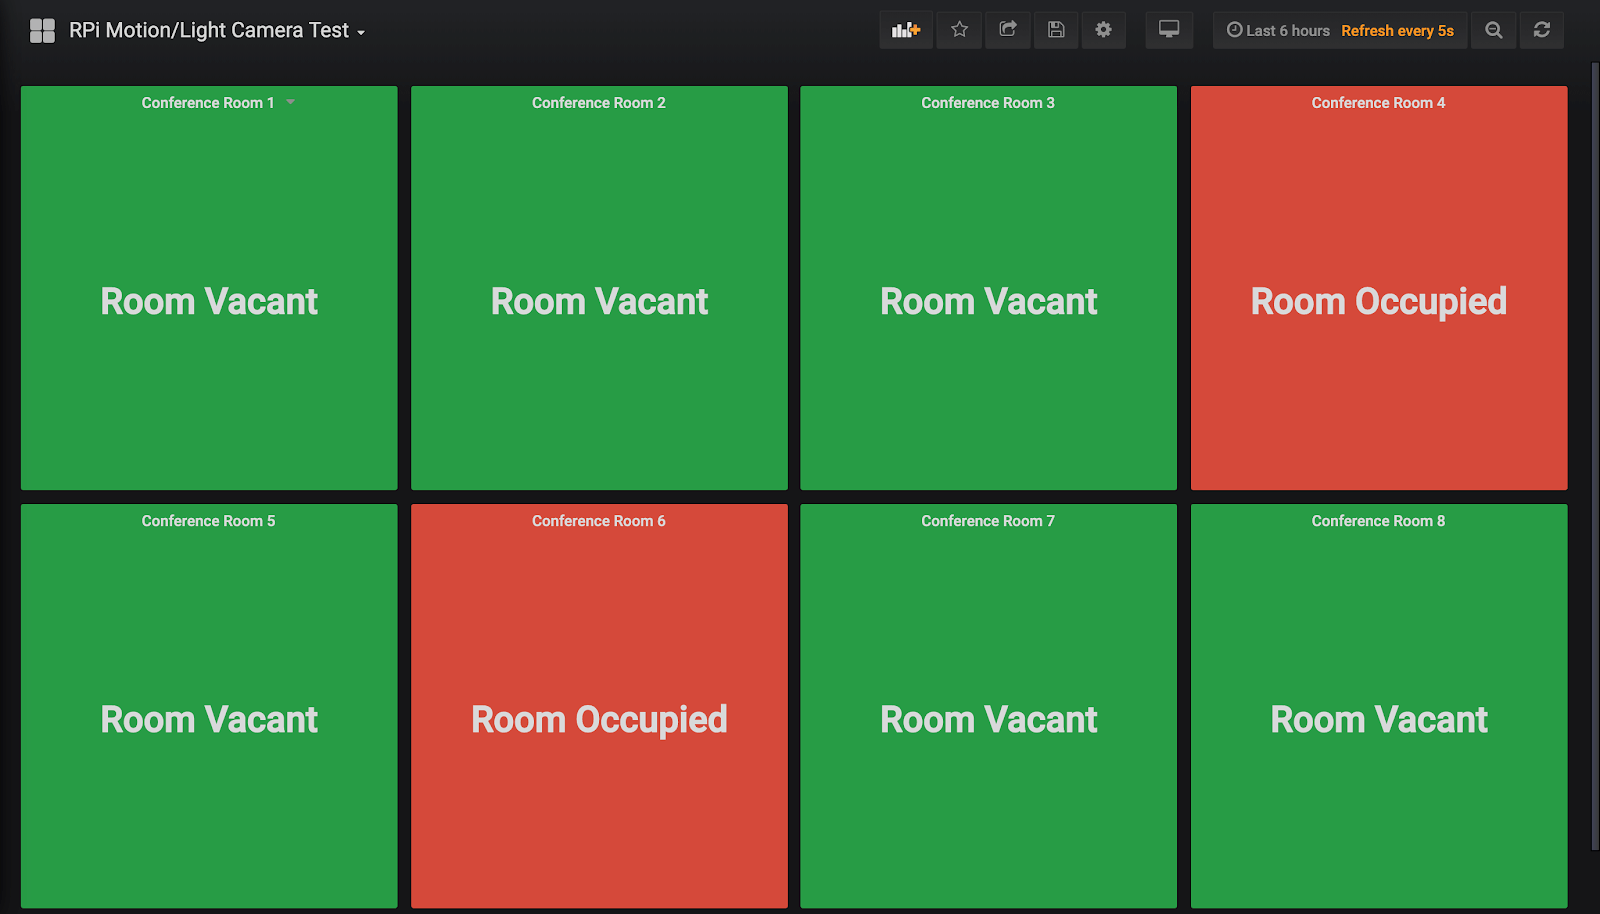
This visualization allows employees to determine conference room occupancy at a glance.
Configuring Kapacitor alerts through a custom Grafana plugin
While Grafana has an alert feature, Timbergrove found it lacking. To meet their needs, Timbergrove built a custom Grafana plugin to allow their users to configure alerts via Kapacitor’s REST API. The form makes use of a few Kapacitor templates to allow users to set up different types of alerts and notifications. Specifically, it allows the user to set threshold alerts, assign a severity level to the alert, and send those alerts to a recipient via email. Here’s an example of the Kapacitor alert form:
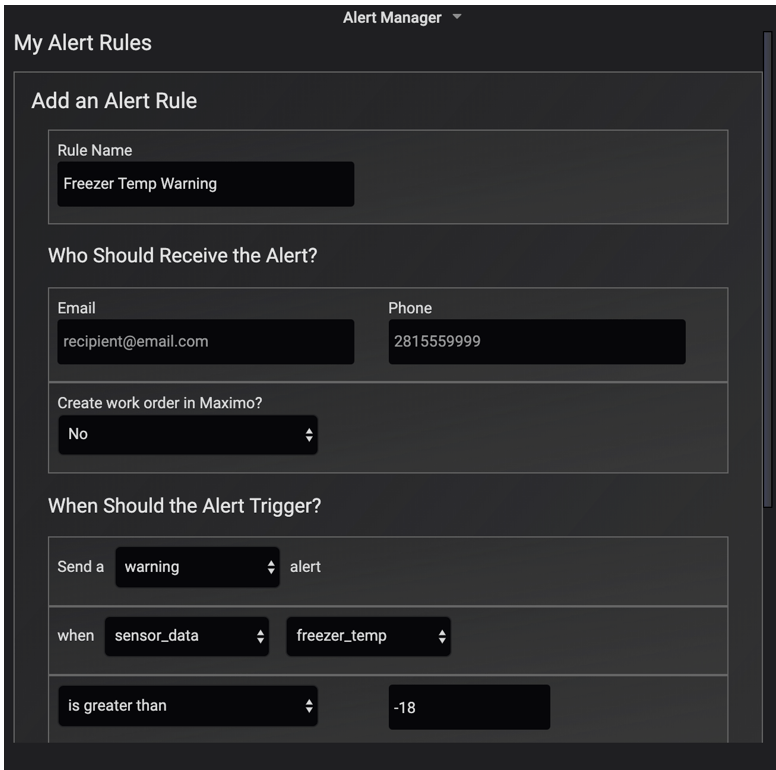 <figcaption> An example of Timbergrove’s custom Grafana plugin for configuring Kapacitor Alerts</figcaption>
Timbergrove has actually developed several custom plugins. They have one for geofencing with Mapbox and another for overlaying heatmaps on user-uploaded images. Timbergrove will release these plugins into the wild soon. In the meantime, follow Timbergrove on Linkedin or Twitter to learn more and keep up with these projects.
Future integrations
The smart workplace kit has been in use for several weeks now, and the temperature monitoring has been particularly helpful. Timbergrove integrates with Weather.com to correlate the building’s internal conditions with local weather data. Through this integration, they’ve uncovered trends that have enabled the building managers to use their HVAC system even more efficiently.
They’re still adding features, improving the kit, and preparing to install it in more locations, but take a look at the demo coming out on the IBM Watson YouTube channel in the near future.
On a lighter note, Timbergrove also has a smart valve and flow meter installed on the office keg. They can request a keg deposit for after-work events, monitor the amount consumed, and issue partial deposit refunds accordingly. They can even turn off the tap remotely although that feature probably doesn’t earn them any popularity points with their office mates. While it’s linked to a custom web application right now, Timbergrove plans to integrate it with Grafana so their users can do everything from one place.
Conclusion
Timbergrove looks forward to extending their IoT offering while staying true to their initial goals: deliver immediate value, keep things modular and extensible, and make their users’ lives easier, not harder. Please reach out if you have questions, or to learn more, visit https://timbergrove.com/ or follow Timbergrove @TimbergroveTalk.
About the contributor
An educator by training, Aspen Hollyer became interested in user-centered experiences and gamification while studying Curriculum & Instruction at Texas A&M. She began programming so that she could build cool learning experiences for her high school students. What began as a hobby grew into a career, and she now works as a software developer at Timbergrove, where she contributes to a variety of web applications and IoT projects. In her spare time, she participates in several Houston civic tech groups, organizes hackathons, and serves as a Technology Advisor for the StartHereNow women’s entrepreneurial competition.
Contributing a community highlight
Are you part of the InfluxData community? Do you have a story to tell? If so, we’d love to share it! Please contact Anais.
As always, if you have any questions, please post them on the community site or tweet us @InfluxDB.
