Configuring the Docker Telegraf Input Plugin
By
Anais Dotis-Georgiou
updated December 14, 2025
Product
Use Cases
Developer
Navigate to:
Thankfully, monitoring my containers with InfluxDB was surprisingly easy. Unfortunately, deriving value from container data is not. Understanding how to manage and allocate container resources is far from easy and DevOps still remains largely mysterious to me. My lack of understanding has come into focus as I started monitoring some containers locally. In this blog post, I will share my journey to understanding container monitoring better.
But first, let me show you:
- How I configured a reverse proxy and nginx server in Docker containers to serve a static HTML
- How I used Telegraf and InfluxDB to monitor these containers locally
- All of the questions that this exercise spurred
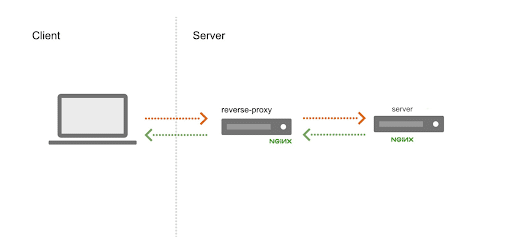
How I Configured a Reverse Proxy and nginx Server in Docker Containers to Serve a Static HTML
I decided to monitor containers on my local machine. I really enjoyed following this tutorial, and I recommend it to any new Docker users. First, I created two images. The first is a nginx image that serves a static HTML page. The second is an nginx reverse proxy image that forwards requests to all of the static app containers in Round Robin with a built-in DNS resolver. In order to build those two images, I created an “app” directory and a “proxy” directory. In my “app” directory, I created a dockerfile (a file that contains all of the commands required to build a docker image) and my static HTML. The dockerfile looks like this:
FROM nginx:alpine
COPY static.html /usr/share/nginx/html
It contains instructions for docker to build a nginx container (specifically, an alpine version). Static.html is copied into nginx’s default directory for static HTML files, so that it can serve the site. Since I was only interested in seeing what it’s like to monitor my containers with InfluxDB, my HTML is the painfully boring “Hello World” page:
<html>
<header><title>Monitoring Docker with InfluxDB</title></header>
<body>
Hello world
</body>
</html>
To build the nginx static app image, I use the command docker build -t "app" . -p 9000:80. This command builds the image and tags it with the name “app”. It also remaps port 9000 to port 80 on localhost.
In my proxy directory, I also have a dockerfile which contains the instructions for this image build. It looks like:
FROM nginx:alpine

COPY proxy.conf /etc/nginx/conf.d/
Here I am copying my proxy config file into the nginx’s default config directory. Proxy.conf contains instructions specifying where the proxy should listen for requests and how the DNS resolver should behave:
server {

    listen 80;

    resolver 127.0.0.11 valid=5s;
    set $app_address http://app;
    location / {
        proxy_pass $app_address;
    }

}
Specifically, proxy.conf tells the proxy server to listen on port 80 on localhost for any incoming requests. I also include the IP address (127.0.0.11) of the built-in DNS resolver so the proxy knows where to forward requests. This DNS resolver contains all of the IP addresses for all of the running app containers. It will pick one IP address and then perform round-robin DNS load balancing across the rest of the containers. By setting the valid=5s, we are telling the proxy to change the cache time to 5s. This way the proxy will discover any changes made to the DNS server more quickly. This was important for me because I wanted to be able to scale up by a few containers and immediately see the changes reflected in my InfluxDB instance. If I didn’t change the parameter to the valid variable, it would default to 5 min.
In production, this longer cache time makes sense because it helps minimize the load on the DNS resolver. However, I don’t have that type of time/patience. Not to mention I would have to spin up a lot of “app” containers to see the negative effects of a smaller valid variable. Since the goal of this project isn’t to try to perform a stress test on the DNS server nor to max out my resources, a cache time of 5s worked great (believe it or not, I sometimes try not to break things). Finally, setting the proxy_pass to the variable $app_address forces the proxy to try to discover what information is contained within that $app_address variable. To do so, it must look it up in the DNS resolver each time, ensuring that the address is updated.
The last piece of the configuration puzzle is the docker-compose.yml and the docker-telegraf.conf. The docker-compose.yml includes:
---
version: '2'

services:
    app:
        build: app

    proxy:
        build: proxy
        ports:
         - "80:80"
This yml merely specifies that there will be two services running: the app and the proxy. It also contains the relative pathways and the instructions for the builds.
How I Used Telegraf and InfluxDB to Monitor These Containers Locally
Telegraf is InfluxData’s open source collection agent for metrics and events. It’s plugin driven, so I need to include a config file with the appropriate input and output plugins in order to gather metrics from my Docker containers. I am using the Docker Input Plugin and the default InfluxDB output plugin. To generate my config file, docker-telegraf.conf, I run telegraf --input-filter docker --output-filter influxdb config > docker_telegraf.conf in my project directory. I send these container metrics to the default “telegraf” database. However, you can create a new database with the name of your choosing by changing line 95 in the config file:
## The target database for metrics; will be created as needed.
 database = "<database of your wildest imagination>"
I kept the default pathways and database configuration settings as described in the documentation for my Docker input. Specifically, the input section of my config looks like this:
[[inputs.docker]]
  ## Docker Endpoint
  ##   To use TCP, set endpoint = "tcp://[ip]:[port]"
  ##   To use environment variables (ie, docker-machine), set endpoint = "ENV"
  endpoint = "unix:///var/run/docker.sock"

  ## Set to true to collect Swarm metrics(desired_replicas, running_replicas)
  gather_services = false

  ## Only collect metrics for these containers, collect all if empty
  container_names = []

  ## Containers to include and exclude. Globs accepted.
  ## Note that an empty array for both will include all containers
  container_name_include = []
  container_name_exclude = []

  ## Container states to include and exclude. Globs accepted.
  ## When empty only containers in the "running" state will be captured.
  # container_state_include = []
  # container_state_exclude = []

  ## Timeout for docker list, info, and stats commands
  timeout = "5s"

  ## Whether to report for each container per-device blkio (8:0, 8:1...) and
  ## network (eth0, eth1, ...) stats or not
  perdevice = true
  ## Whether to report for each container total blkio and network stats or not
  total = false
  ## Which environment variables should we use as a tag
  ##tag_env = ["JAVA_HOME", "HEAP_SIZE"]

  ## docker labels to include and exclude as tags.  Globs accepted.
  ## Note that an empty array for both will include all labels as tags
  docker_label_include = []
  docker_label_exclude = []

  ## Optional TLS Config
  # tls_ca = "/etc/telegraf/ca.pem"
  # tls_cert = "/etc/telegraf/cert.pem"
  # tls_key = "/etc/telegraf/key.pem"
  ## Use TLS but skip chain & host verification
  # insecure_skip_verify = false
Next, I want to check to see if the proxy is working. I can scale the number of app containers I am running to make sure that the proxy was working. I use docker-compose up --scale app=3 to start 3 app containers. Next, I visit http://localhost. After refreshing several times, I see the following output:
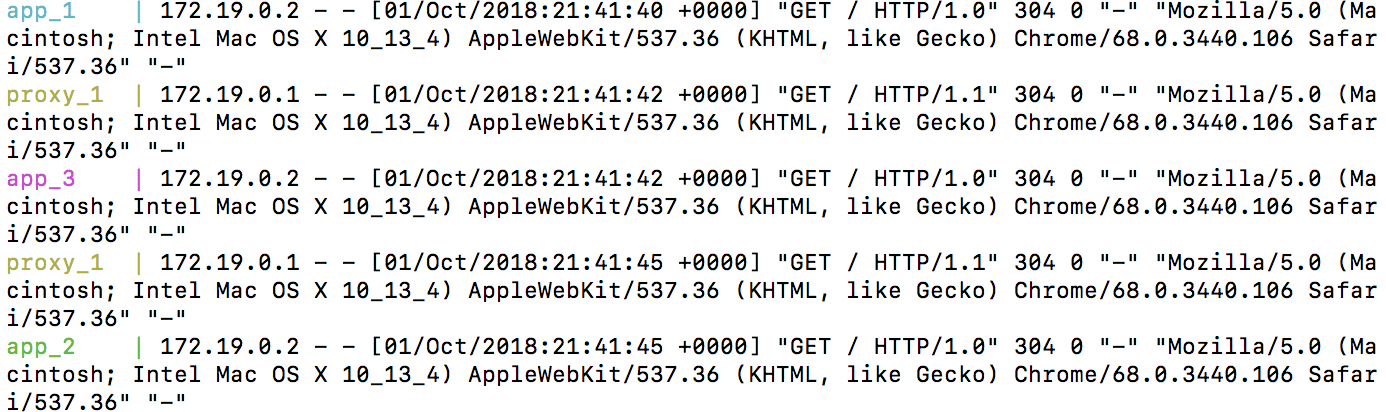
Yay! The proxy is successfully working. The requests are being directed to each container.
This proxy test will also enable me to see if Telegraf is successfully gathering metrics from my containers. I visit http://localhost:8888 to pull up Chronograf, InfluxData’s open source data visualization and alert management platform. In the default database called “telegraf”, I can now see all of my docker metrics. I run this query…
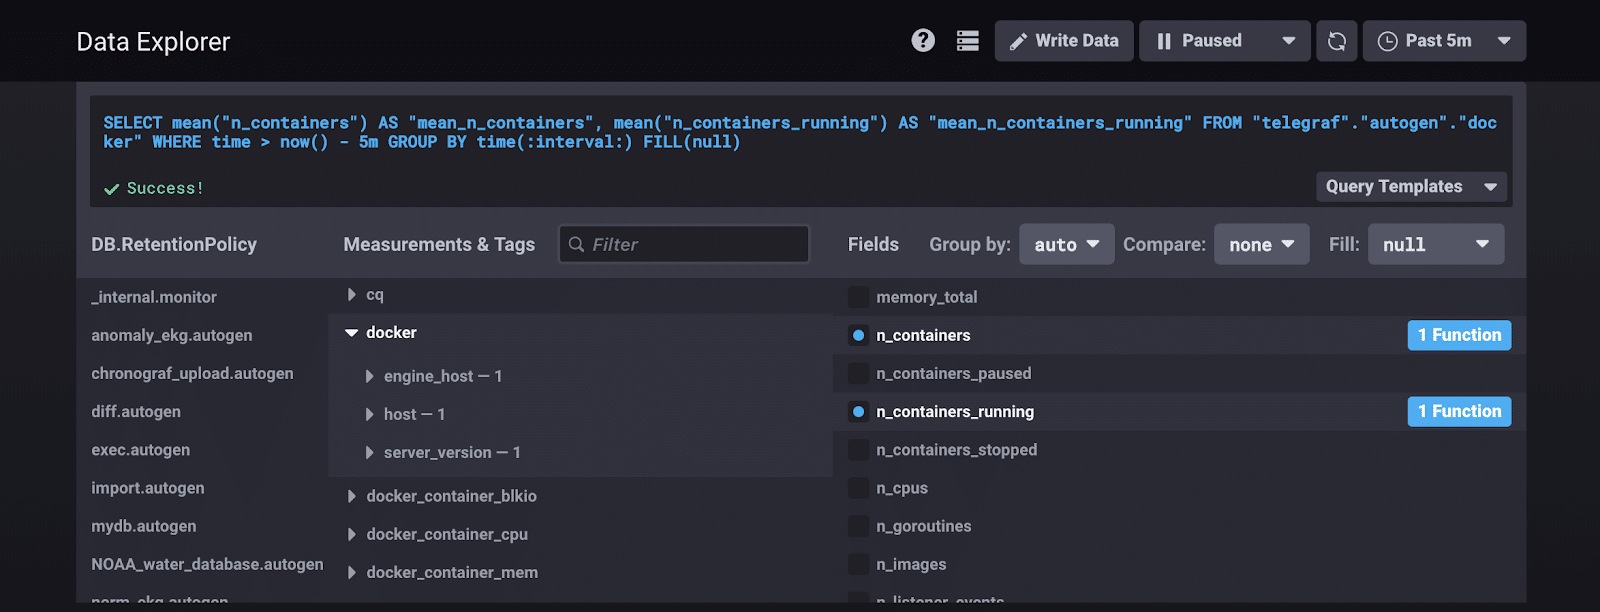
…to monitor the number of containers total and running containers. I get this expected outcome:
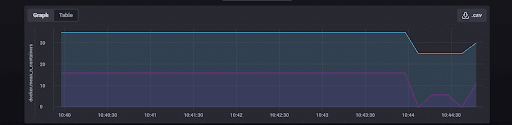
Wowawewa! Telegraf is sending container metrics to InfluxDB. My configuration is successful. I can gather the following metrics out of the box:
- Number of used file descriptors
- Number of CPUs
- Number of containers
- Number of containers running
- Number of containers stopped
- Number of containers paused
- Number of images
- Number of goroutines
- Number of listener events
- Total memory
But there’s so much more available to me. If I configure docker with the devicemapper storage driver, then I get access to about 5x more metrics. I can report on the health of my containers if I configure HEALTHCHECK, or I can monitor an entire Docker Swarm. That’s a lot of metrics.
All of the Questions That This Exercise Spurred
I want to ask the tough questions, lead a successful data investigation, and find the tech culprits. However, as I look at all the metrics available to me, I begin to feel overwhelmed. I don’t know what to do with them. I realize that I don’t understand the first thing about DevOps monitoring, testing, and alerting. I want to ask the deep questions, but first, I must find the answers to these basic questions:
- How does Docker allocate resources by default?
- Can I assign a certain amount of GHz to a process? (Spoiler: Hahaha...no)
- How can monitoring Docker locally be practical?
- What are the top 10 most important metrics? Is that a relevant question? Are any of these questions good?
- How does monitoring Docker containers compare to monitoring Kubernetes?
- How does Docker Swarm compare to Kubernetes?
- What type of test do DevOps engineers run to determine thresholds for container resources?
- What does the DevOps testing process look like?
- At what point do DevOps engineers decide to automate scaling?
- How do I use InfluxDB to monitor my application within a container?
I hope this blog post helps you get started with monitoring your Docker containers. I know it’s helped me identify the gaps in my knowledge. I look forward to trying to answer these questions and sharing my quest to understanding container monitoring better. Please let me know if you found anything confusing or feel free to ask me for help. You can go to InfluxData’s community site or tweet us @InfluxDB. Finally, I offer you this brain break.
 <figcaption> A drawing of a chameleon I made for your viewing pleasure</figcaption>
