A Deep Dive into Machine Learning in Flux: Naive Bayes Classification
By
Rohan Sreerama
Product
Use Cases
Developer
Sep 09, 2020
Navigate to:
Machine learning – the practice of writing algorithms that improve automatically through experience – has become a buzzword nowadays that connotes to something otherworldly and on the bleeding edge of technology. I’m here to tell you while that may be true, getting started with machine learning doesn’t have to be hard!
InfluxData annually hosts a Hackathon for interns. An intern myself, my team of 3 decided to take a stab at implementing a Slack-incident classifier to improve the daily workflow for the Compute Team. Although Scikit (a machine learning library for Python) can be used to easily classify Slack incidents, we decided to write a classifier from scratch in Flux (InfluxData’s data scripting and query language). At times it was fun and frustrating, but overall it was exhilarating. We chose Flux for its unique data-intensive capabilities that let us succinctly operate on time series data.
Our goal: Classify data using a Naive Bayes Classifier written in Flux.
What is a Naive Bayes Classifier?
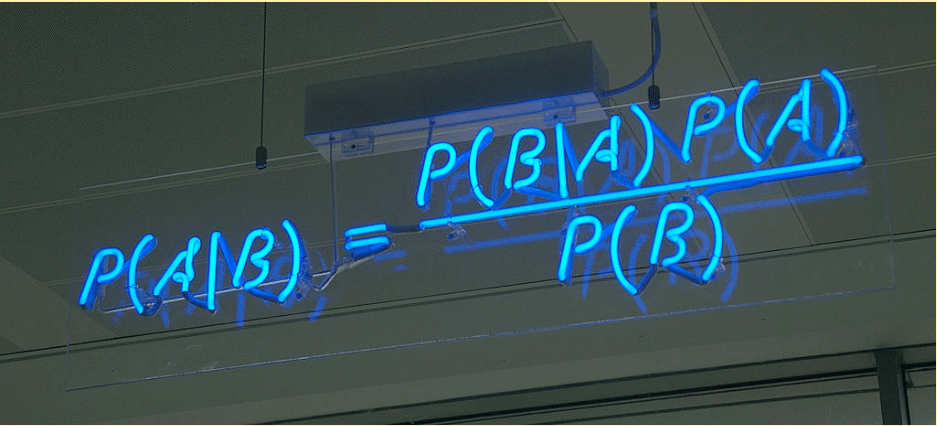
Naive Bayes classifiers are a family of simple probabilistic classifiers based on applying Bayes’ theorem with strong (nai?ve) independence assumptions between the features. A probabilistic classifier is a classifier that is able to predict, given an observation of an input, a probability distribution over a set of classes, rather than only outputting the most likely class that the observation should belong to. After a probabilistic classifier like Naive Bayes has been trained, predictions are made by determining the class with the highest probability.
We embarked on a daunting task by learning and writing code in Flux, a functional programming language, in a span of 2 days.
A couple of things about Flux
- Functional programming is different! Flux takes advantage of this by eliminating typical code constructs and using its own special functions which efficiently execute data-intensive tasks.
map(fn: (r) => ({ _value: r._value * r._value}))
The Flux map function iterates through every record applying a specified operation.
- Working with data is mostly done in a tabular fashion. In other words, you pass in and return enormous tables of data in functions, which makes performing complex calculations very intuitive and friendly. Take the Flux reduce function for example - it computes aggregate data for entire columns using a reducer function:
reduce(
     fn: (r, accumulator) => ({ sum: r._value + accumulator.sum }),
     identity: {sum: 0.0}
)
With that in mind, let’s get to the meat of this thing!
What our demo does
What we’ve got for you on GitHub is a Naive Bayes classifier implementation that currently predicts the following:
P(Class | Field) (Probability of a class given a field)
Our dataset utilizes binary information about zoo animals. For instance, we have a buffalo with numerous fields like backbone, feathers, eggs, etc. Each of these fields is assigned a binary true or false based on their presence in the animal (0 or 1).
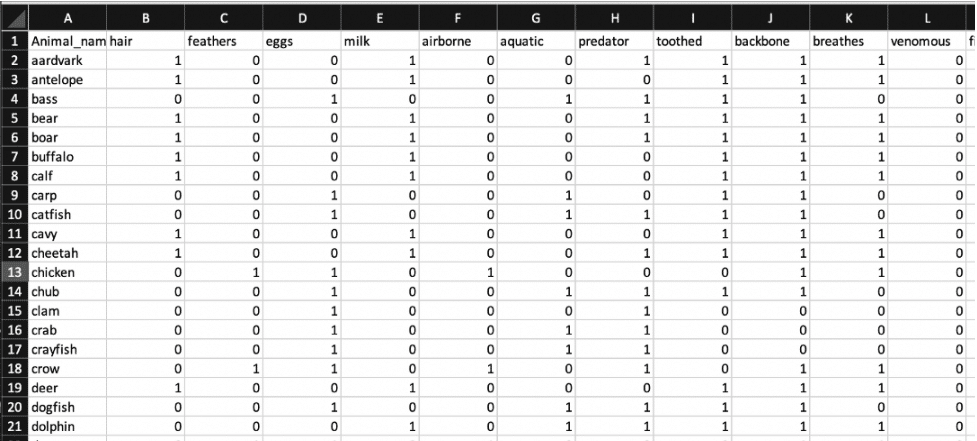
Our implementation currently makes predictions based on a single input field, aquatic. Our classifier predicts whether an animal is airborne or not. We used a Python script to write data into an InfluxDB bucket. In doing so, 'airborne' is set up as a tag in the Pandas DataFrame to initialize it as a Class, and the rest of the attributes are defaulted to an InfluxDB field type.
The following Flux code is the beginning of our Naive Bayes function. It allows you to define a prediction Class, bucket, prediction field, and a measurement. It then filters your dataset to divide it into training and test data.
naiveBayes = (myClass, myBucket, myField, myMeasurement) => {

training_data =
     from(bucket: myBucket)
     |> range(start: 2020-01-02T00:00:00Z, stop: 2020-01-06T23:00:00Z)     // data for 3 days
     |> filter(fn: (r) => r["_measurement"] == "zoo-data" and r["_field"] == myField)
     |> group()

test_data =
     from(bucket: myBucket)
     |> range(start: 2020-01-01T00:00:00Z, stop: 2020-01-01T23:00:00Z)    // data for 1 day
     |> filter(fn: (r) => r["_measurement"] == "zoo-data" and r["_field"] == myField)
     |> group()
...
We can predict the following:
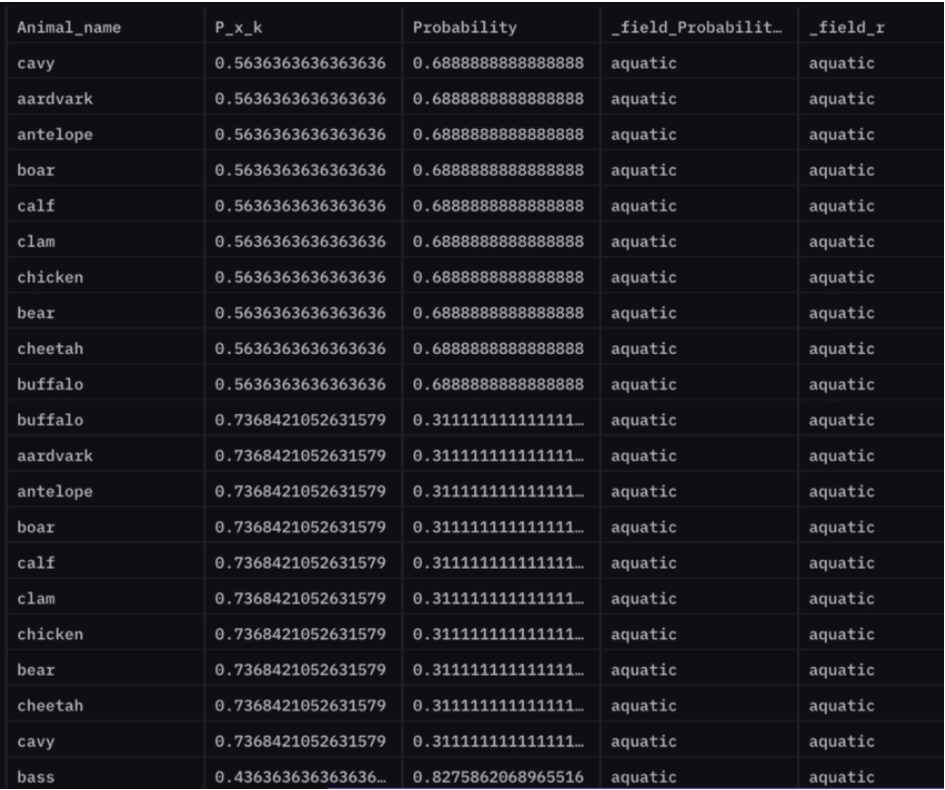
P(airborne | aquatic) (Probability that a given animal is airborne provided whether it is aquatic or not)
For instance, the probability that an antelope is airborne given it is not aquatic is 69%.
P(antelope airborne | !aquatic) = 0.688
How does all this work?
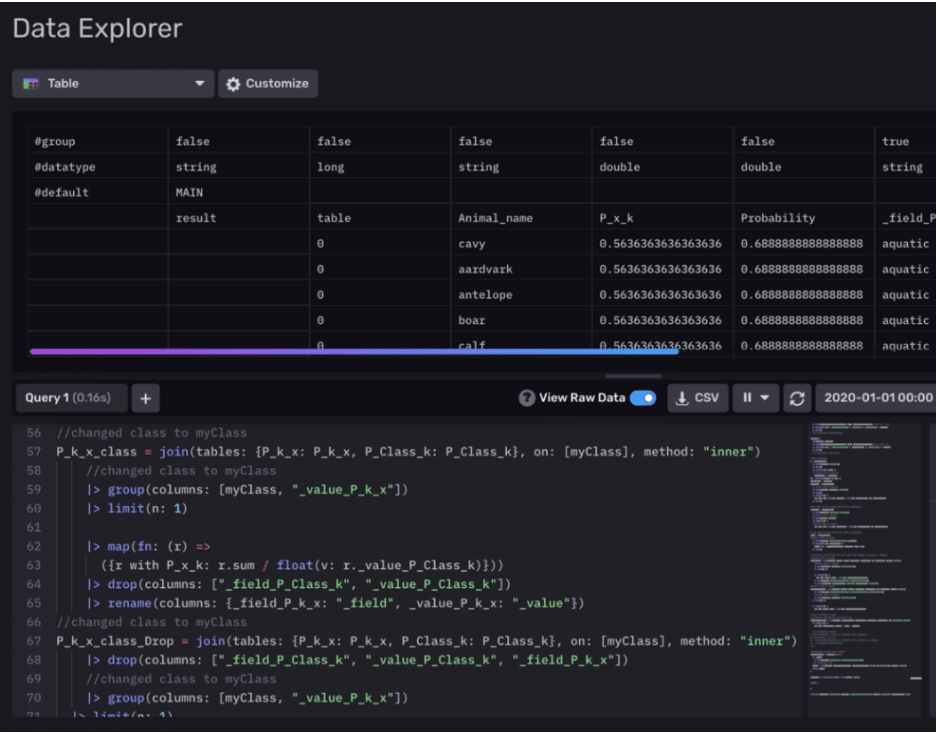
We’ve essentially divided our dataset based on time? – 3 days for training and 1 day for testing. After some data preparation, we create a probability table that is calculated using only our training data. At this point, our model is trained and ready to be tested. Finally, in predictOverall() we perform an inner join on this table along with our test data to compute an overall Probability table that contains predictions for animal characteristics.
...
// calculated probabilities for training data
Probability_table = join(tables: {P_k_x_class: P_k_x_class, P_value_x: P_value_x},
    on: ["_value", "_field"], method: "inner")
    |> map(fn: (r) =>
    	({r with Probability: r.P_x_k * r.p_k / r.p_x}))

// predictions for test data computed
predictOverall = (tables=<-) => {
    r = tables
      |> keep(columns: ["_value", "Animal_name", "_field"])
      output = join(tables: {Probability_table: Probability_table, r: r},
      on: ["_value"], method: "inner")
      return output
}

test_data |> predictOverall() |> yield(name: "MAIN")
...
In the future, we plan on supporting multiple prediction fields and leveraging the power of density functions to make more interesting predictions. Moreover, we hope to scale this production to be able to save trained models externally in a SQL table. This project will soon join the InfluxData Flux open-source contribution library, so stay in the loop!
You can run this demo with zero Flux experience! So what are you waiting for? Get started with ML in Flux right here.
Huge thanks to Adam Anthony and Anais Dotis-Georgiou for their invaluable guidance and support during this project. And much love to Team Magic: Mansi Gandhi, Rose Parker, and me. Be sure to follow the InfluxData blog for more cool demos!
Relevant links:
- InfluxDB: https://github.com/influxdata/influxdb
- ML Datasets: https://archive.ics.uci.edu/ml/datasets.php
- More great demos: https://www.influxdata.com/blog/
