Event Monitoring Visibility Made Easy: Sensu Check Metric Extraction with InfluxDB and Grafana
By
Chris Churilo
updated December 14, 2025
Product
Use Cases
Developer
Navigate to:
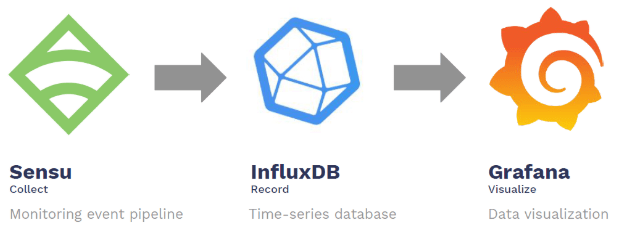
Monitoring dynamic, distributed environments often results in costly monitoring solution choices for developers seeking scalability, but your monitoring solution doesn’t have to be expensive. Sensu, InfluxDB, and Grafana - open source tools with enterprise counterparts - can work together to create a complete, scalable monitoring solution encompassing event monitoring, data ingestion and dashboarding.
What is InfluxDB?
InfluxDB is the essential time series toolkit an open source time series database designed to handle high write and query loads. It can store metrics, events, logs, traces from systems, sensors, queues, databases and networks – and can ingest millions of data points per second.
There are over 260,000 InfluxDB instances in use around the world, covering a number of use cases (DevOps monitoring, IoT and sensor monitoring, real-time analytics, network monitoring, and machine learning) across several industries. Since it is an open source project, InfluxDB is the place to start if you need a time series database.
Unlike other types of databases adapted for time series, InfluxDB was purpose-built for handling timestamped data making it easy to accumulate, analyze and act on the metrics your systems are instrumented for.
What is Sensu?
Sensu is a monitoring event pipeline which collects, processes and routes different event types including discovery, availability, telemetry and alerts. The pipeline makes Sensu extremely powerful and completely customizable.
Built to address the needs of a modern cloud computing environment, Sensu is popular for monitoring applications, services and infrastructure. The Sensu framework consists of client and server applications that communicate via a message bus.
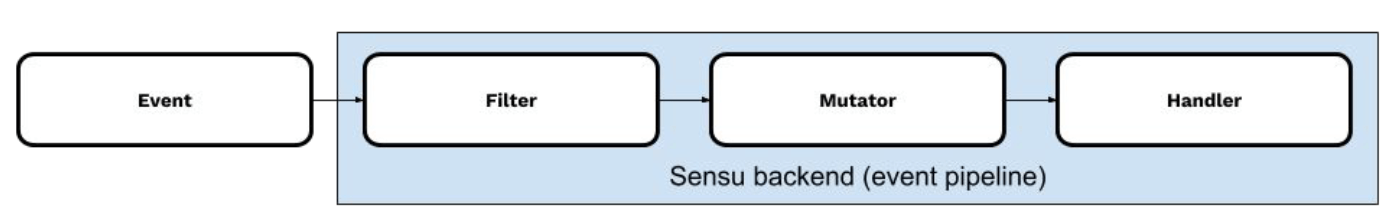
What differentiates Sensu in its space is its focus around pipelining. You can collect via many different ways, extend beyond that, and then filter, mutate and handle metrics. The Sensu backend has an API. So if you can transform your event format into the Sensu event format, Sensu can ingest it.
What is Grafana?
Grafana is an open source metric analytics & visualization suite. It is most commonly used for visualizing time series data for infrastructure and application analytics but may be used in other domains including industrial sensors, home automation, weather and process control.
How to use InfluxDB and Sensu for metric extraction
The free and open source version of the Sensu monitoring event pipeline is Sensu Go: it is a revamp of the original Ruby project, with some improvements surrounding metrics. Sensu offers multiple mechanisms to monitor performance metrics.
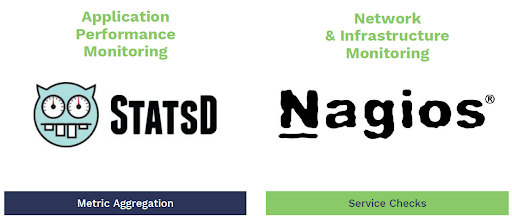
- StatsD is a metric aggregator used to collect values, such as gauges, counters, timers and sets. Each Sensu agent has an embedded StatsD daemon that'll listen for that UDP traffic.
- Sensu service checks are commands executed by the Sensu client that monitor a condition or collect measurements. The service checks collect data on monitored nodes and follow the same protocol as Nagios service checks.
- Each Sensu agent will run that collection of checks. Then the checks will output that data, produce an exit code, and indicate a specific state.
- Sensu will parse the output of that STDOUT (standard output) and produce metrics; hence, metric extraction.
- The more complex your stack gets, the more likely you'll need to set up both application performance monitoring (APM) and network & infrastructure monitoring.
Sensu currently supports four different output metric formats: InfluxDB, OpenTSDB, Graphite, and Nagios.
The metric type (each database name mentioned above) is the identifier that defines which format the check output should be parsed and mapped to the corresponding field output metric format.
Sensu check configuration
For ingesting metrics into InfluxDB, we define a check called check-cpu-influxdb. It’ll be set to run every 10 seconds on any node that you want it subscribed to.
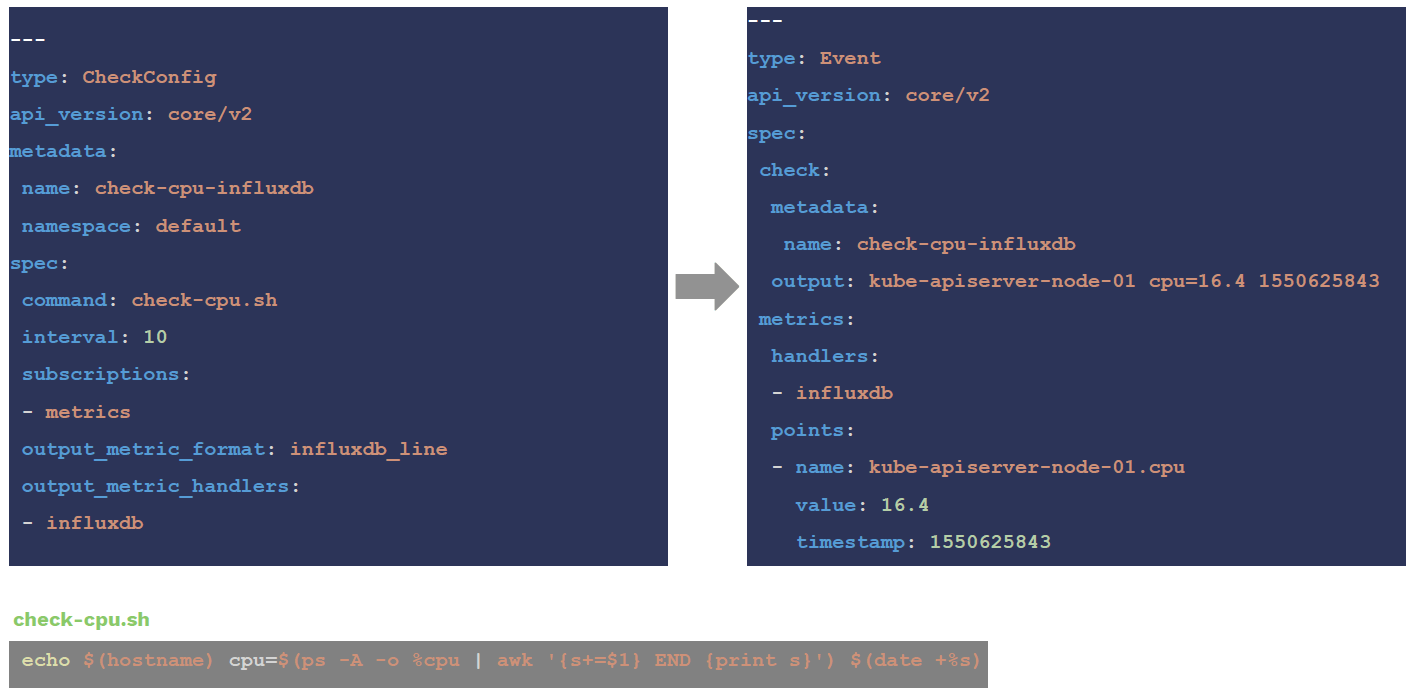
In the screenshot above:
- The command at the bottom is a simple shell script that will print out CPU usage in InfluxDB line protocol
- The last two fields on the left of the screen indicate that check output metric extraction will occur.
- The event produced contains not only execution context (such as status, output, duration) but also entity information about your monitored node, and most importantly, the extracted metric.
Now that we have a collection of metric points within a Sensu event, we can send it to InfluxDB.

The handler configuration on the right of the screen takes the event data and invokes the Go binary Sensu InfluxDB Handler a Sensu Event Handler that sends metrics to InfluxDB. Here’s how the handler works with Sensu:
- Sensu can collect metrics using check output metric extraction or the StatsD listener.
- The collected metrics pass through the event pipeline, allowing Sensu to deliver the metrics to the configured metric event handlers.
- The InfluxDB handler allows storing, instrumenting and visualizing the metric data from Sensu.
- The handler accepts configuration options as either command line flags or environment variables.
- Then, additional metric tag enrichment can happen as part of the Sensu event pipeline.
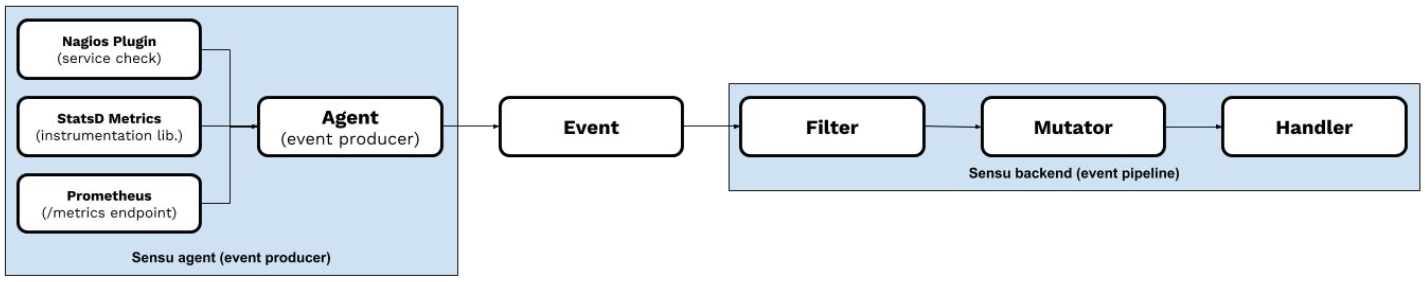
The monitoring event pipeline dataflow, as shown above, is as follows:
- The Sensu backend will send service checks to monitor nodes with installed Sensu agents.
- The agents will execute the check and extract the metrics in any of the four supported formats.
- The backend will receive that event data and pass it through the monitoring event pipeline.
- In this specific use case, you can filter this event, only if it contains metrics, mutate that event to enrich any metric tags and add additional context about the data and source of the metrics.
- Then you would handle the events by sending them off to a time series database.
Any telemetry event that the agent receives will be processed by the backend. This is important because in order to have complete visibility of your app, system, services and infrastructure, you’ll likely have to receive data from multiple sources. As you add different event types (like availability and alerts), you’ll be thankful that the pipeline is dynamic enough to support reusability all under the same hood.
While the Sensu dashboard does provide excellent visibility into the overall health and state of your system, it doesn’t directly visualize time series data. Enter Grafana time series analytics and visualization, which provides a critical and convenient overview of your infrastructure since the “all under one roof” methodology can simplify your workflow and telemetry.

In the above dashboard, there’s a single data source as far as Grafana is concerned because we let Sensu do all of the heavy lifting. The Sensu checks shown here display metrics from both Graphite and InfluxDB, while the StatsD daemon tracks all the API calls and request rates.
As for how development teams can use data stored from metric collection checks in InfluxDB, see our previous blog post Sensu and InfluxDB: Storing Data from Metrics Collection Checks where we also provide setup tutorial and introduce the integrations provided by the InfluxDB Sensu Plugin.
InfluxData workshop at Sensu Summit 2019
If you want to know more about monitoring with Sensu and InfluxDB, don’t miss out on the InfluxData hands-on workshop Integrating Sensu and InfluxDB during the upcoming Sensu Summit in Portland, Oregon this September. There, InfluxData’s DevRel Noah Crowley will show how to set up InfluxDB to store data from both service checks and performance metrics, create visualizations and dashboards from that data using the InfluxDB UI, as well as perform complex checks and alerting based on historical data.
Stop by the InfluxData booth at Sensu Summit (September 9-10 in Portland, OR) to learn more.
