Expand Kubernetes Monitoring with Telegraf Operator
By
Wojciech Kocjan
updated December 14, 2025
Use Cases
Product
Developer
Navigate to:
This article was originally published in The New Stack.
Monitoring is a critical aspect of cloud computing. At any time, you need to know what’s working, what isn’t, and have the ability to respond to changes occurring in a given environment. Effective monitoring begins with the ability to collect performance data from across an ecosystem and present it in a useful way. So the easier it is to manage monitoring data across an ecosystem, the more effective those monitoring solutions are and the more efficient that ecosystem is.
Kubernetes is a cloud computing workhorse, and the automation it provides is a game changer. Still, unchecked automation has the potential to create issues, so it’s necessary to monitor those automated processes. A popular monitoring solution for Kubernetes environments is Prometheus.
However, not all applications run exclusively in Kubernetes. If you want to use Prometheus to pull together metrics data from across multiple environments, including custom application servers, legacy systems and technology, you’re going to end up writing a lot of custom code to be able to access and ingest those metrics.
Enter Telegraf Operator, an environment-agnostic Prometheus alternative.
What Is Telegraf Operator?
First, we should distinguish between Telegraf and the Telegraf Operator.
Telegraf is an open source server agent designed to collect metrics from stacks, sensors and systems.
The Telegraf Operator, on the other hand, is an application designed to create and manage individual Telegraf instances in Kubernetes clusters. Essentially, it functions as a control plane for managing the individual Telegraf instances deployed throughout your Kubernetes cluster. Telegraf Operator is a standalone application, and it’s deployed separately from Telegraf.
Telegraf Operator Considerations
On a basic level, the Telegraf Operator scrapes metrics from applications with exposed endpoints in your Kubernetes cluster.
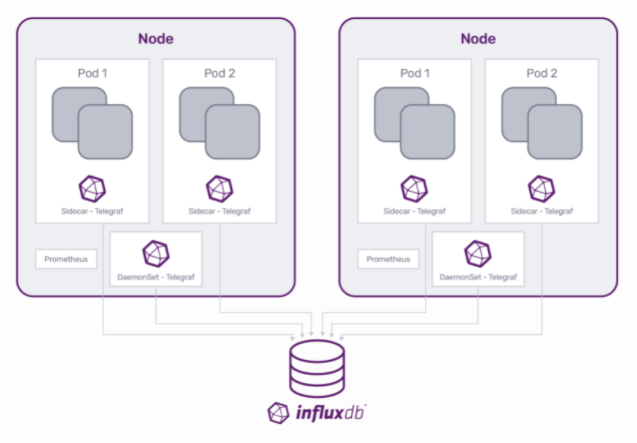
There are two main mechanisms for deploying monitoring agents, DaemonSet and sidecar. Depending on what, exactly, you want to monitor, which mechanism you should use differs. With InfluxDB, we recommend:
- DaemonSet for node, pod and container metrics.
- Sidecar monitoring for microservices that expose large amounts of metrics.
In a DaemonSet scenario, Telegraf runs on each individual node and collects infrastructure metrics on the node itself.
By contrast, in the sidecar deployment, the containerized instance of Telegraf shares the pod with the application container and scrapes data from exposed endpoints of that application.
Sidecar deployment
But where do sidecar Telegraf containers come from? That’s where Telegraf Operator comes into play.
Telegraf Operator works at the pod level, so you can use it with anything that creates a pod object in your Kubernetes environment. When something a deployment, StatefulSet, DaemonSet, Job or CronJob sends out a request to create a new pod, Telegraf Operator intercepts that request, using the mutating webhooks functionality in Kubernetes, and gets a chance to apply changes to it.
Telegraf Operator reads the pod annotations in the request and if an annotation says to add a Telegraf sidecar, then Telegraf Operator adds that instance as an additional container within that pod. In other words, Telegraf Operator looks at the list of containers for the new pod and adds another container to the list if instructed to do so by the annotations.
Once the Telegraf sidecar container is in place, it can begin scraping data and pushing metrics to a database such as InfluxDB.
Using a sidecar deployment for Kubernetes monitoring has several advantages. A sidecar monitoring agent lets you define custom metrics and monitoring of a specific application without affecting the overall monitoring framework shared by other workloads. This approach keeps endpoint exposure manageable. As more endpoints get exposed for an application, the sidecar approach facilitates better scalability because that Telegraf instance only scrapes data for the application in its pod.
Is the Telegraf Operator Right for You?
The answer to this question really depends on your ecosystem and what you’re trying to monitor. There are many different options and possibilities. We’ve outlined a few here.
Replacing Prometheus
Telegraf can function as a Prometheus server, so any metrics you want to collect with Prometheus you can also collect with Telegraf Operator. So, it’s possible to simply replace Prometheus with the Telegraf Operator. In this case, you’d replace the Prometheus exporters with Telegraf sidecar containers, add the annotations expected by Telegraf Operator to your pod specifications,and switch your data storage from Prometheus server to InfluxDB.
However, if the idea of ripping out all your Prometheus monitoring seems too disruptive, then there are many ways to use Telegraf and the Telegraf Operator to enhance or supplement your current Prometheus monitoring with legacy and custom application metrics.
Swap out part of Prometheus
If you want greater flexibility and accessibility for a diverse range of metrics, one option is to configure your Prometheus server to write directly to Telegraf. You can do this via the Prometheus Remote Write Telegraf plugin. You can configure the plugin to send the collected metrics to any database you want, such as InfluxDB. This setup allows you to send metrics from Prometheus server directly into InfluxDB, or, depending on your configuration, you can even send metrics to multiple locations. This is helpful if you want to do dual writing or create a backup system scenario for your metric data.
Telegraf can also function as a Prometheus server, so another option is to replace your Prometheus server with Telegraf. You can keep your Prometheus exporters in place because Telegraf is able to ingest that data. Once Telegraf collects that data, you have the same flexibility to send it wherever you want.
Run Telegraf and Prometheus in parallel
Yet another option is to run Prometheus and Telegraf in parallel. Both applications function the same way, scraping the data presented by the Prometheus exporters. You can configure both services to scrape data and then run side-by-side comparisons on that data, if necessary.
Another possibility with this setup is to use the Telegraf instance to write data somewhere externally from your Kubernetes environment and use the Prometheus server for any needs you have within your Kubernetes environment.
Big-picture data collection
In addition to these sidecar use cases, you can also use Telegraf Operator to run DaemonSet monitoring simultaneously, so you can get metrics on the actual pods and nodes. Doing this saves metric data for the entire ecosystem in one place, providing centralized monitoring for every aspect of your ecosystem.
If Kubernetes is just one of several environments your system runs on, the Telegraf Operator may be a better fit. As mentioned above, if you’re using Kubernetes and want to collect metrics from non-Kubernetes environments, things get more complicated. You’ll have to write a custom exporter for each type of technology you want metrics from and then configure it so that the Prometheus server can scrape those metrics.
By contrast, Telegraf has hundreds of available plugins that collect metrics not only from Kubernetes, but from external environments as well.
Installing the Telegraf Operator in Kubernetes
The telegraf-operator starts a pod in the cluster in its own namespace. Installing the telegraf-operator is very simple and you can do it via kubectl, as shown below:
kubectl apply -f telegraf-operator.yml
(You can find an example of the yml file in the deploy directory.)
You can also use other tools, such as Helm or Jsonnet, to install telegraf-operator.
helm upgrade --install my-release influxdata/telegraf-operator
Once installed, Telegraf Operator watches for pods deployed with a specific set of pod annotations, as mentioned above. The advantage to using Telegraf Operator is that you only have to define the input plugin configuration for Telegraf when creating the pod annotations. Telegraf Operator then sets the configuration for the entire cluster so your users don’t need to worry about configuring a metrics destination when deploying applications.
Start scraping metrics
Once you’ve installed Telegraf Operator, you just need to annotate the pod of the application container to start scraping your application or metrics endpoint.
Here’s an example of a DaemonSet deployment YAML file with Telegraf configuration data:
apiVersion: apps/v1
kind: DaemonSet
metadata:
 name: my-application
 namespace: default
spec:
 selector:
   matchLabels:
     app: my-application
 template:
   metadata:
     labels:
       app: my-application
     annotations:
       telegraf.influxdata.com/class: app
       telegraf.influxdata.com/port: "8080"
       telegraf.influxdata.com/path: /v1/metrics
       telegraf.influxdata.com/interval: 5s
       telegraf.influxdata.com/scheme: http
       telegraf.influxdata.com/internal: "true"
   spec:
     containers:
     - name: my-application
       image: my-application:latest
And here’s a sample of a StatefulSet deployment of Redis YAML file with Telegraf configuration data:
apiVersion: apps/v1
kind: StatefulSet
metadata:
 name: redis
 namespace: test
spec:
 selector:
   matchLabels:
     app: redis
 serviceName: redis
 template:
   metadata:
     labels:
       app: redis
     annotations:
       telegraf.influxdata.com/inputs: |+
         [[inputs.redis]]
           servers = ["tcp://localhost:6379"]
       telegraf.influxdata.com/class: app
   spec:
     containers:
     - name: redis
       image: redis:alpine
Configuring the Telegraf Operator
As mentioned above, telegraf-operator reads pod annotations to determine whether to inject the Telegraf sidecar and what configuration to apply.
Use the telegraf.influxdata.com/inputs annotation to pass telegraf configuration statements. You can pass configurations for any of the more than 200 Telegraf plugins this way. For Prometheus-based metrics, add telegraf.influxdata.com/port along with any other annotations, such as telegraf.influxdata.com/path or telegraf.influxdata.com/interval, and telegraf-operator generates part of the configuration for inputs.prometheus.
The telegraf.influxdata.com/class annotation specifies class of monitoring for the pod. A Kubernetes secret defines the classes, which gets read by telegraf-operator and later combined into the final configuration for Telegraf.
Classes usually specify outputs where the data should be sent, such as:
apiVersion: v1
kind: Secret
...
spec:
  stringData:
    app: |+
      [[outputs.influxdb]]
        urls = ["http://influxdb.influxdb:8086"]
      [[outputs.file]]
        files = ["stdout"]
      [global_tags]
        hostname = "$HOSTNAME"
        nodename = "$NODENAME"
        type = "app"
The Pod-level annotations documentation describes all supported annotations. Global configuration – classes documentation defines the classes.
As of version 1.3.0, telegraf-operator supports hot reloading configurations. This also requires Telegraf version 1.19. With the new features, changing the global configuration triggers all Telegraf sidecars’ configurations to be updated and reloaded by the telegraf process, without the need to manually restart any of the pods. More details can be found in Hot reload documentation.
Contribute to Telegraf Operator
At InfluxData we love open source, so if you’re interested in contributing to the Telegraf Operator plugin, we’d love to hear from you. You can reach us on Slack or check out our GitHub repos for more information.
