Fail2ban Monitoring with InfluxDB and Telegraf
By
Community
updated December 14, 2025
Product
Use Cases
Developer
Navigate to:
This article was written by Robert Hajek, Development Lead at Bonitoo, a software consultancy based in Prague and an InfluxData Consulting Partner.
If you have a server open to the internet on Port 22 (the default port for SSH servers), it’s common to find several “Failed password” in your auth.log (log file) every minute, due to bots constantly browsing the internet for servers that are easy to hack with common passwords.
But if your auth.log is growing very fast and SSH daemon randomly refuses to create new connections, then someone probably marked your server as a target for coordinated SSH brute-force attack. I experienced such an attack from more than 10k unique IPs in one day. Under such a load, the SSH daemon became unreliable and began to randomly refuse new connections. This can be dangerous for other dependent services and administrative tasks like automatic backups, rsync, etc.
One alternative is to disable Port 22 from internet access and allow only selected IP’s, but by doing that, you lose flexibility. The better alternative is to use Fail2ban intrusion prevention software framework, and to monitor its metrics. This is why I created the Fail2ban Monitoring Template. Here’s an overview of Fail2ban and of this monitoring template.
Hardening server security with Fail2ban
Fail2ban helps secure your server against unauthorized access attempts. With Fail2ban, you can configure your server to automatically block IP addresses that engage in suspicious activity. Fail2ban monitors server log files for intrusion attempts, and after a preset number of failures from a host, blocks that host’s IP address automatically for a specific duration.
While Fail2ban is particularly effective in reducing the risk from scripted attacks and botnets, it cannot eliminate the risk that weak authentication presents. One easy way to visualize Fail2ban metrics is the Fail2ban Monitoring Template, an InfluxDB Template.
Introducing the Fail2ban Monitoring Template
Like other InfluxDB Templates, this template is free and easy to set up. It lets you quickly define your entire monitoring configuration (data sources, dashboards, and alerts) in one easily-shared, open-source text file that can be imported into InfluxDB with a single command. I like the easy template setup from Git with:
influx apply -f https://raw.githubusercontent.com/influxdata/community-templates/master/fail2ban/fail2ban-template.yml -o my-org -t my-token
All you have to do is copy and paste the url into the InfluxDB 2.0 UI, and you’re up and running. To install this template, download InfluxDB or sign up for your free InfluxDB Cloud account.
How the Fail2ban Monitoring Template works
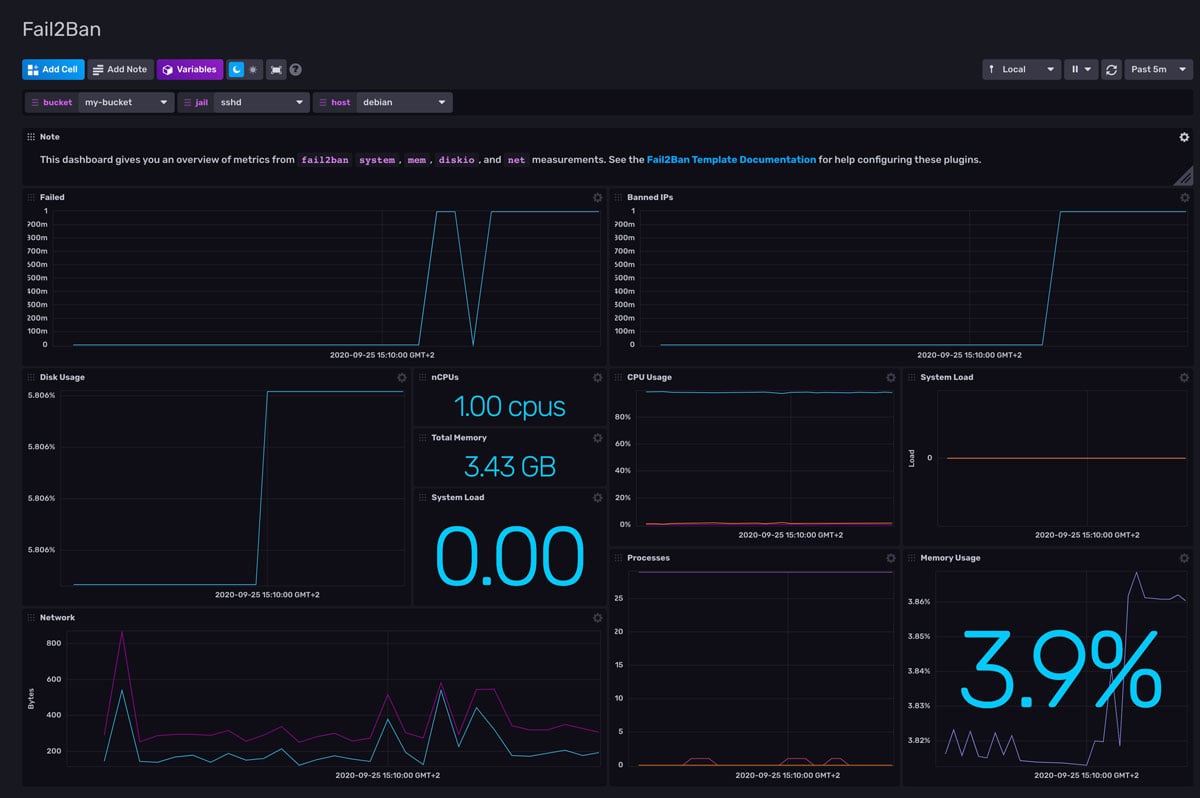
The template’s dashboard displays 2 metrics for each service and host:
- Number of failed access attempts - here we can see failed login activity
- Number of banned IPs - each banned IP address is one rule in the firewall. Later we found that a large number of such rules (in our case, more than 20k unique IPs) causes networking problems, so you need to slightly tweak the Fail2ban configuration in jail.d/sshd.local as such:
[sshd]
enabled   = true
maxretry  = 3
findtime  = 1d
bantime   = 3d
ignoreip  = 127.0.0.1/8
This means that after 3 unauthorized attempts during a 1-day window, the IP address will be banned for 3 days and that 127.0.0.1/8 is excluded from banning.
The Telegraf Fail2ban Input Plugin will allow you to collect and monitor the failed and banned IP addresses that you specify over time. It gathers the count of failed and banned IP addresses using Fail2ban. The data collected by the plugin is visualized in the template’s dashboard.
Using this plugin may require a permission tweak that can differ on Linux platforms. The user that runs Telegraf must have permission to run the “fail2ban-client status” command. In our case, we had to modify systemd settings.
Tips on how to live with an open SSH port
SSH allows you to log in to a remote computer or server and control it through a command-line interface. However, because SSH is exposed to the internet, attackers can try to log in by trying various username and password combinations. Here are some tips on how to better secure your SSH port:
- Use SSH public key based login, disable password based logins in sshd_config
- Use strong key and secure your private key with strong password
- Monitor ssh daemon
- Monitor the size of your auth.log
- Always setup Fail2ban (default settings work well for most setups)
- If you want to know where attackers are located, see this Jupyter notebook that groups IP lists from "fail2ban-client status" by country.
