The Final Frontier: Using InfluxDB on the International Space Station
By
Jessica Wachtel
Apr 30, 2024
Developer
Navigate to:
The Alpha Magnetic Spectrometer (AMS) conducts long-duration missions of fundamental physics research on board the International Space Station (ISS). Its research includes searching for antimatter, investigating dark matter, and analyzing cosmic rays. The AMS collected over 200 billion cosmic ray events since its installation in 2011. Scientists at CERN Payload Operations and Control Center (POCC) in Geneva and the AMS Asia POCC study data from the Alpha Magnetic Spectrometer around the clock.
Overview
POCC engineers modernized their Alpha Magnetic Spectrometer (AMS) software system by replacing their relational database backend with purpose-built time series database, InfluxDB. The modernized AMS includes Grafana for client-side visualizations. By implementing InfluxDB and Grafana, two key components of the MING stack, POCC engineers eliminate the need for custom scripting updates and have a simplified way to add, query, and visualize vital data from the AMS.
The business challenge
Due to the extreme conditions in outer space, engineers installed sensors to collect the AMS’s health data in addition to sensors geared toward scientific experimentation. The AMS’s health monitoring sensors collect data focused on temperature, pressure, voltage, and other health-based categories. With the ISS’s orbit lasting ~93 minutes, health values change drastically, from maximal to minimal within that time frame. For example, without using controlled heaters or thermal blankets, temperature values can range from -60C to +80C. Because of these immense swings, AMS health data requires real-time monitoring to allow scientists to perform immediate adjustments before values go beyond their range.
The AMS Monitoring Interface (AMI) is the software system POCC scientists use to monitor the AMS. In recent years, the performance of the legacy AMI became inefficient, taking upwards of 45 seconds to reveal data visualizations. To accomplish real-time monitoring, engineers at the POCC needed a monitoring system that was as cutting-edge as the technology it monitored.
The technical challenge
POCC used a custom legacy AMI that relied on many different software tools working in concert. Much of this work was redundant, relied heavily on server-side rendering, and had a single point of failure. The legacy AMI consisted of many different monitoring consoles, each with a dedicated data feeder. The data feeders parsed AMS raw data files, and only one of those feeders was dedicated to sending data to the relational database that powered the web client.
The legacy AMI also relied on custom scripting for most tasks, including common events such as adding sensors and changing visualizations. This meant simple daily tasks required highly specialized engineering work. Rather than creating static visualization plots using client-side resources, the legacy AMI created visualizations on the server side, causing the system to depend unnecessarily on server resources.
Technology wasn’t the only problem. The data model didn’t fit the type of data the AMS collected. The AMS’s relational database backend relied on the relationships between data points as its organizational foundation. However, when it came to AMS data points, their natural temporal ordering and characteristics were more important than the relationships between the data. The volume of AMS data also created many caching issues with its original relational database.
When engineers installed a new Upgraded Tracker Thermal Pump System (UTTPS) onto the AMS, there were two choices for the AMI—create a custom script for each sensor (there were 79 temperature sensors alone) or move forward with a complete modernization. The team opted for the latter. For the transition from a relational data model to time series, they turned to InfluxDB.
The solution
POCC engineers built their new AMI using two pieces of software—InfluxDB and Grafana. Purpose-built time series database, InfluxDB, manages the storage of AMS data in its new time series format. Grafana is the new visualization tool. The new software build follows modern design principles, leans on client CPUs for processing work, utilizes distributed dashboard creation, and follows up-to-date security protocols.
The new AMI also offers a simplified method of updating without the need for custom scripting and allows the use of APIs to automate backup and synchronization. POCC engineers began using the new AMI in January 2020. The new system was a crucial component in the remote shift during the COVID-19 pandemic.
The architecture
The modernized AMI relies on a new custom feeder program. The feeder processes raw AMS data as time series data points and then feeds the data to InfluxDB. The feeder parses the raw AMS files or data stream via the POCC’s multicast, identifies key sensor IDs, extracts the sensor data, and then sends the values to InfluxDB.
Sensor data includes the sensor type, data type, respective value(s), and timestamp identifying when the sensor logged the information. The feeder program routinely scans for new files, with each file representing one minute of data streams. The feeder only parses the raw data once.
The new AMI includes two independent instances of InfluxDB. CERN’s Database on Demand (DBOD) servers host one instance of InfluxDB; POCC’s servers host the second instance of InfluxDB for dual redundancy. Each instance has a connection to Grafana. POCC engineers use git synchronization to keep the plots and dashboards identical on both Grafana decks. The InfluxDB instance hosted on CERN’s DBOD is the web client for general AMS members, while the POCC version replaced the many monitoring consoles at POCC.
To add data to InfluxDB, the CERN and POCC databases listen for HTTPS requests on select ports. The feeder program creates a string with relevant information, identifies which database server to send the data, takes in credentials and a port number, and uses InfluxDB HTTPS line protocol to submit the information. The database then receives and stores the data. Engineers can access the data directly from InfluxDB via commands through time series analytics software.

The diagram above details the AMS’s modernized architecture.
POCC engineers found that InfluxDB has the fastest data querying compared to competing time series databases, such as TimescaleDB. The engineers valued speed as AMI data queries take place every few seconds. POCC engineers’ studies also revealed that InfluxDB is simpler and more efficient than competitors, even on low-powered devices. InfluxDB uses a SQL-like query language, which allows for easier data retrieval and supports many in-query aggregation and math functions. InfluxDB consistently ranks as the most popular time series database on DB engines.
In addition to InfluxDB, Grafana is also user-friendly and does not require custom scripts to create any dashboards or visualizations. With Grafana, teams can create dashboards and visuals to fit their individual needs. Eliminating custom scripts improves update speeds and grants teams the autonomy to create easy-to-understand, interactive visuals. This helps POCC engineers better understand the monitoring data, make comparisons, understand trends, and spot abnormalities. Grafana promotes safe global collaboration with custom user settings that prevent unnecessary and accidental tampering.
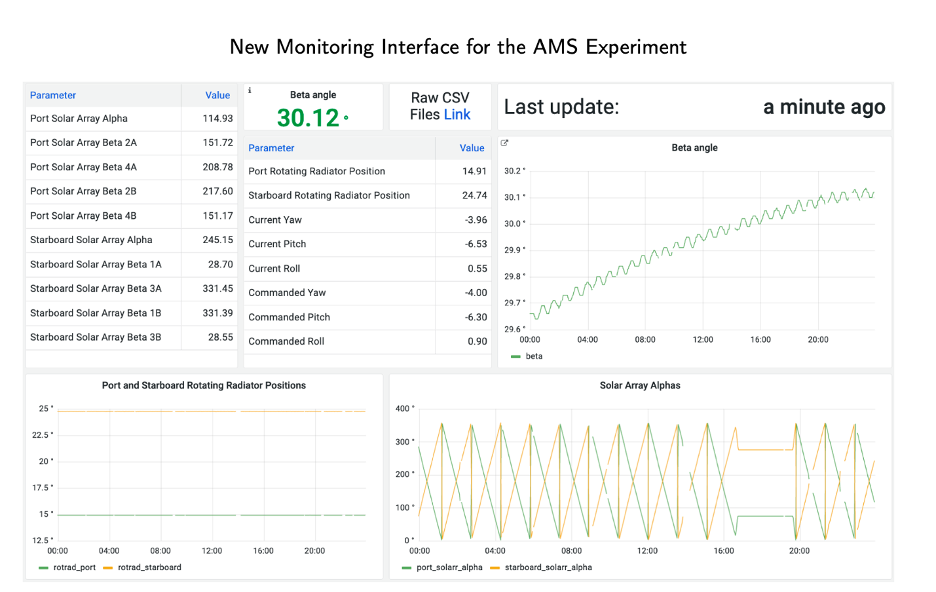
The image above is an example of a commonly used dashboard at the POCC. The dashboard illustrates the usage of single value stats (the current Beta angle and Last Update Panel), tables (showing ISS rotation and solar array parameters), scatter plots (such as the beta angle), and a custom-made panel.
Results
The new AMI simplifies data analysis, allowing POCC engineers to improve the quality of data acquisition. For example, the POCC engineers needed a more sophisticated schedule for the photon trigger. Photons are neutral, meaning the photon trigger activates when pair production occurs. As a result of background noise contamination from the particle tracks, the photon trigger fired too frequently, suppressing the activation of other triggers.
To better understand the timing around the highest chances of photons hitting subdetectors, the engineers dove into the data. They processed longitude, latitude, Level 1 Tigger times, and AMS livetimes and created a photon trigger that only activated at times of highest probability.
At the publication of this technical paper, this architecture was current.
Next steps
POCC engineers found that easy implementation of machine learning algorithms was another area of benefit. In the future, they plan to develop robotic monitoring systems that use machine learning to analyze time series data and make predictions for automatic adjustments.
Click here to learn more about using InfluxDB in the aerospace and aviation industry.
Want to try out InfluxDB for yourself? Sign up for a free trial.
