Forecasting with FB Prophet and InfluxDB
By
Anais Dotis-Georgiou
updated December 14, 2025
Product
Use Cases
Developer
Navigate to:
I think that a lot of people immediately associate the word “time series” with “forecasting”. After all, who doesn’t want to be able to predict the future? While we can’t do that quite yet, we can produce forecasts with confidence intervals. In this tutorial, we’ll learn how to make a univariate time series prediction with Prophet and InfluxDB.
What is Prophet?
From the Prophet GitHub site: “Prophet is a procedure for forecasting time series data based on an additive model where non-linear trends are fit with yearly, weekly, and daily seasonality, plus holiday effects. It works best with time series that have strong seasonal effects and several seasons of historical data. Prophet is robust to missing data and shifts in the trend, and typically handles outliers well. Prophet is open source software released by Facebook’s Core Data Science team. It is available for download on CRAN and PyPI.”
Advantages of Prophet
According to Prophet Documentation, Prophet was created to be:
- Accurate and Fast - Models are fit in Stan, "a state-of-the-art platform for statistical modeling and high-performance statistical computation".
- Fully Automatic - Facebook understands that time series forecasting is niche. Data scientists might not have extensive training in it and find other forecasting methods to be too hard to tune or too inflexible. Prophet is supposed to be easy to use. "Prophet is robust to outliers, missing data, and dramatic changes in your time series."
- Tunable - Facebook assumes that data scientists have deep domain expertise. Prophet aims to account for potentially idiosyncratic features by allowing data scientists to apply their expertise and easily tweak the forecast.
How Prophet works
We won’t go into much detail here, but essentially Prophet works similarly to Holt-Winters or Triple Exponential Smoothing. Prophet combines seasonality, trend, and holidays. Prophet is represented by the following equation:
y(t)= g(t) + s(t) + h(t) + ?t
where:
g(t): piecewise linear or logistic growth curve for modeling non-periodic changes in time series s(t): periodic changes (e.g. weekly/yearly seasonality) h(t): effects of holidays (user provided) with irregular schedules ?t: error term accounts for any unusual changes not accommodated by the model
Assumptions and considerations
This tutorial assumes that you have read and followed the steps in the previous article “Getting started with the InfluxDB Python Client”, and that you have InfluxDB and the Client installed. The repo that accompanies this tutorial can be found here. This tutorial also assumes that you know how to use Telegraf to write the data to InfluxDB. Finally, please note that the majority of this code is taken from Prophet’s quick-start example notebook. This tutorial simply aims to: 1) demonstrate the integration of Prophet and InfluxDB and 2) familiarize you with Prophet.
Querying InfluxDB, converting to a DataFrame, creating a forecast
Import dependencies:
import pandas as pd
import time
from datetime import datetime
from fbprophet import Prophet
Define Auth parameters and connect to client:
from influxdb_client import InfluxDBClient, Point
from influxdb_client.client.write_api import SYNCHRONOUS
token = $my-token
bucket = $my-bucket
org = $my-org
client = InfluxDBClient(url="http://localhost:9999", token=token, org=org)
query_api = client.query_api()
write_api = client.write_api(write_options=SYNCHRONOUS)
Create a Flux query:
query = 'from(bucket:"fbprophet")' \
        ' |> range(start:2007-12-10T15:00:00Z, stop:2016-01-20T15:00:00Z)'\
        ' |> filter(fn: (r) => r._measurement == "views")' \
        ' |> filter(fn: (r) => r._field == "y")'
Query InfluxDB and return the results:
result = client.query_api().query(org=org, query=query)Convert the results into a list:
raw = []
for table in result:
    for record in table.records:
        raw.append((record.get_value(), record.get_time()))
print(raw[0:5])
Convert raw data to DataFrame:
print()
print("=== influxdb query into dataframe ===")
print()
df=pd.DataFrame(raw, columns=['y','ds'], index=None)
df['ds'] = df['ds'].values.astype('<M8[D]')
df.head()
Fit the model by instantiating a new Prophet object and passing in the historical DataFrame:
m = Prophet()
m.fit(df)
Use the helper method Prophet.make_future_dataframe to prepare your dataframe for forecasting:
#365 specifies the number of time series points you'd like to forecast onto
future = m.make_future_dataframe(periods=365)
Make your prediction:
#The predict method will assign each row in future a predicted value (yhat). The upper (yhat_upper) and lower (yhat_lower) confidence intervals are also included as a part of the forecast. Columns for components and uncertainty intervals are also included in the forecast, although they aren't displayed here.

forecast = m.predict(future)
forecast[['ds', 'yhat', 'yhat_lower', 'yhat_upper']].tail()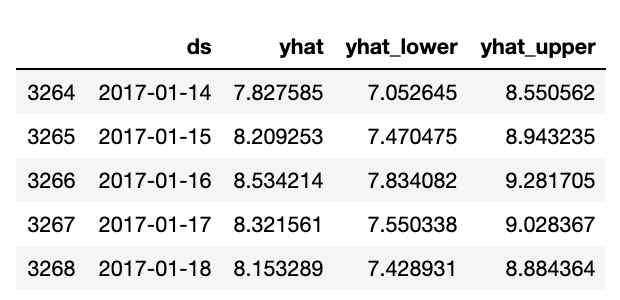
Converting the DataFrame to Line Protocol
Now we’re ready to convert our prediction to Line Protocol and write it to our instance.
Add a measurement column to our DataFrame:
forecast['measurement'] = "views"Convert the DataFrame to Line Protocol:
cp = forecast[['ds', 'yhat', 'yhat_lower', 'yhat_upper','measurement']].copy()
lines = [str(cp["measurement"][d])
         + ",type=forecast"
         + " "
         + "yhat=" + str(cp["yhat"][d]) + ","
         + "yhat_lower=" + str(cp["yhat_lower"][d]) + ","
         + "yhat_upper=" + str(cp["yhat_upper"][d])
         + " " + str(int(time.mktime(cp['ds'][d].timetuple()))) + "000000000" for d in range(len(cp))]
Write the lines to your instance:
from influxdb_client import InfluxDBClient, Point, WriteOptions
from influxdb_client.client.write_api import SYNCHRONOUS

_write_client = client.write_api(write_options=WriteOptions(batch_size=1000,
                                                            flush_interval=10_000,
                                                            jitter_interval=2_000,
                                                            retry_interval=5_000))

_write_client.write(bucket, org, lines)
Close the client:
_write_client.__del__()
client.__del__()
Visualizing our forecast with InfluxDB UI
Finally we can use the UI to quickly visualize the forecast we made. We simply select the bucket, measurement, and field values that we want to display to construct a Flux query. Hitting “Submit” builds this beautiful visualization:

Conquering the forecasting battle with InfluxDB and Prophet
Data collection is only half of the battle. The other half is being able to easily perform data analysis. FB Prophet aims to make time series forecasting simple and fast. InfluxDB supplements that effort by providing client libraries in several languages, so you can easily integrate good tools. For this tutorial, I decided to write my scripts to convert the result of the query into a DataFrame. However, the 2.0 InfluxDB Python Client has Pandas functionality. I recommend checking out this blog to learn about how to return DataFrames directly from your query.
I also worked with a relatively small dataset, but the 2.0 InfluxDB Python Client has multiprocessing capabilities that allow you to write over 4 million points in about 20 seconds on your local machine. If you’re looking to tackle a time series analysis project in Python, the InfluxDB Python Client is a good bet. As always, if you run into hurdles please share them on our community site or Slack channel. We’d love to get your feedback and help you with any problems you run into.
