The Free Linux System Monitoring Dashboard from InfluxDB
By
Anais Dotis-Georgiou
updated December 14, 2025
Product
Use Cases
Developer
Navigate to:
Linux system monitoring is necessary to ensure uptime, indicate system resource usage, and show which apps are consuming what percentage of resources. Monitoring Linux thereby enables users to properly manage applications and ensure the system is in good health.
With Linux having become a mainstay of enterprise infrastructure that underpins systems for cars, phones, web servers and much more, a massive number of Linux servers in production around the world are running some of the most popular applications and services. If you’re in charge of running or maintaining Linux machines, you need visibility into system performance and resource consumption.
Monitoring your Linux system
Since capacity planning and performance monitoring together give you a full picture of your hardware and software lifecycle, maintaining a performant Linux System can involve monitoring:
- Users and applications consuming the maximum bandwidth
- System uptime, load and memory consumption that provides information about under and over capacities to help with planning
- Unusual incidents to analyze for suspicious traffic
- Disk I/O, Network traffic, and process run to identify critical weak points and imbalances
A premade dashboard for Linux system monitoring
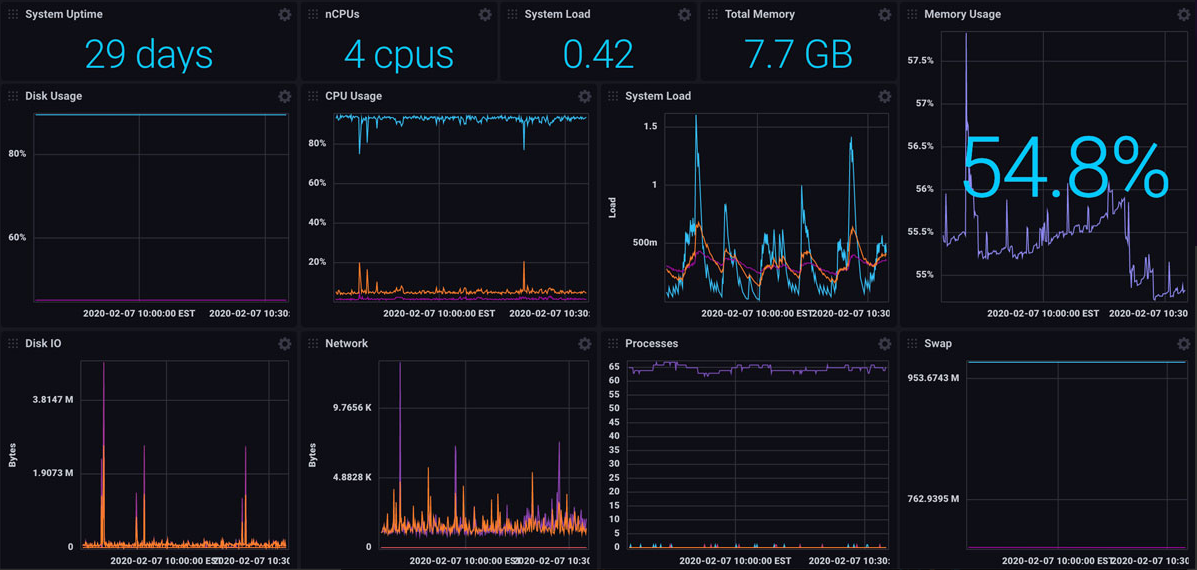
The InfluxDB Linux System Monitoring Template provides a dashboard that monitors your Linux System by tracking key metrics and availability stats: disk, CPU, and memory usage; system load; disk I/O; network; processes; and swap.
Here’s how the template works. Metrics are:
- Collected by Telegraf (InfluxDB's native metrics collector, which works out of the box with this template)
- Stored in InfluxDB (database purpose-built to handle time series data)
- Visualized in the template's dashboard (shown below)
This template, like other InfluxDB Templates, lets you quickly define your entire monitoring configuration (data sources, dashboards, and alerts) in one easily-shared, open-source YAML file that can be imported into InfluxDB with a single command.
The ease of using InfluxDB Templates
The template allows you to gather metrics and create dashboards simultaneously. All you have to do is copy and paste the url into the InfluxDB 2.0 UI, and you’re up and running. By using this template, you get the benefits of the database as well, which include high read and write rate, scalability, flexible data retention policies and downsampling capabilities to suit your storage and aggregation needs.
For all InfluxDB Templates, the emphasis is ease of use. You don’t have to learn any Flux, you don’t have to configure Telegraf, or build dashboards. The simplicity of this turnkey monitoring solution is echoed by the community. The recurrent feedback I hear is that developers are using the templates with ease that they’re easy to apply and easy to create. They also make cross-collaboration across organizations easy. It’s a great way for a beginner to get started with InfluxDB.
To install this template and get started with Linux monitoring today, download InfluxDB or sign up for your free InfluxDB Cloud account.
