Getting Started: InfluxDB Cloud & Telegraf on macOS
By
Al Sargent
updated December 14, 2025
Use Cases
Product
Developer
Navigate to:
This article was originally published on Medium by Al Sargent.
Recently I’ve been playing with InfluxDB and Telegraf on my MacBook Air. I thought I’d share my notes for how to get started with InfluxDB and Telegraf on a Mac. First, some background.
What is InfluxDB?
If you’re not already familiar, InfluxDB is a time-series database from InfluxData that is much better than relational databases like Postgres, and document databases like MongoDB, at collecting time series data. Which brings us to our next question
What is time series data?
Time series data is information for which you want to track the history of change over time. What does that mean? Well, let’s look at what time series data is not.
In many SaaS apps, you can only see the most recent state of whatever it is your working with. For example, in Salesforce, the current status of your customer accounts. But it’s hard to see how an account changed over time, because the relational database that Salesforce uses has a hard time tracking that information to any level of granularity or scale.
With time series data, change over time is everything: What is the temperature of this room over time? What is the CPU utilization of this container over time? What is the price of this stock over time? What has been this customer’s data utilization over time? This data sometimes exists at high levels of granularity, as frequently as microseconds or even nanoseconds.
How is time series data used?
Time series data comes up in a broad set of use cases, including systems monitoring, IoT sensors, customer billing, autonomous vehicles, and stock market analysis, to name a few.
How do Telegraf and InfluxDB work with time series data?
Telegraf is an agent platform for collecting time-series data and sending it to InfluxDB, which then stores the data for later analysis and presentation.
Step-by-step guide
With that background out of the way, let’s dive in. The first thing to do is head over to InfluxData and sign up for a free account for InfluxDB Cloud 2.0.
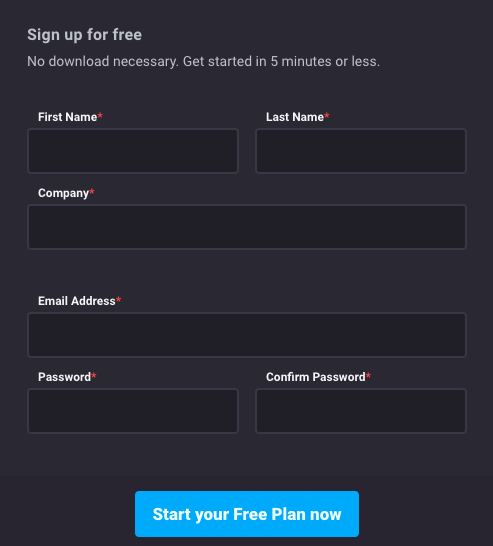
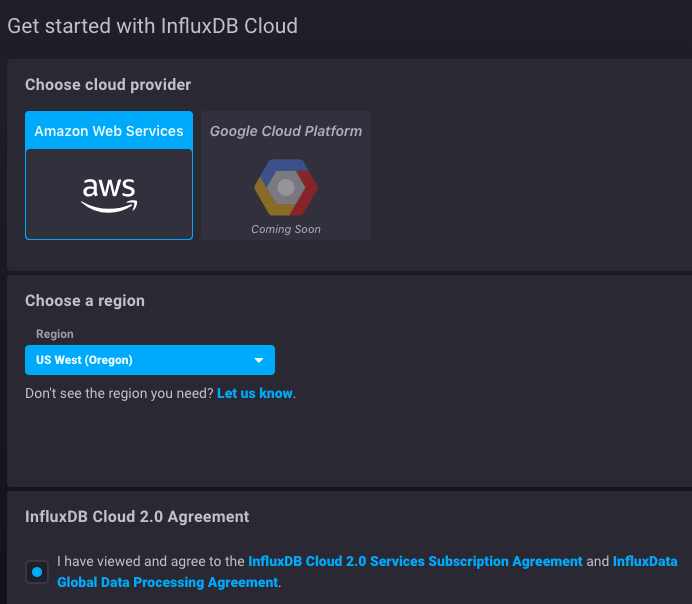
Fill in your info, head over to your inbox, click the link confirm your email, and pick your cloud provider. I chose AWS.
You’ll be prompted to load data into InfluxDB:
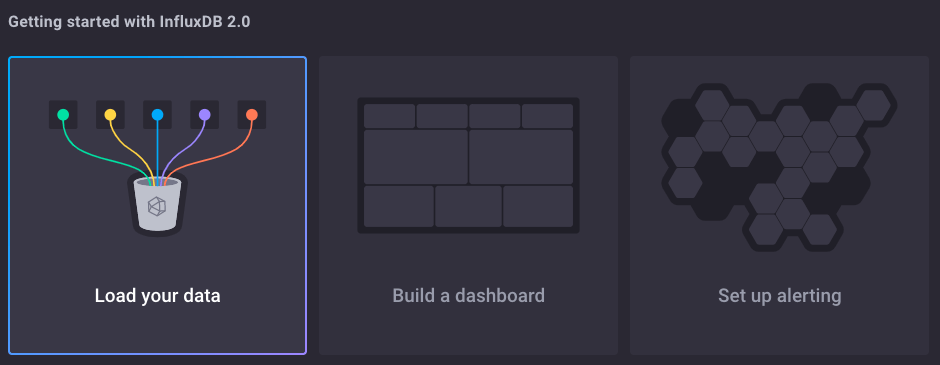
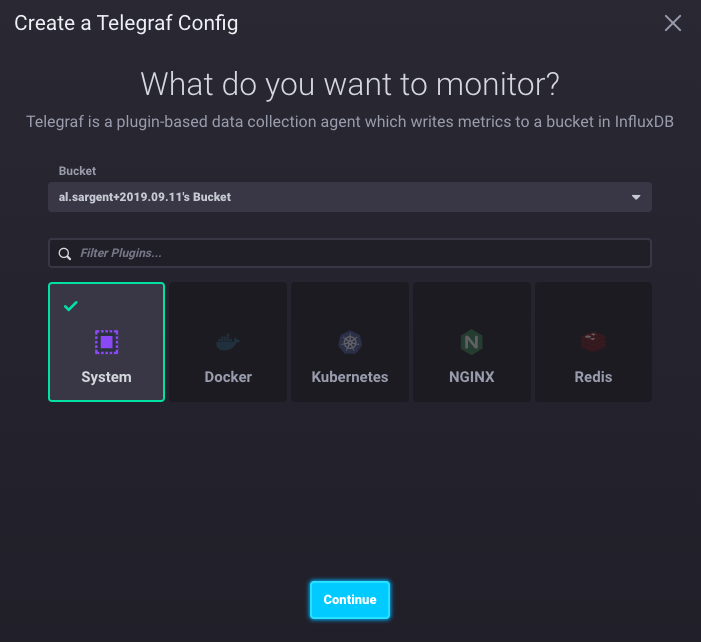
Click Load your data. Stick with the default option of loading data with Telegraf.
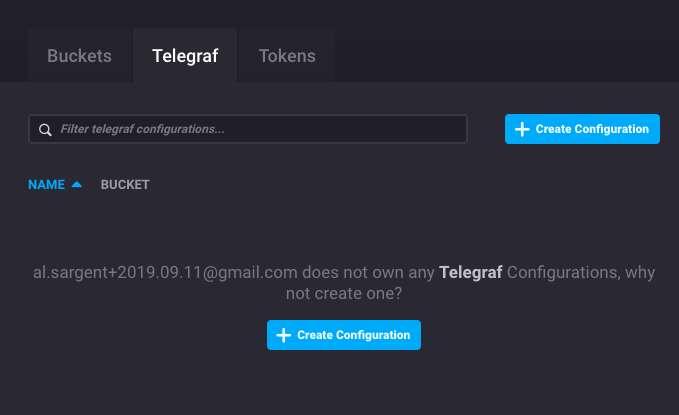
Click Create Configuration. To keep things simple, we’ll use metrics from our Mac laptop as our time series data stream. So, click System then Continue.
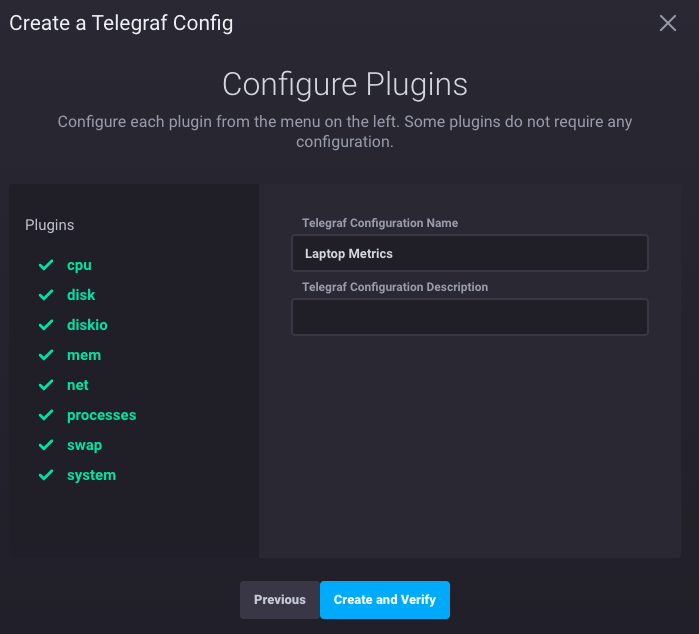
Name the Telegraf configuration, then hit Create and Verify.
The next part is a nice bit of UX. InfluxDB Cloud lays out all the steps to do and provides you with the exact commands to connect Telegraf on your local machine to InfluxDB running on AWS.
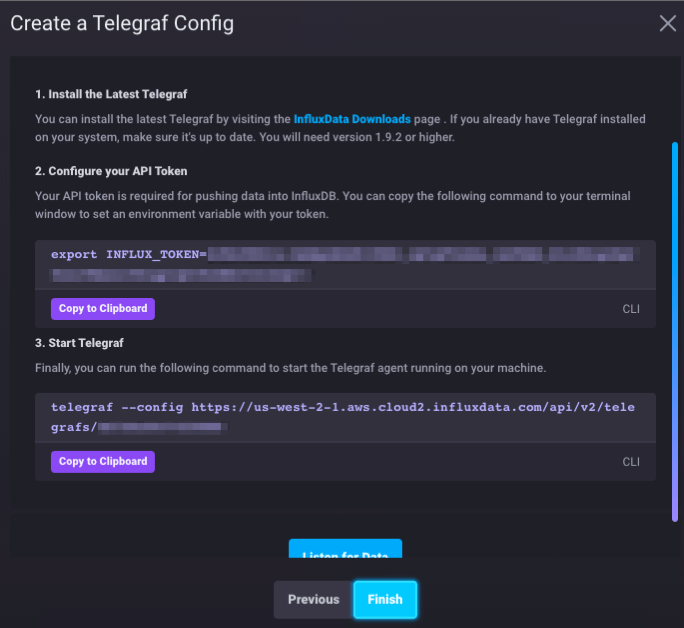
Since we’re running macOS, we’ll use the Homebrew package manager to install Telegraf. (If you’re running a different OS, you can get installation instructions here.)
Install Homebrew if you don’t already have it. In Terminal, type:
/usr/bin/ruby -e "$(curl -fsSL
https://raw.githubusercontent.com/Homebrew/install/master/install)"
(Unsure how to use Terminal? Here’s a tutorial.)
Then install Telegraf:
brew update
brew install telegraf
Then copy/paste the export command in the screenshot above to set your INFLUX_TOKEN system variable. This is unique to your account.
export INFLUX_TOKEN=[your unique API token]You can confirm whether it’s set by typing the env command. I like to pipe it through sort so I can quickly pick out the variable from a long list. So, type this:
env | sortAnd you’ll see INFLUX_TOKEN in your list of environment variables:
![]()
Next, copy/paste the telegraf command, along with your unique connection URL:
telegraf --config https://us-west-2-
1.aws.cloud2.influxdata.com/api/v2/telegrafs/[your_unique_number]
You should see output that looks like this:
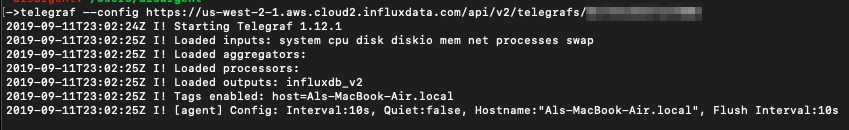
This indicates that Telegraf 1.12.1 was started, and is monitoring various system metrics: CPU, disk, memory, etc.
Head back to your browser and click the blue Listen for Data button:

You should see a success message:
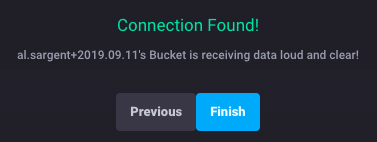
Click the blue Finish button and then the Data Explorer icon on the left side (second from the top):
![]()
Click on the cpu filter, press Submit, and you should see a chart like this:
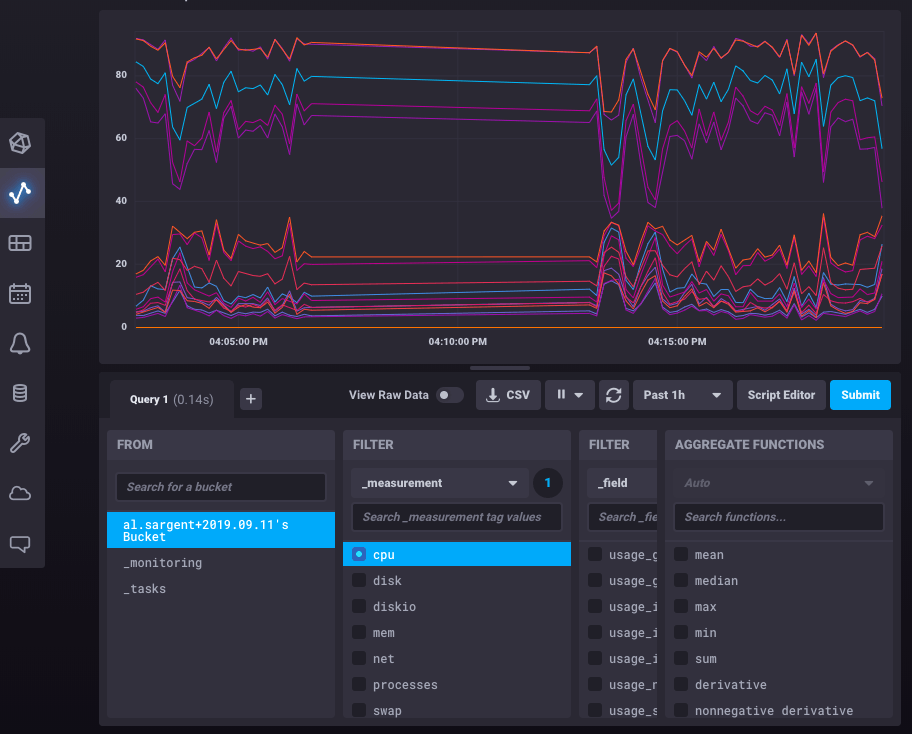
Congratulations! You now have Telegraf sending data to InfluxDB in the cloud. At this point, it’s worth poking around in the UI to see what types of data are available, as well as learning the Flux language to learn how to query the data.
