Getting Started with InfluxDB and Grafana
By
Charles Mahler
updated February 21, 2024
Product
Use Cases
Getting Started
Navigate to:
At some point if you’re working with data, you’ll probably want to be able to visualize it with different types of charts and organize those charts with dashboards. You’ll also need somewhere to store that data so it can be queried efficiently.
One of the most popular combinations for storing and visualizing time series data is Grafana and InfluxDB. InfluxDB serves as the data store and Grafana is then used to pull data from InfluxDB (and potentially other data sources) to create dashboards to visualize the data.
In this article you will learn how to:
-
Install Grafana and InfluxDB using Grafana
-
Connect Grafana to InfluxDB
-
Create your first Flux query
-
Visualize financial data with more advanced queries
InfluxDB overview
InfluxDB is an open source time series database that is optimized for fast and highly available data storage for time series data in use cases like monitoring, application metrics, IoT sensor data, real-time analytics, and more.
Grafana overview
Grafana is an open source data visualization and monitoring platform. It is used to create dashboards and visualize data from a variety of sources like Prometheus or InfluxDB.
Grafana allows users to quickly create visualizations of their data, such as graphs, tables, and heatmaps. It also provides alerting capabilities, allowing users to be notified when certain conditions are met.
Setting up InfluxDB and Grafana
Now let’s get started with installing InfluxDB and Grafana. First you’ll need to make sure you have the following on your computer:
Docker setup
This tutorial will use docker-compose to manage Grafana and InfluxDB. Before running the following script make sure to navigate to the directory where you want the project to be located.
Once you are in the desired folder, run the following script in the command line:
mkdir influxdb-getting-started-with-grafana
cd influxdb-getting-started-with-grafana
cat > ./docker-compose.yml <<EOF
version: "3"

networks:
  monitoring:

services:
  influxdb:
    image: influxdb:2.3.0
    ports:
      - 8086:8086
    networks:
      - monitoring

  grafana:
    image: grafana/grafana:9.0.4
    ports:
      - 3000:3000
    networks:
      - monitoring
EOF
This script will create a docker-compose.yml file which defines the network and images used for InfluxDB and Grafana. To start the containers you just need to run the following command:
docker-compose up -dInfluxDB setup
Setup of credentials required when initiating connection to InfluxDB is as follows.
Create initial super-admin credentials, organization, bucket and the all-access security token. Run the influx setup command:
influx setup --name myinfluxdb2 --host http://localhost:8086 \
  -u admin -p admin54321 -o my-org \
  -b my-bucket -t my-token -r 0 -f
The superuser, organization, bucket, and access token have been created. In addition, the influx command creates a new server configuration object and stores it into the active config named myinfluxdb.
Note: You can define as many configs as you want to work with multiple InfluxDB2 servers easily. The configuration objects are stored locally in the $HOME/.influxdbv2/configs file on your computer. To list all available server configurations use the command influx config ls.
Grafana and InfluxDB connection setup
Add data source in Grafana UI
-
Open in browser http://localhost:3000/datasources
-
Sign in as user
admin, passwordadmin. -
Click on
Skipto skip the question about the new password. -
In the left menu, click on the Gear icon, to open Data Sources.
-
Click on Add data source.
-
Select InfluxDB.
-
Replace InfluxQL with Flux in the dropdown called Query Language.
-
Type
http://influxdb:8086/at the URL field in the section called HTTP. -
Write
my-orginto the Organization field in the InfluxDB Details section. -
Type
my-tokenin the Token field. (Once the save and test button is clicked, the password is hidden and replaced with configured.) -
Save & Test: Success will display two green notifications (3 buckets found + Datasource updated). Please see below.
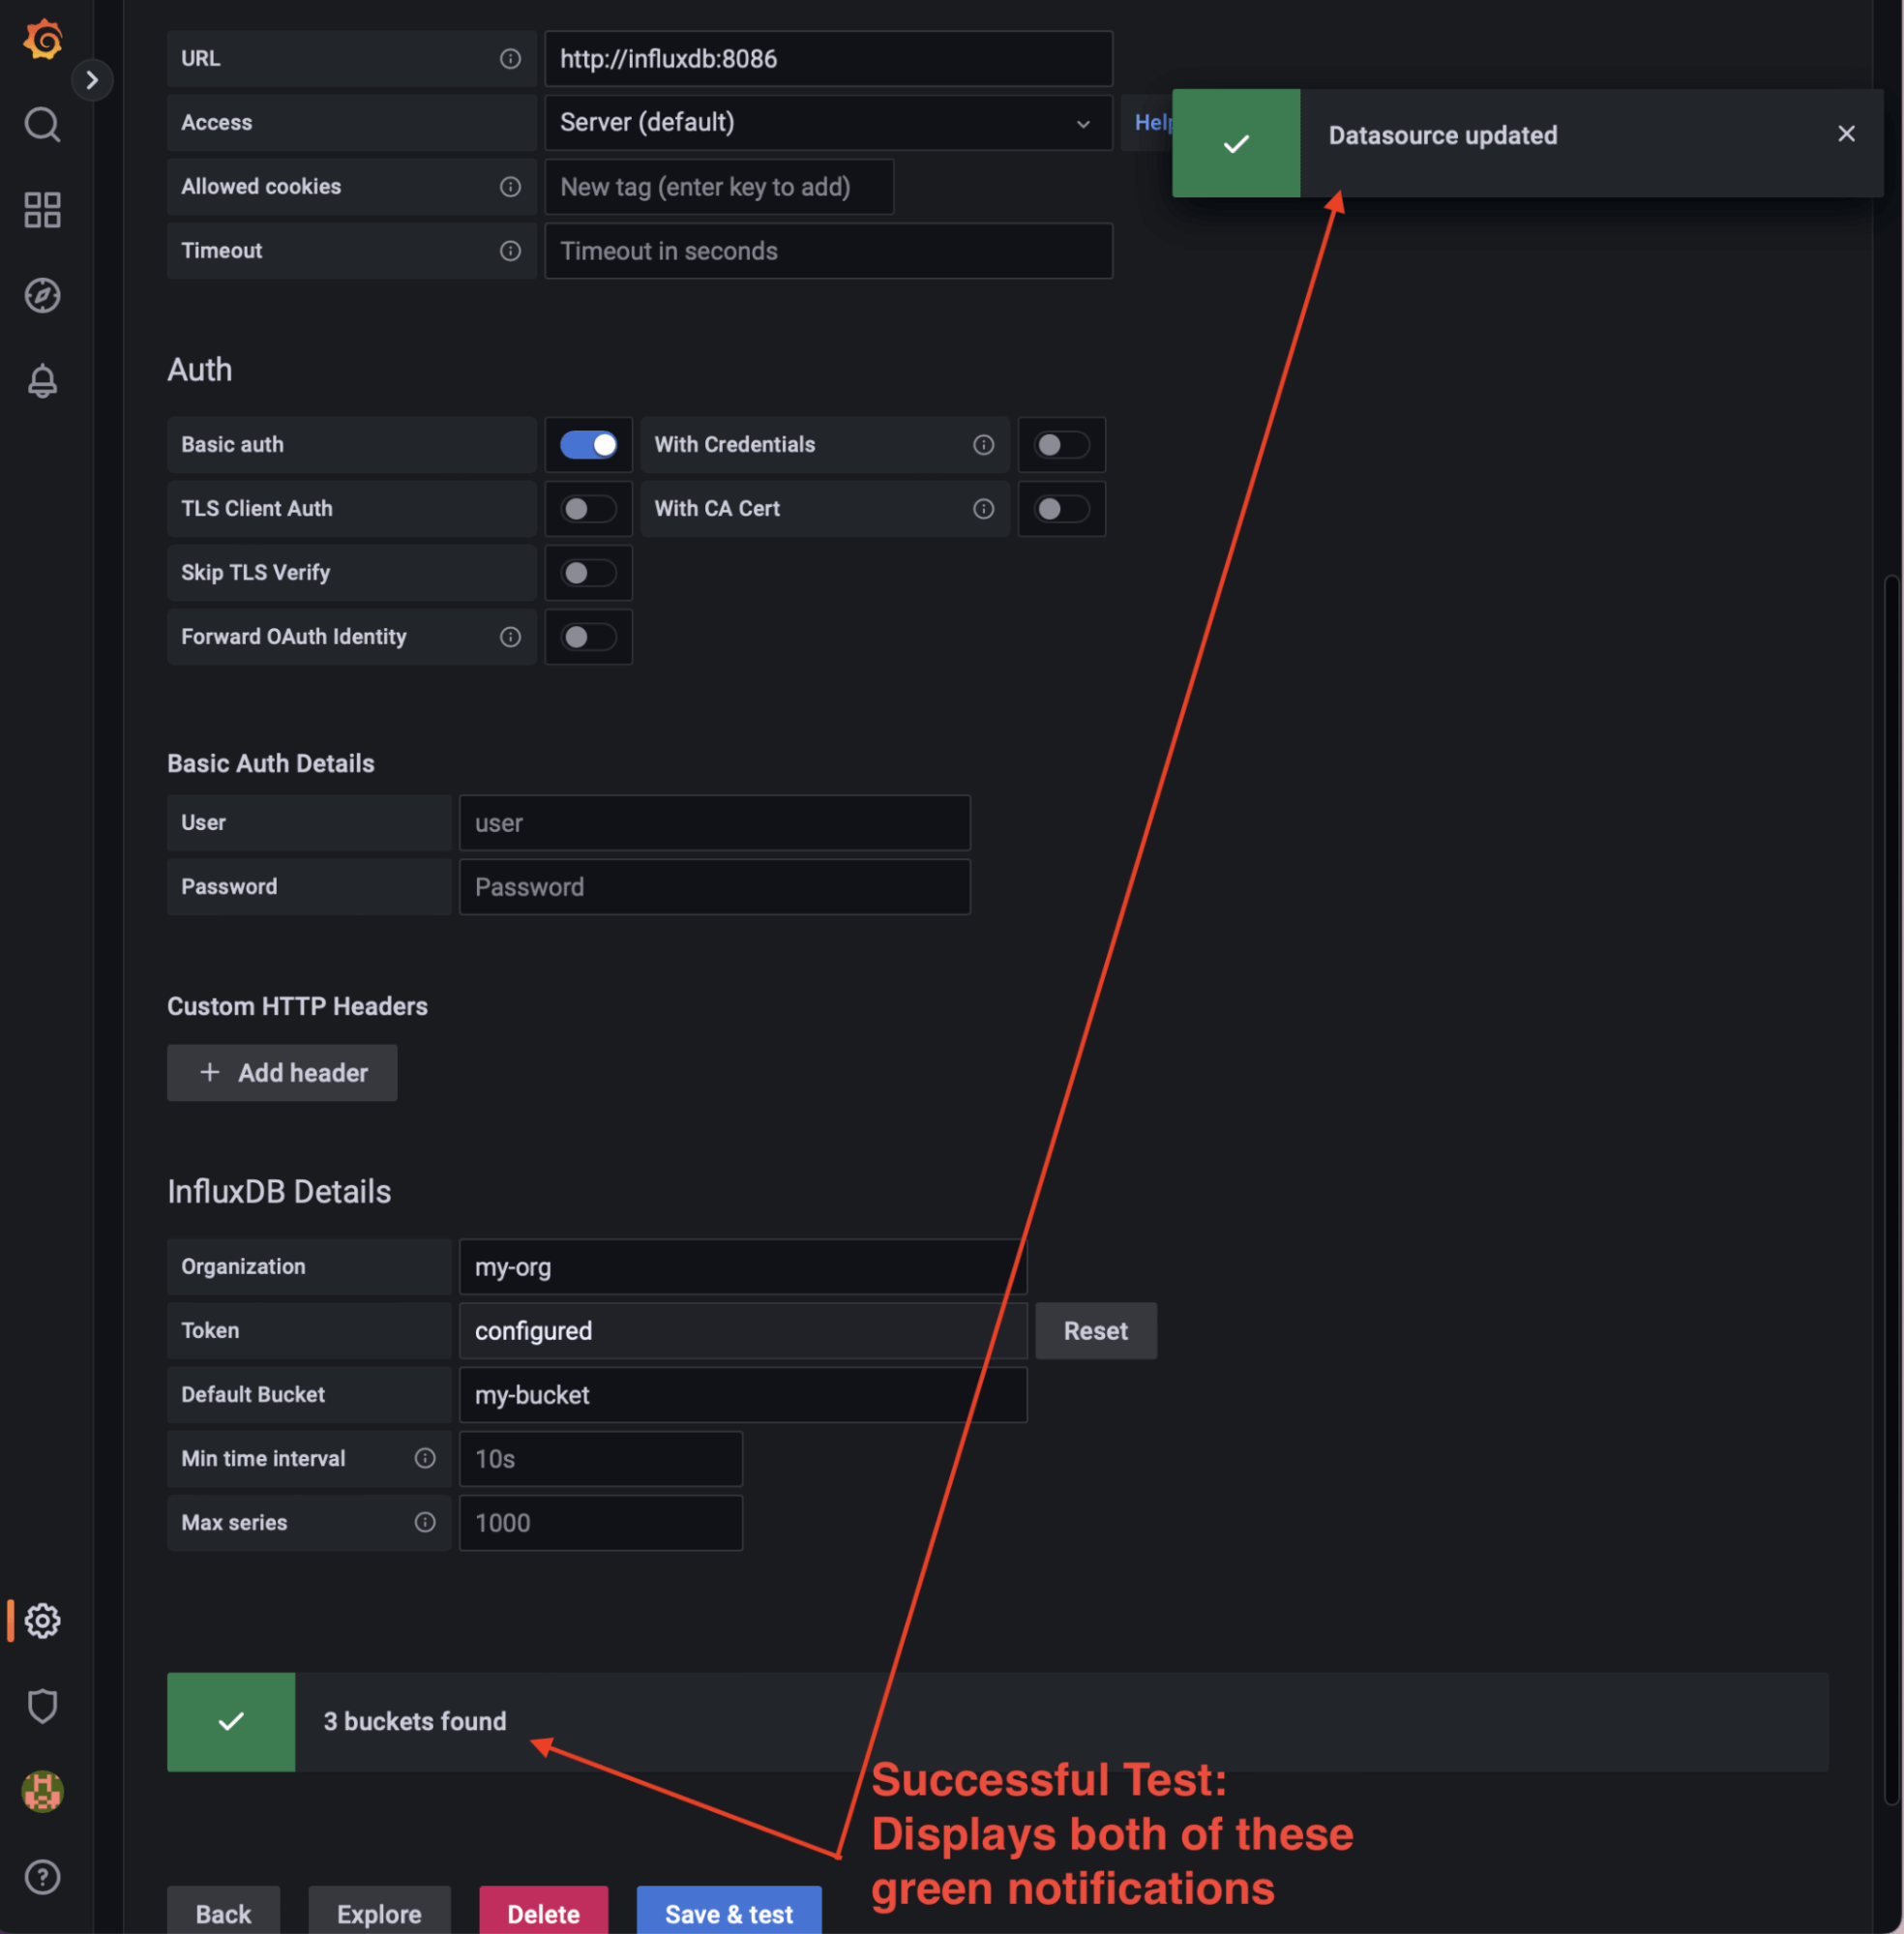
Note: The address http://influxdb:8086/ is the address visible from the Grafana container in the internal network orchestrated by docker-compose.
Your first Flux query from Grafana
(Update: InfluxDB 3.0 moved away from Flux and a built-in task engine. Users can use external tools, like Python-based Quix, to create tasks in InfluxDB 3.0.)
Open Grafana Explorer located in the left menu of Grafana GUI as the Compass icon.
Type the following simple query on line 1 of the Explorer:
buckets()Hit the Run Query button located at the top right corner. The result is the table listing 3 buckets.
The buckets _monitoring and _tasks are internal InfluxDB buckets. The bucket is called my-bucket, which was created with the influx setup command run earlier.
InfluxDB is also running at http://localhost:8086. You can login to the InfluxDB UI with the following credentials:
-
User: admin
-
Password: admin54321
Doing more with Flux and Grafana
In this section you will learn more about how to use Flux and how to create more advanced visualizations using Grafana Dashboards.
Focus points:
-
Importing the CSV file of financial data into InfluxDB
-
Usage of simple Flux queries to extract time series
-
Data visualization in the candlestick chart saved as a Panel in Grafana Dashboard
The data represents a historical time series of daily stock prices from selected companies, with a time range between the years 2010 and 2016.
The following figure shows the head of the CSV, to preview how the spreadsheet looks:
The data set is a 50MB file, containing daily values which are all double precision numbers, for __open, low, high and close__prices and traded volume, of 502 companies between the years 2010 and 2016.
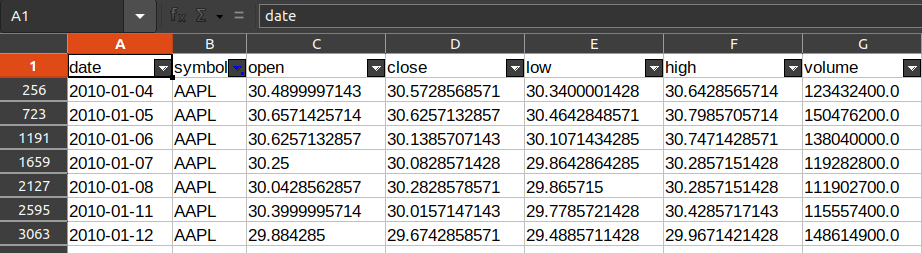
To analyze this size of data in a spreadsheet processor is a tedious process.
Import data into InfluxDB
First you will need to download the financial data CSV onto your computer. Open your terminal and navigate to the folder where the CSV file has been downloaded. Before using influx CLI, make sure you are working with the correct active configuration.
Use the following command to see the available configurations:
influx config lsThe output should produce a line with the config from InfluxDB setup:
Active  Name         URL                       Org
*       myinfluxdb2  http://localhost:8086     my-org
Note: The asterisk signifies a config is active, and this means the –host and –org arguments don’t need repeated entry on CLI each time the influx command is used.
Import CSV data into InfluxDB
Run this influx CLI Data Import & Annotation CMD:
influx write -b my-bucket -f ./stock-prices-example.csv \
  --header "#constant measurement,stocks" \
  --header "#datatype dateTime:2006-01-02,tag,double,double,double,double,double"
Note: This influx write command takes roughly around 12-15 seconds to complete. To print the run time duration in the results printout of importing the data, add this “dry run” script to the query: time influx write -b my-bucket
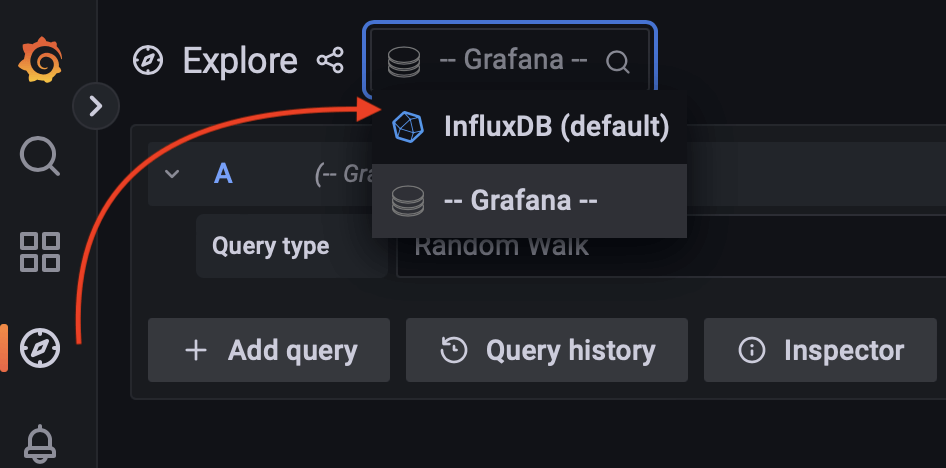
Visualize time series data in Grafana Explorer
To get started with creating your dashboard, choose InfluxDB as your data source using the dropdown selector:
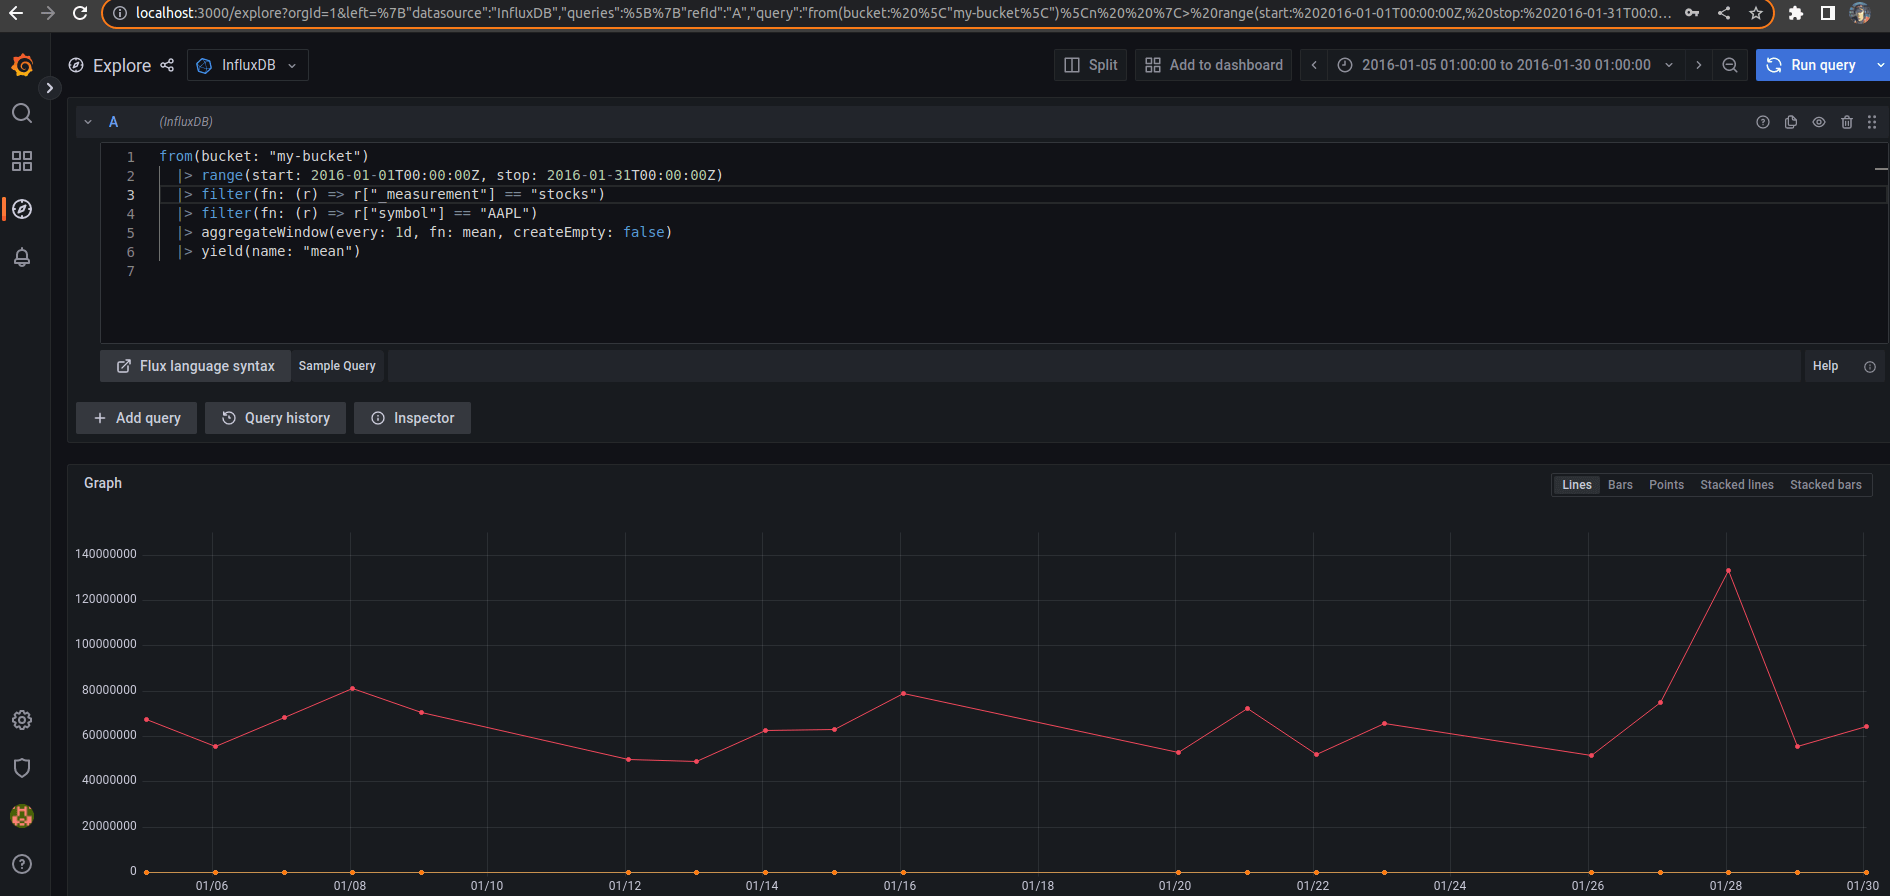
Query and visualizing
Run the following Flux query
from(bucket: "my-bucket")
  |> range(start: 2016-01-01T00:00:00Z, stop: 2016-01-31T00:00:00Z)
  |> filter(fn: (r) => r["_measurement"] == "stocks")
  |> filter(fn: (r) => r["symbol"] == "AAPL")
  |> aggregateWindow(every: 1d, fn: mean, createEmpty: false)
  |> yield(name: "mean")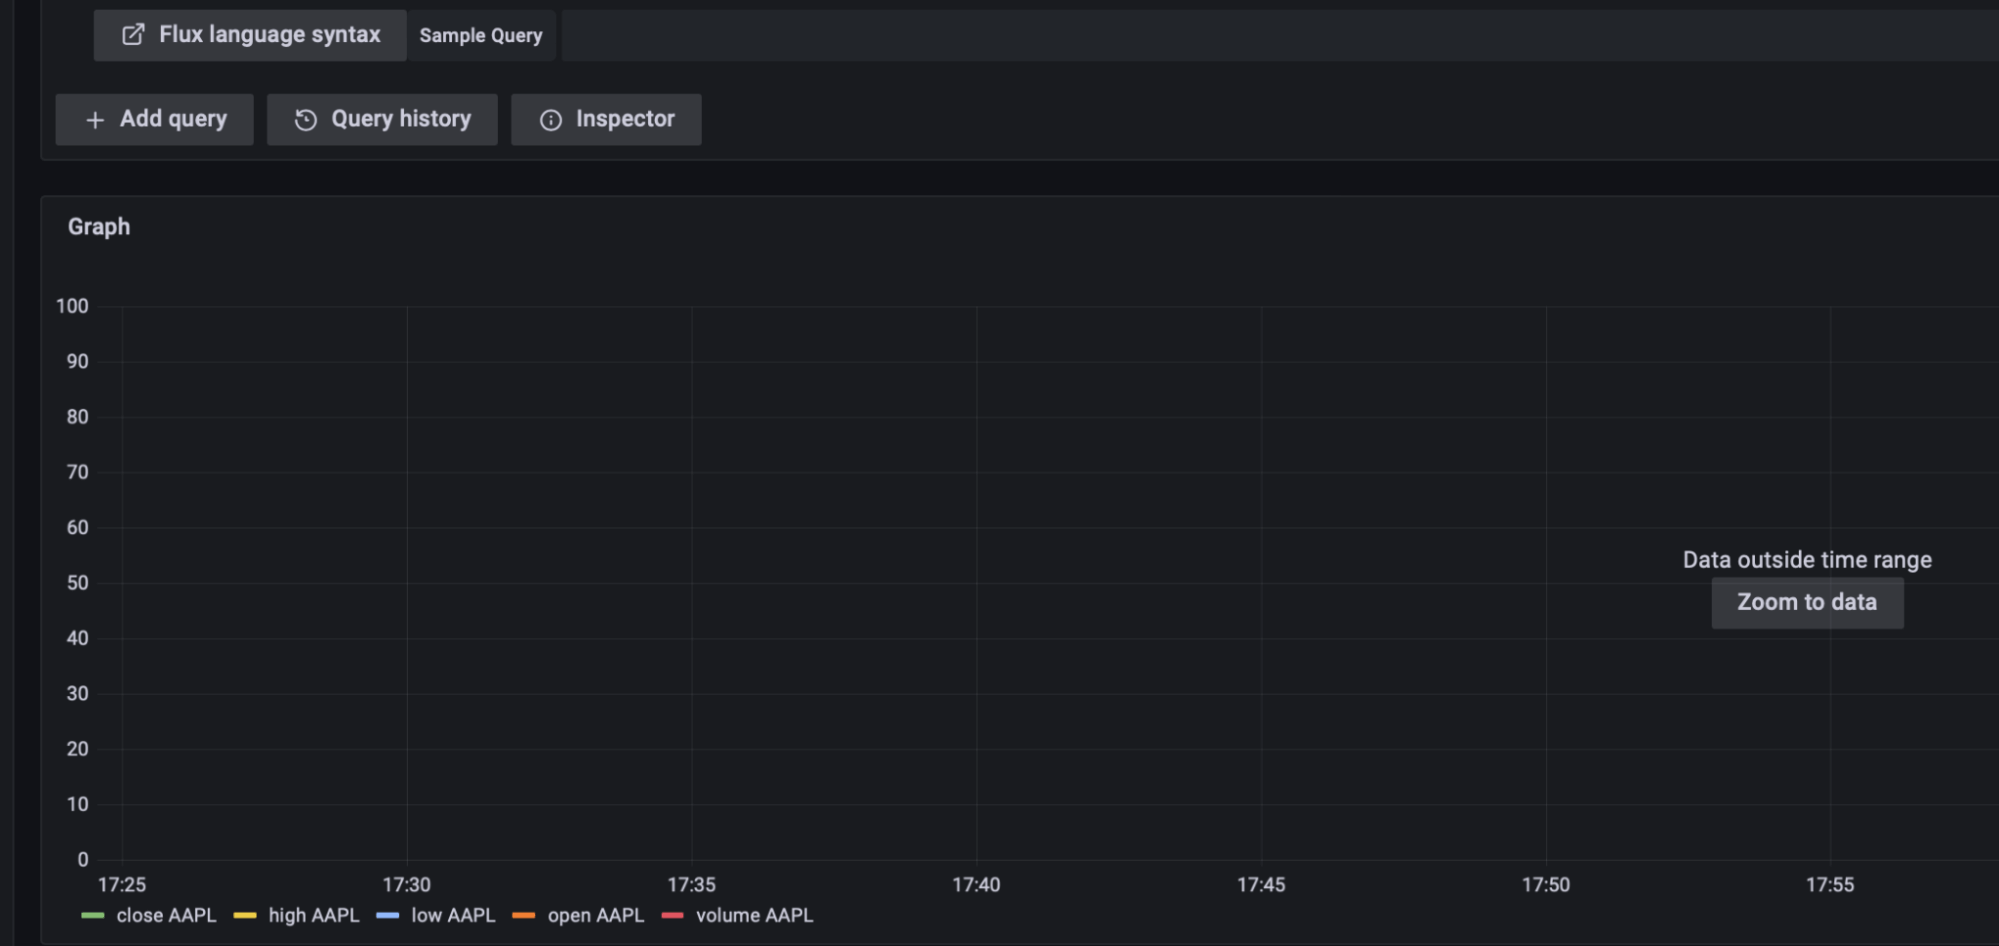
The graph area is still empty because the result is out of data range. Click on the Zoom to data button to see the AAPL raw data in the right time range, January 2016.
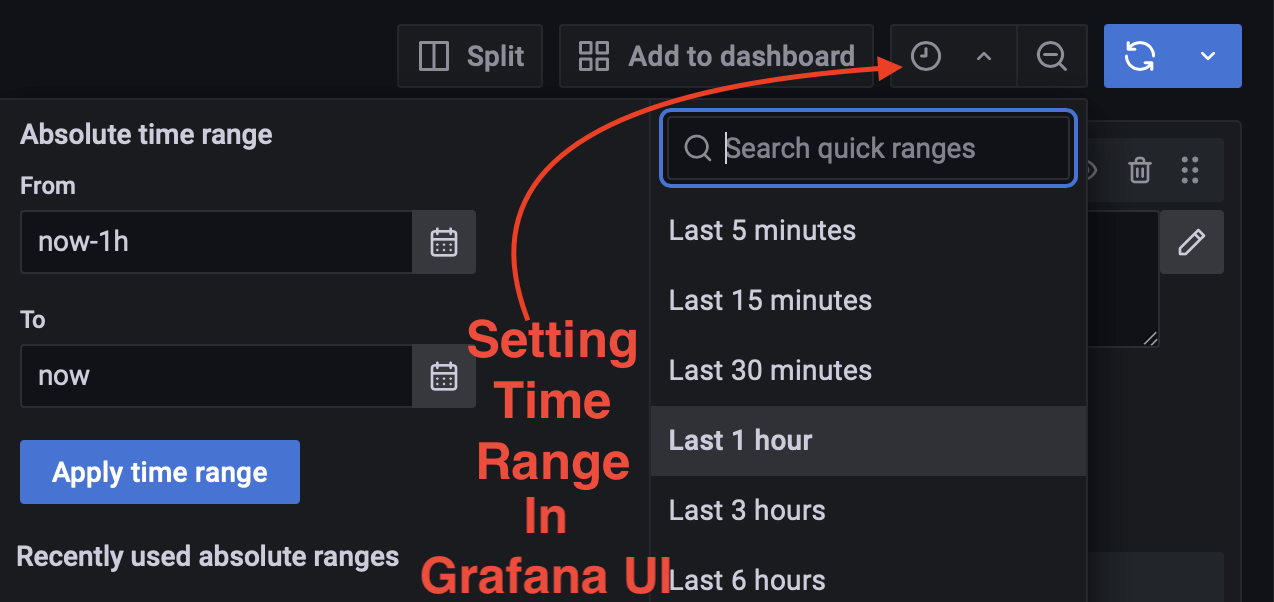
Note: Adapting time frame of queries to user needs is streamlined in the Grafana UI. Making an adjustment to data time range in Grafana UI is interactive and simple to adjust (see figure below).
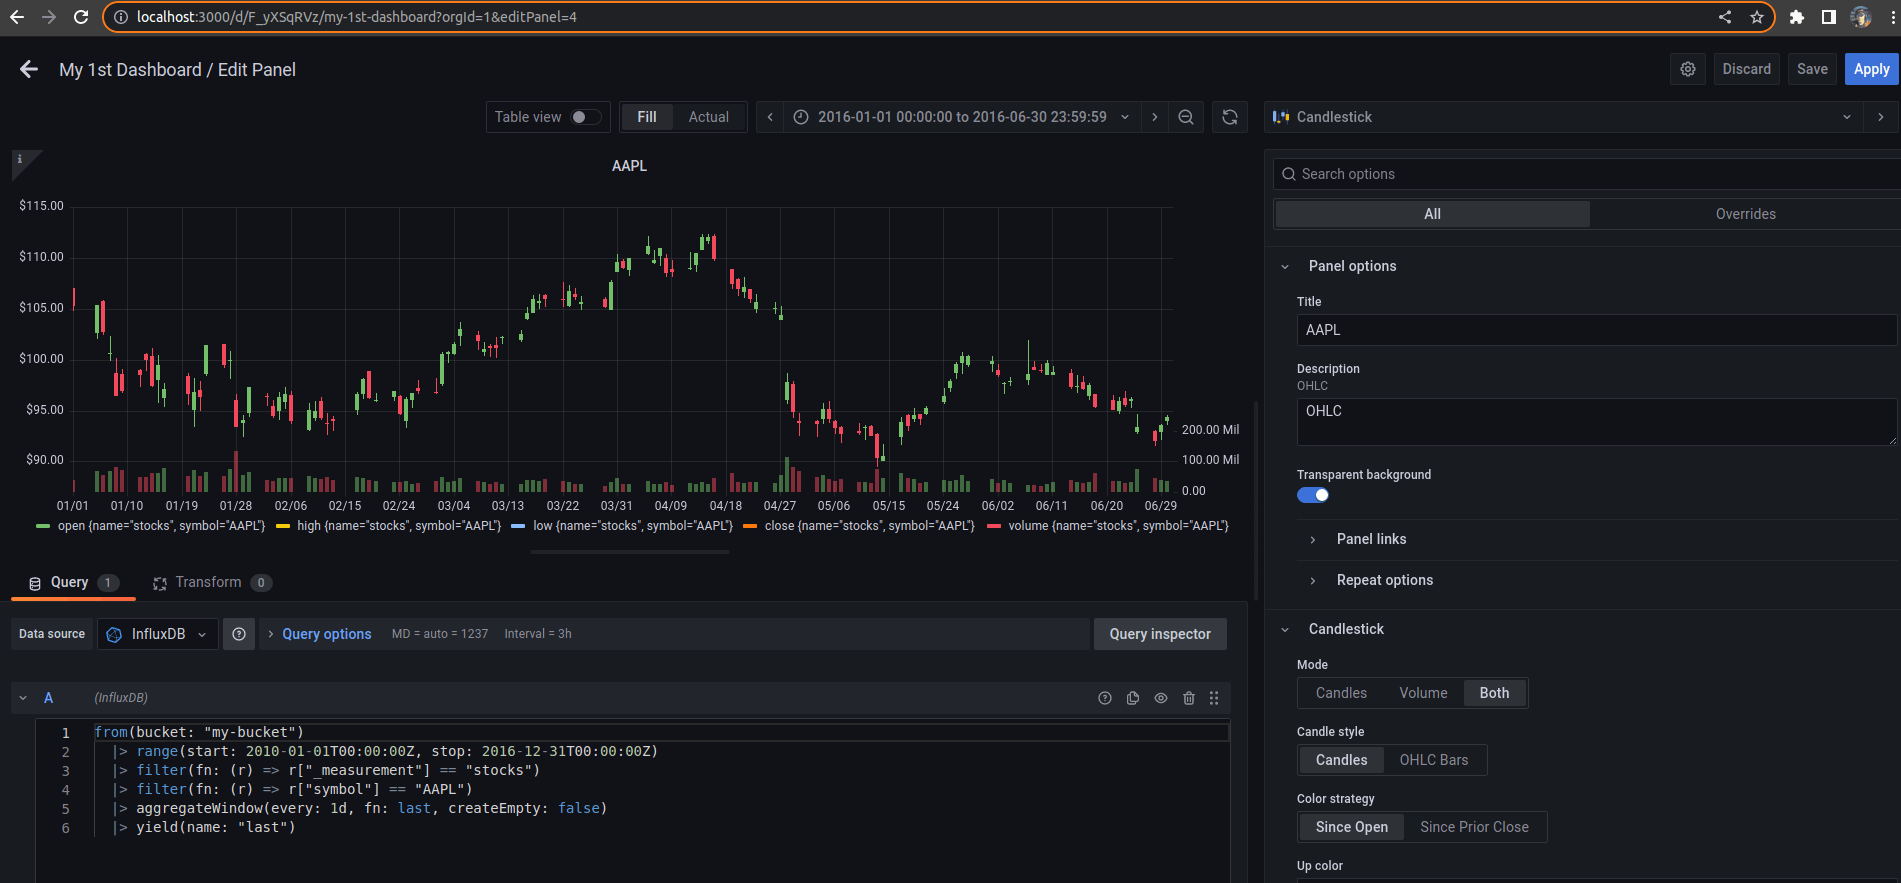
Create your first Grafana dashboard
Click on the Add to Dashboard button located at the top of the page.
Message box with options appears. Select New Dashboard and open the Grafana Dashboard in a New Window not to lose the Explorer tab.
After the new browser tab opens:
-
Type
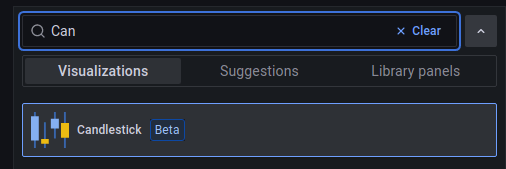
eon your keyboard, wait a few seconds, and the edit mode of the Panel will appear on the page. -
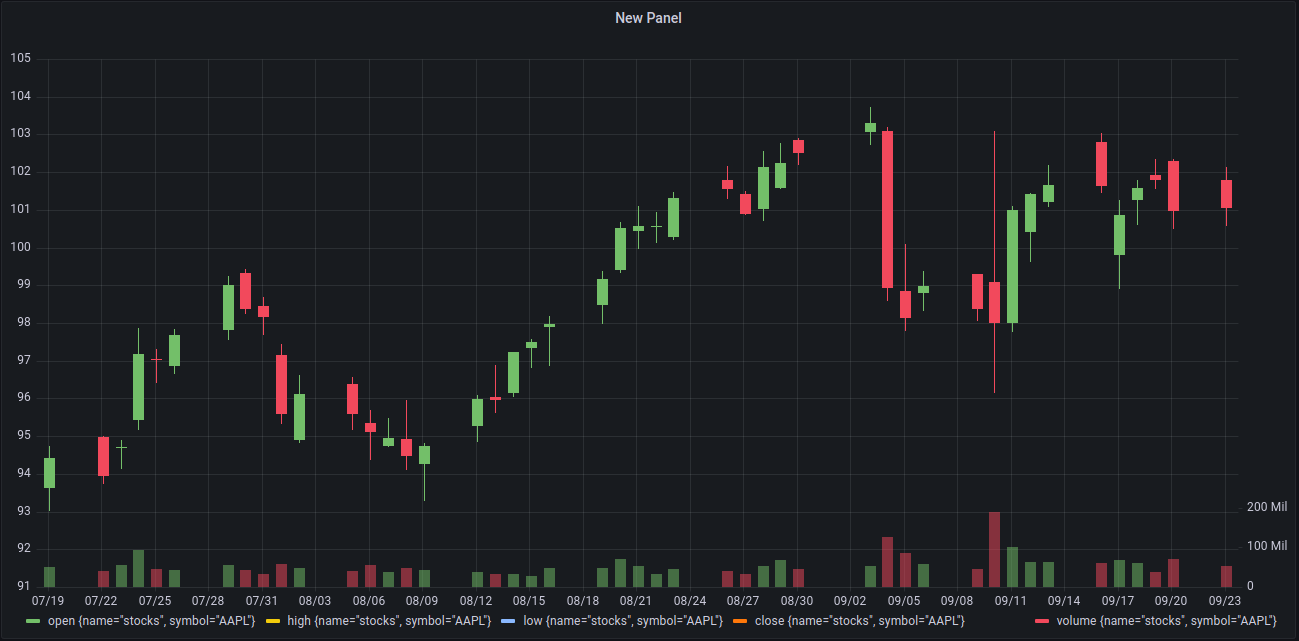
Select Candlestick type on the right side.
Then:
-
Modify the previous Flux command, and extend the time range on line 2 from
2010-01-01to2016-12-31. -
Click the Apply button.
To zoom out, you can use the magnifying glass button with a minus sign in the Grafana toolbar. The keyboard shortcut is Ctrl+Z.
To zoom in, select a bigger time range with your mouse or just use the time range selector (dropdown control).
Enter edit mode and try out other possibilities. Enjoy your new dashboard.
Doing more with Grafana dashboards and Flux
Using Flux with Grafana provides a number of options and functionality that aren’t possible using other query languages, such as joining data from multiple sources and doing advanced manipulation and transformation of your data before returning the query.
-
Joins - create graphs that span multiple buckets. For example, you might want a Grafana chart that displays both bytes transferred and requests per second; Flux allows you to query these two measurements and join them into a single table.
-
Multiple data sources - enrich time series data with metadata from relational databases such as MySQL, MariaDB, Postgres, Microsoft SQL Server, Snowflake, SQLite, AWS Athena, and Google BigTable; or from CSV files. This is useful when, for example, your time series data includes customer number fields but not customer names. Flux allows you to pull in the customer name so that it can be displayed in your Grafana dashboards.
Some additional Flux features you might find useful:
Additional resource on using InfluxDB and Grafana: How to Integrate Grafana with Home Assistant
