Getting Started with InfluxDB 2.0: Scraping Metrics, Running Telegraf, Querying Data, and Writing Data
By
Sonia Gupta
updated December 14, 2025
Product
Use Cases
Developer
Getting Started
Navigate to:
Now that we’ve released InfluxDB 2.0 Alpha, you’re probably curious to try it but might not know where to start. This post will guide you through the process of getting it running locally on your machine. By the end of this post you’ll have a good idea of some of the new features that distinguish 2.0 from 1.x, and you’ll be able to load data and navigate the UI with ease.
Scraping metrics with InfluxDB 2.0
First, navigate to the Getting Started docs and follow the instructions to either download the Alpha or run a Docker container with the Alpha. You can run 2.0 natively on Linux or Mac, but if you’re on Windows you will need to use the Docker container. To run the Docker container, you will need to have Docker installed on your machine. For the purposes of this tutorial I have opted to download the Alpha and run it natively.
Once you’ve got InfluxDB running, either by running the influxd command or running the Docker container, navigate to http://localhost:9999 and you should be greeted with this page:

Clicking “Get Started” will take you to this page:
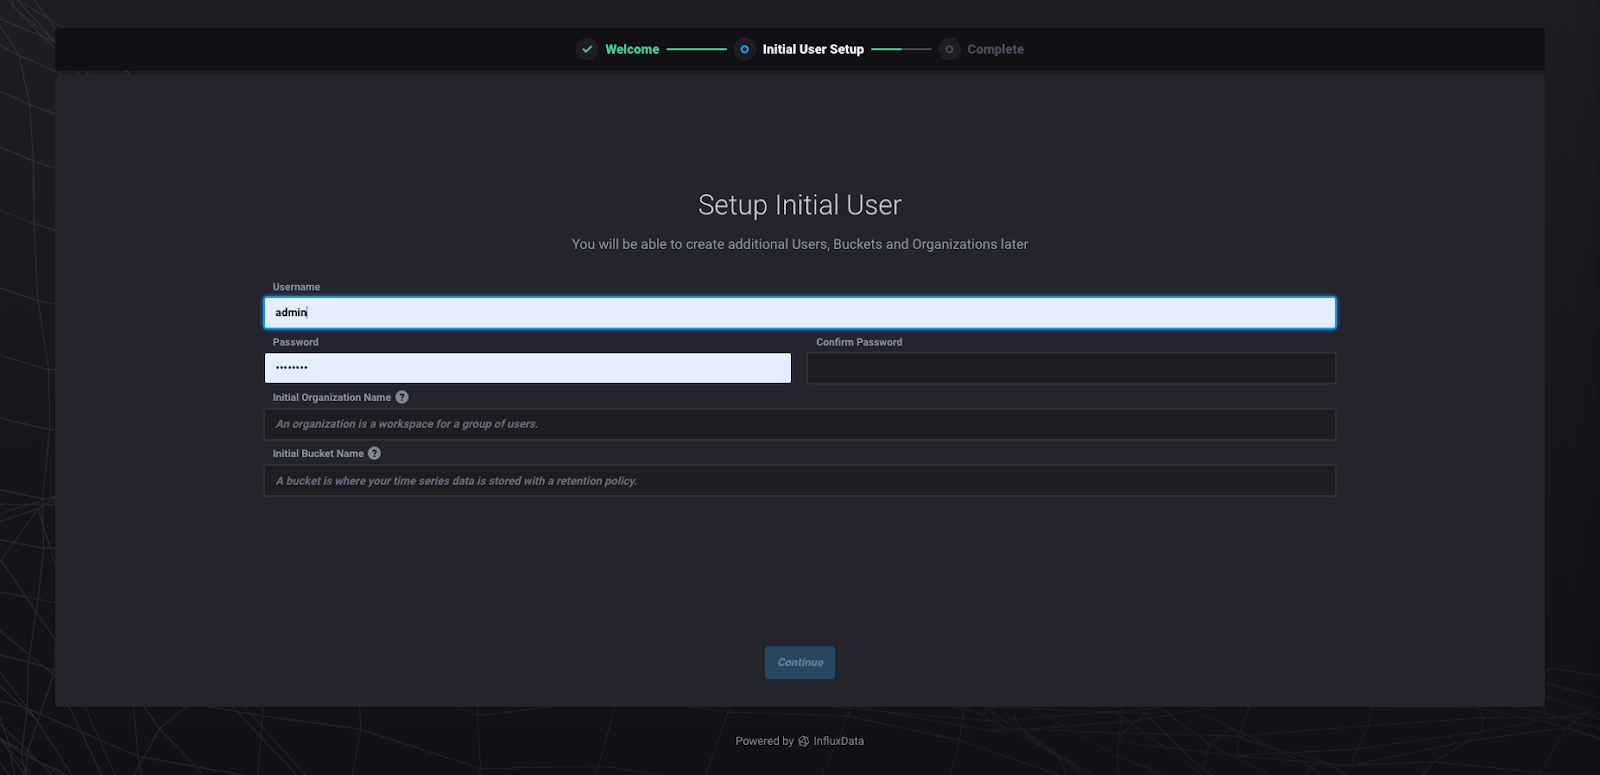
I recommend naming your organization “InfluxData” so that you can follow along with what I’m going to show you. Organizations are an umbrella under which your data and queries are organized in 2.0. A bucket is the equivalent of a database. You can choose whatever bucket name, username, and password you like. Clicking “Continue” will take you to this page:
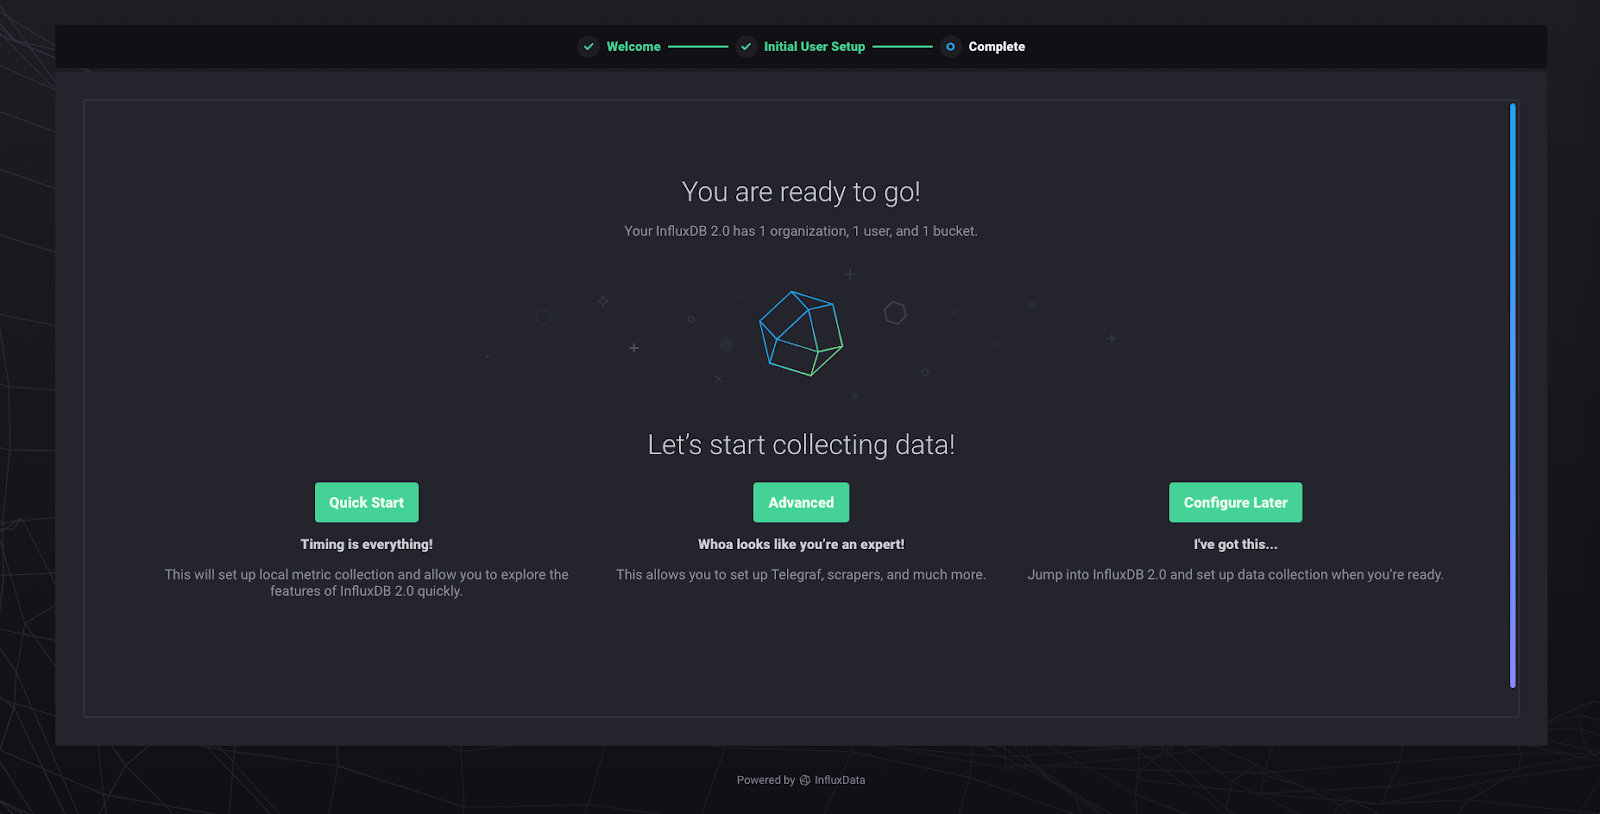
The “Quick Start” option configures a data scraper. The data scraper will pull metrics from your local instance of InfluxDB 2.0. It’s the fastest way to get up and running with some data to play with. “Advanced” brings you to the Telegraf agent config area. “Configure Later” brings you to the homepage, without anything created. Click “Quick Start” and you will be taken to the following page:
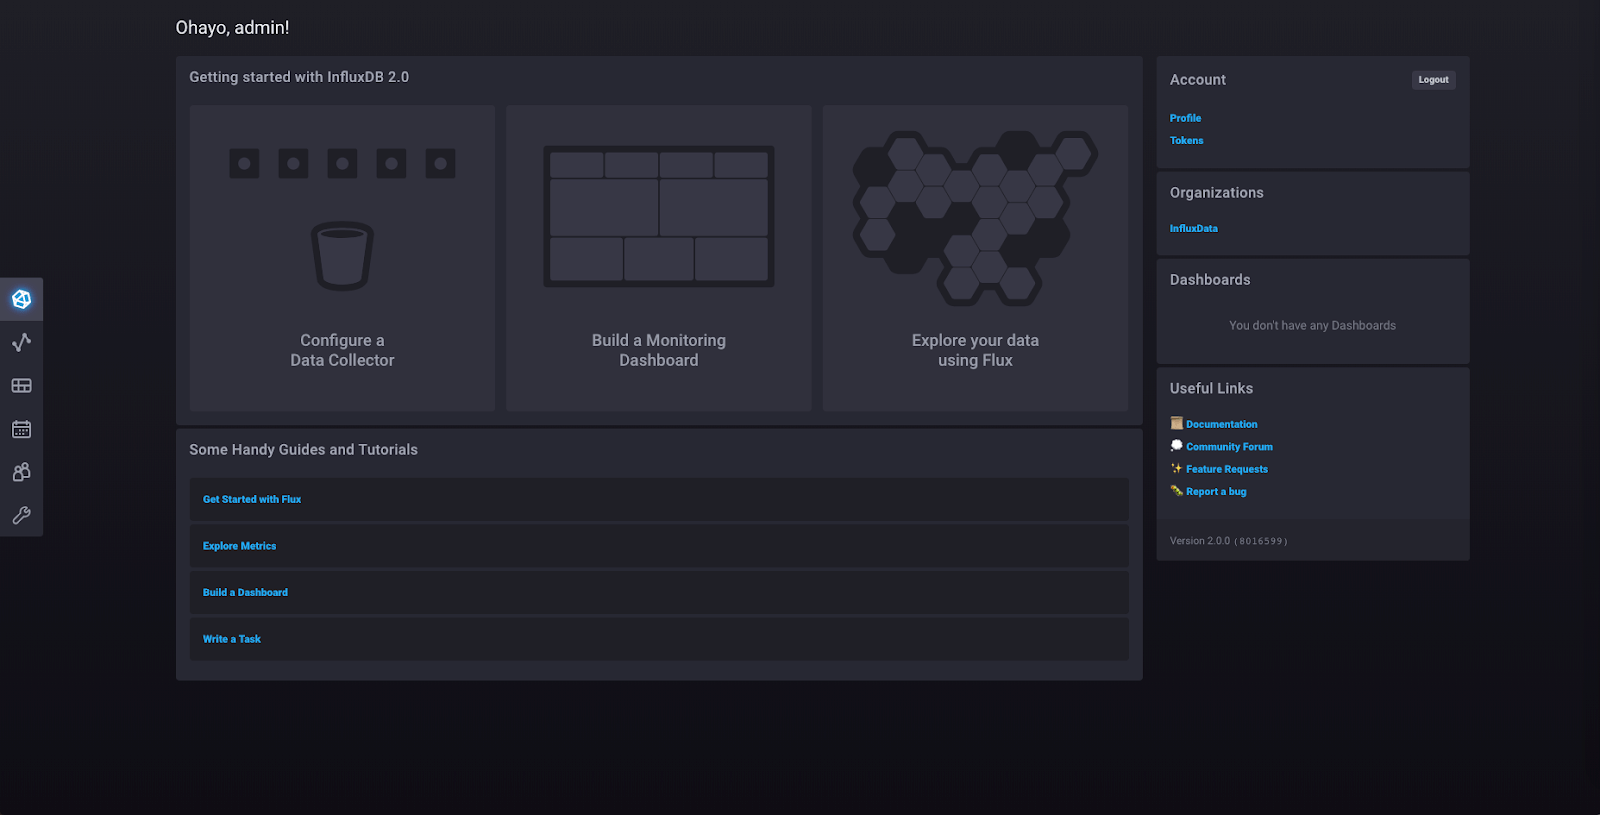
This is the homepage from which you can access every part of your InfluxDB 2.0 instance. You can access your organizations, dashboards, and documentation from here.
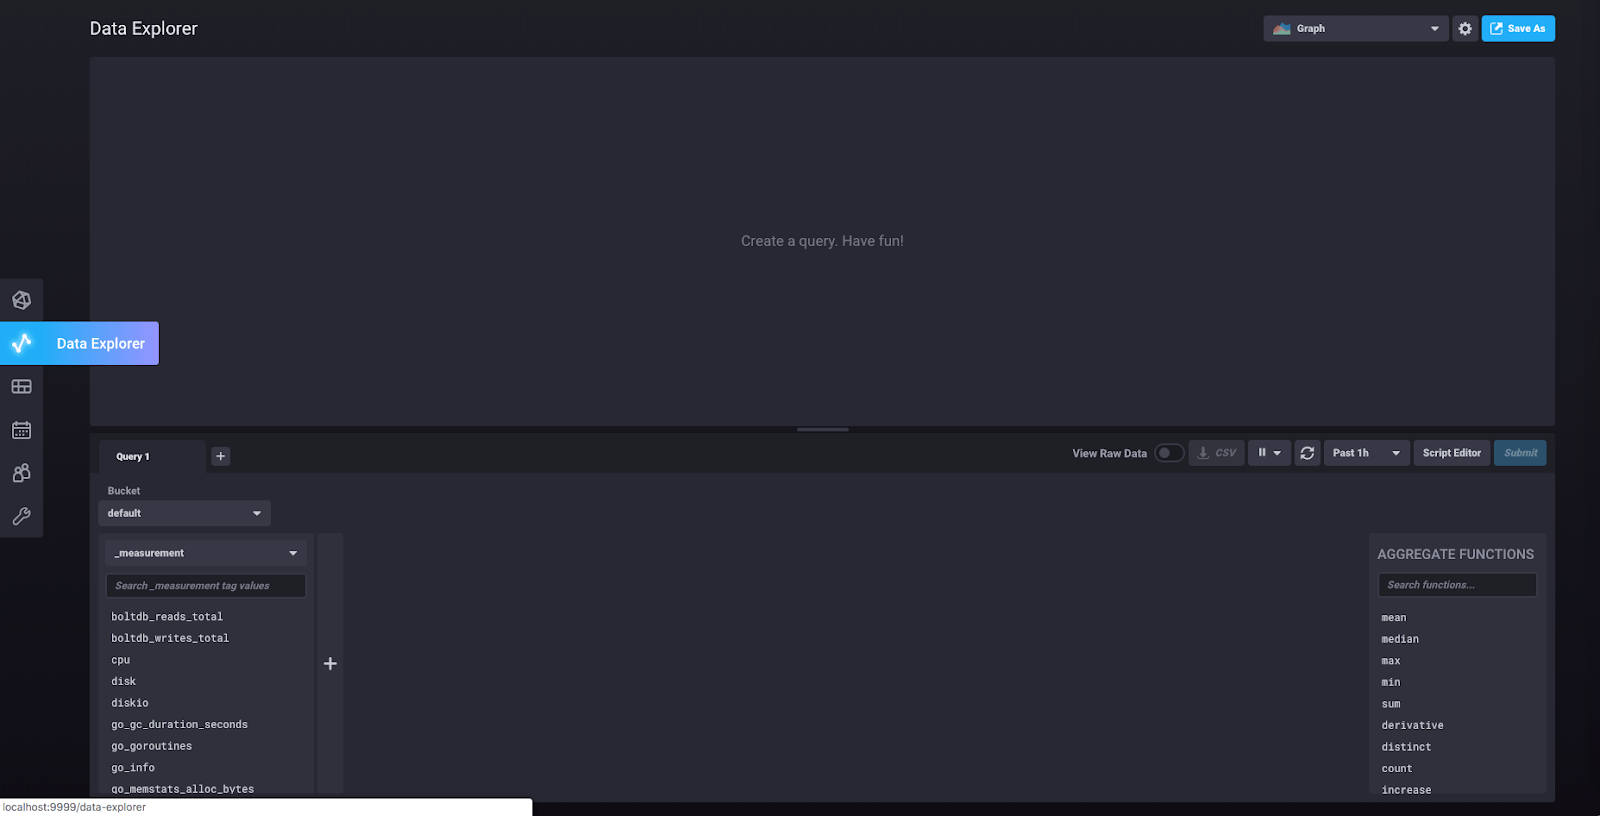
Click “Data Explorer” in the left sidebar, and you’ll be taken to this view:
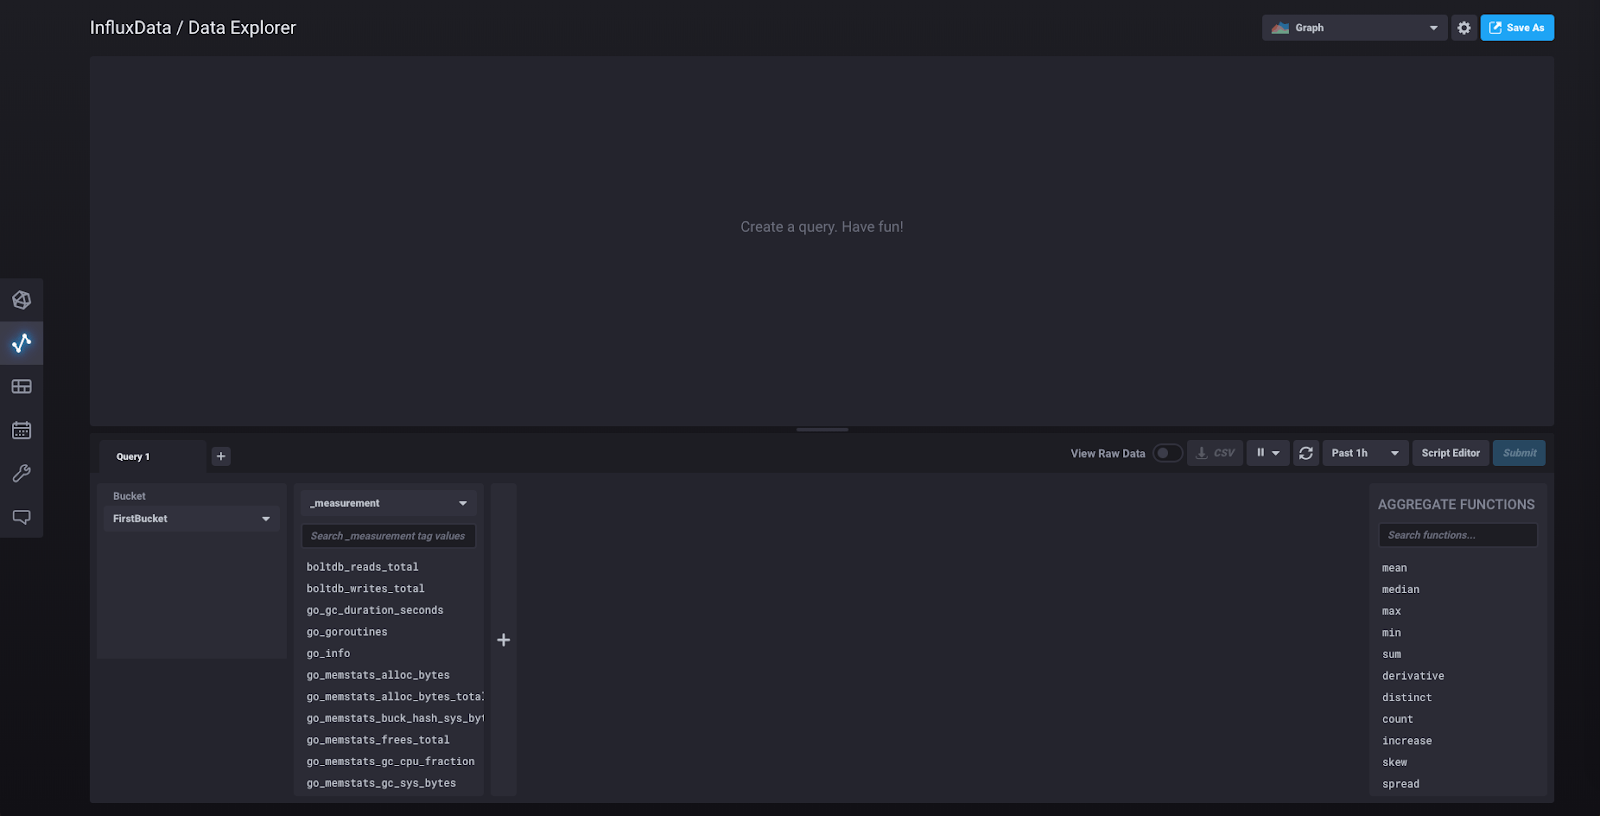
What you’re seeing in the second column on the bottom half are the measurements for the data collected from the scraper that was automatically initialized when you clicked “Quick Start.” That scraper collects data about the InfluxDB 2.0 instance by pulling metrics from localhost:9999/metrics, which you can visit to see those metrics in Prometheus data format.
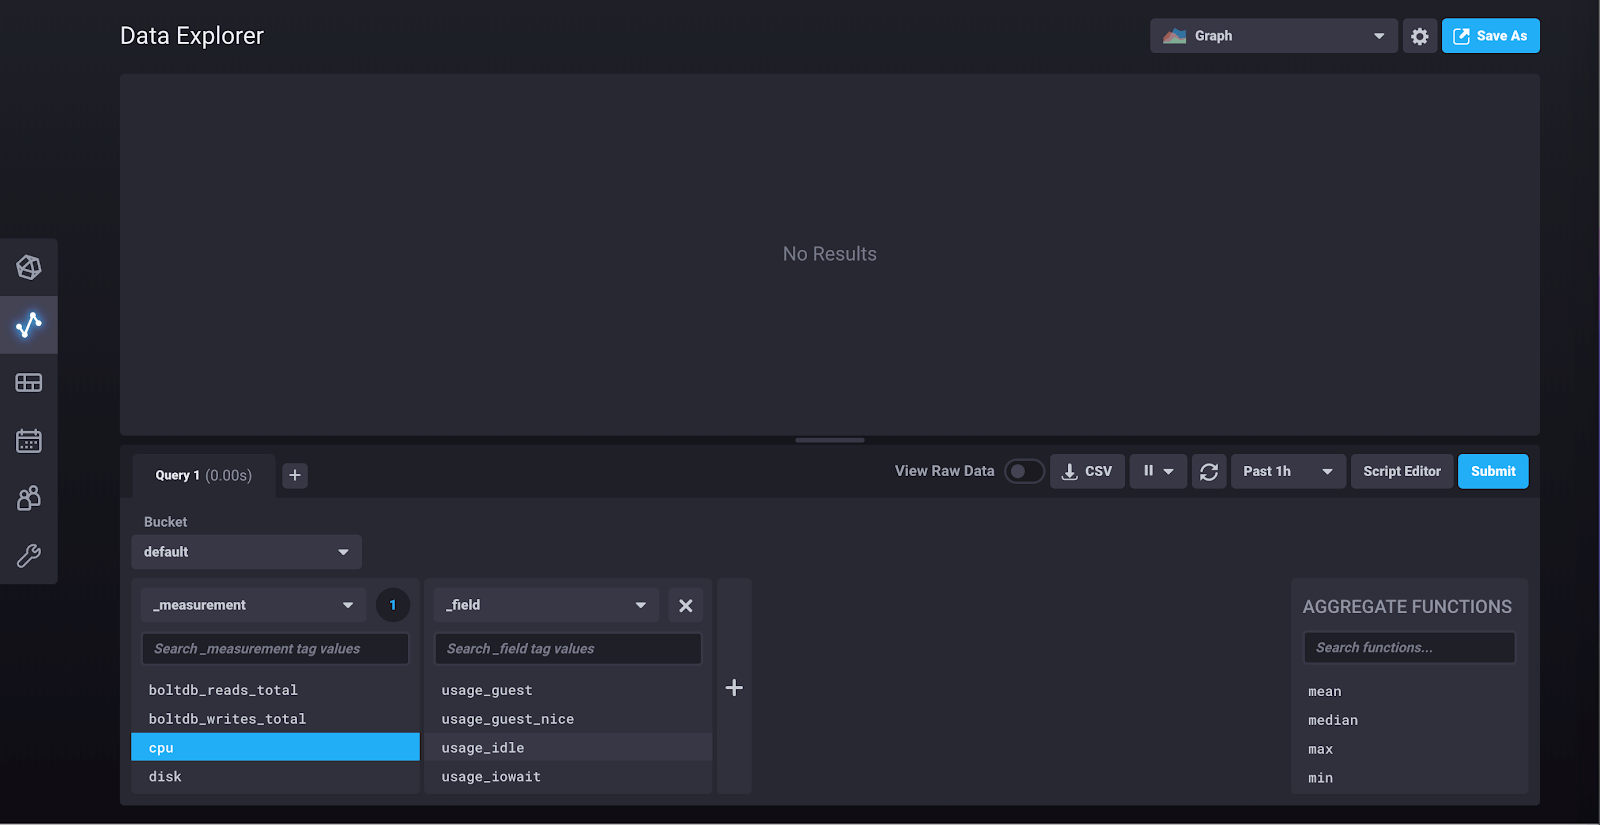
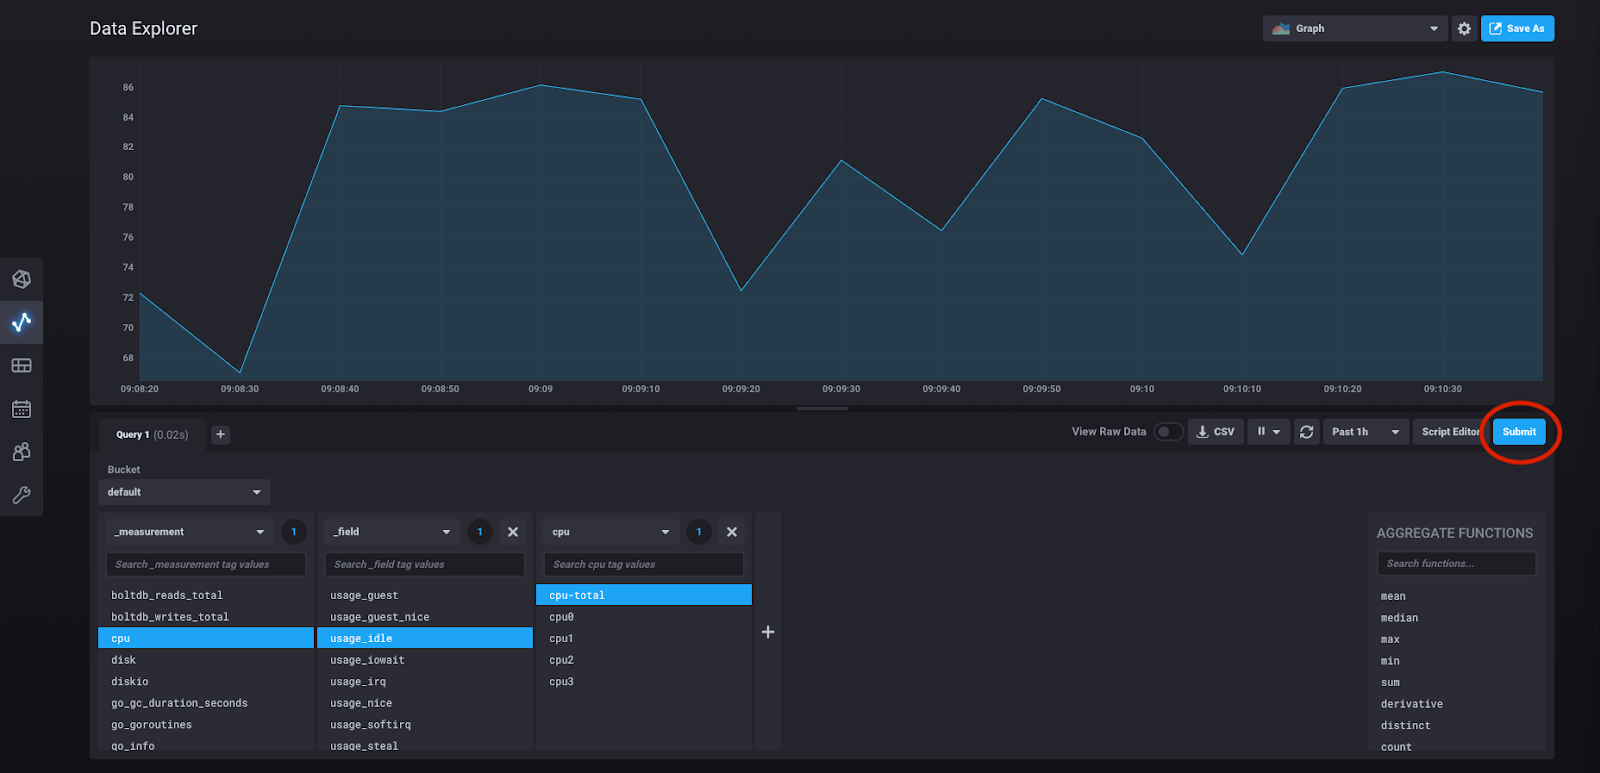
We’re just going to pick an arbitrary data series. Click “boltdb_reads_total” which will open a block for the fields associated with that measurement. Under the “_field” heading, click “counter,” then click “Submit:”
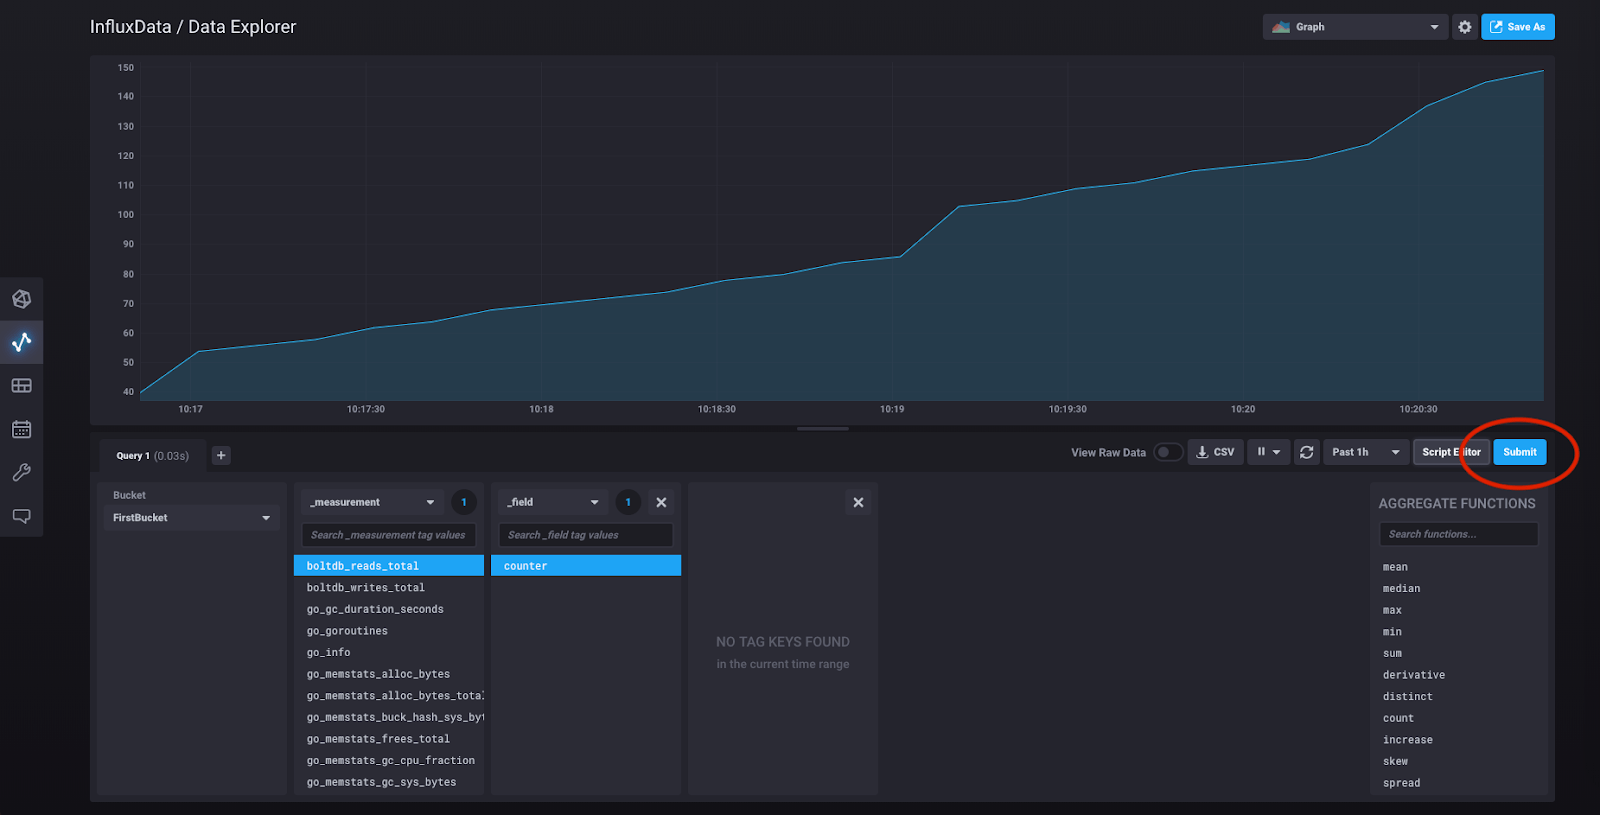
Congratulations! You have just constructed your first query using the query builder, and what you’re now seeing is a visualization of that query result.
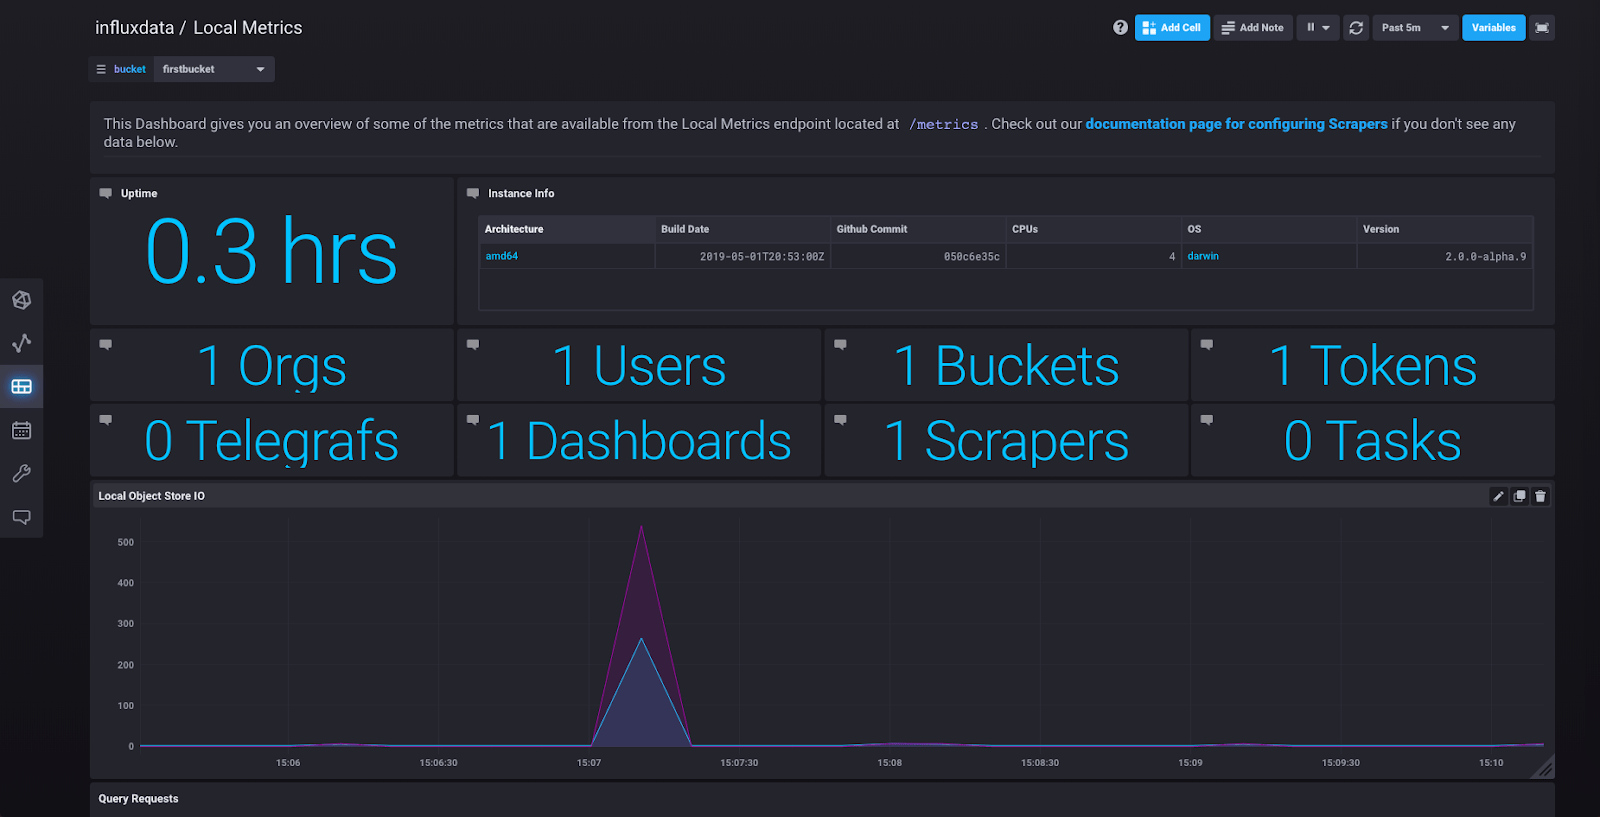
But if you want to see an even better series of visualizations, click on “Dashboards” in the sidebar and you’ll see “Local Metrics,” a predefined dashboard created from the metrics being collected by the scraper. Click on it and you should see something like this:
Running Telegraf with InfluxDB 2.0
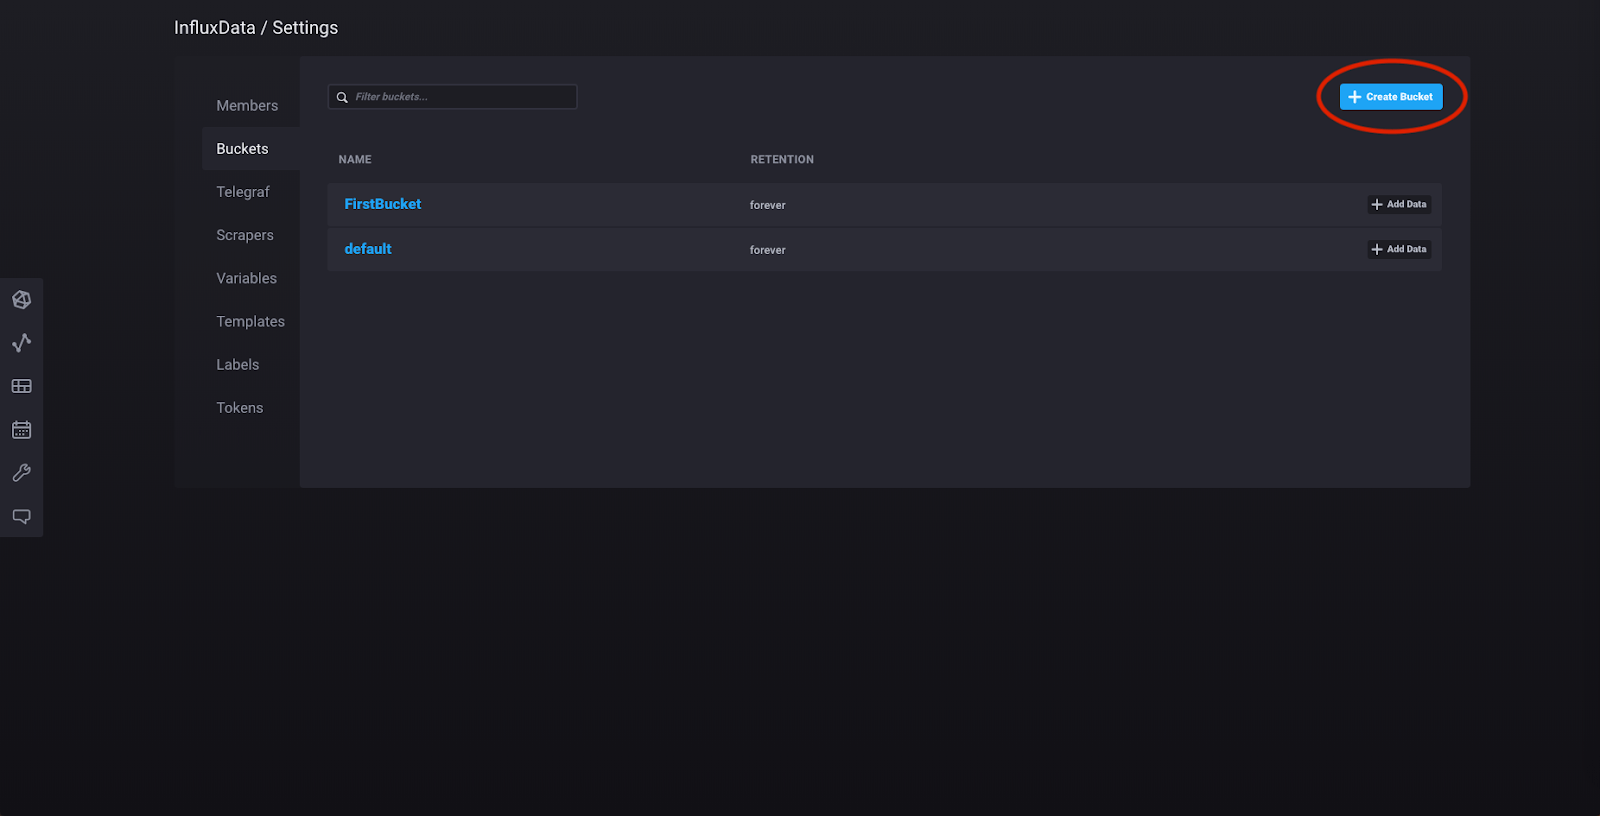
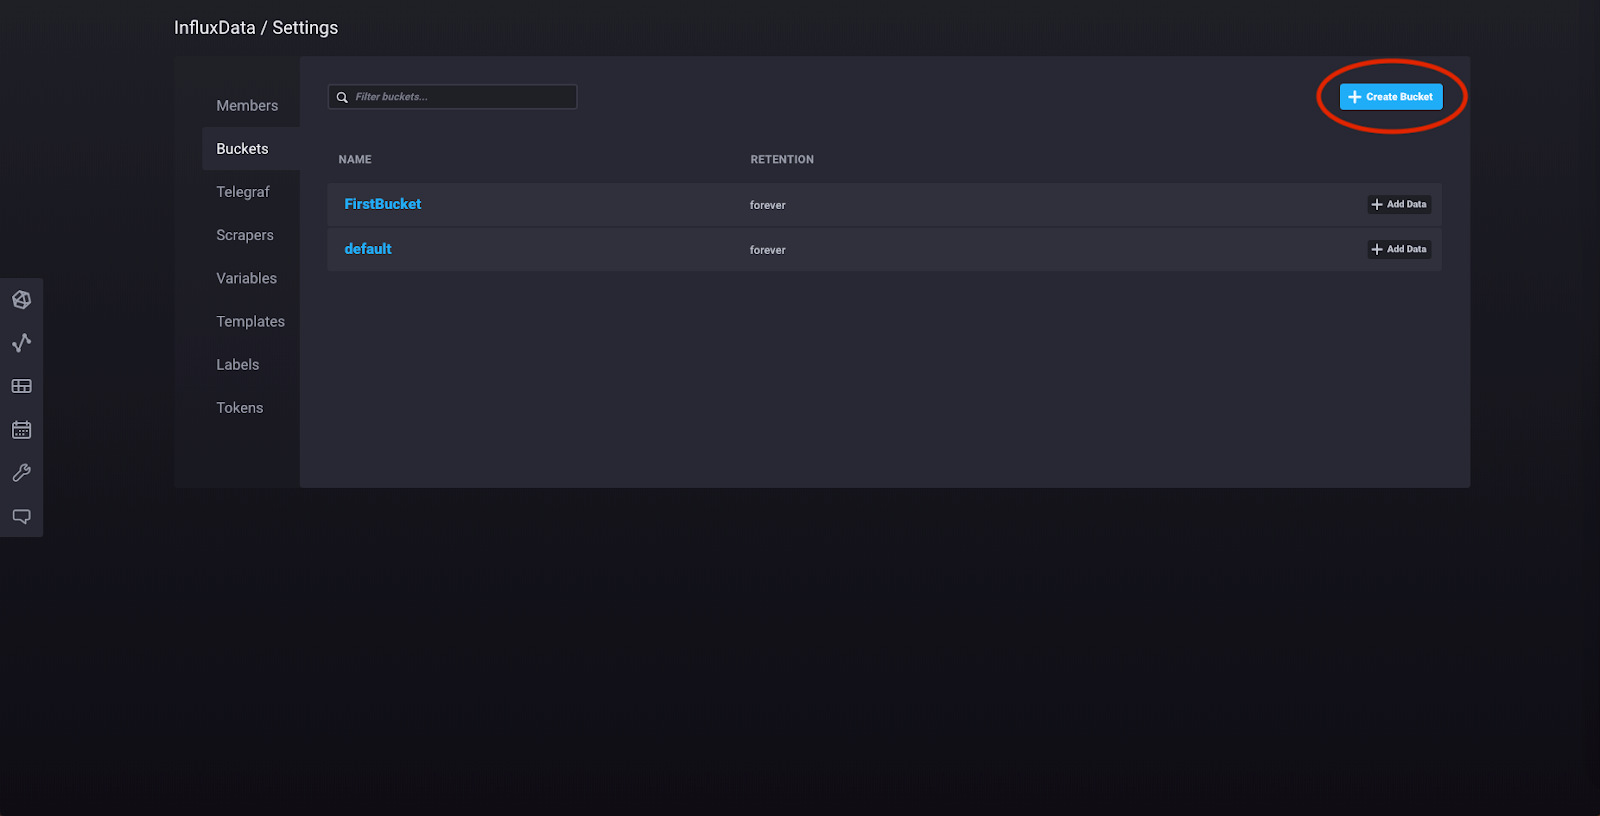
Now we’re going to create a bucket, set up the Telegraf agent, and view dashboards displaying data collected by the agent. Click “Settings” in the left sidebar and click “Buckets.” Then click “Create Bucket” and make a new bucket which will store all the time series data collected by the Telegraf agent:
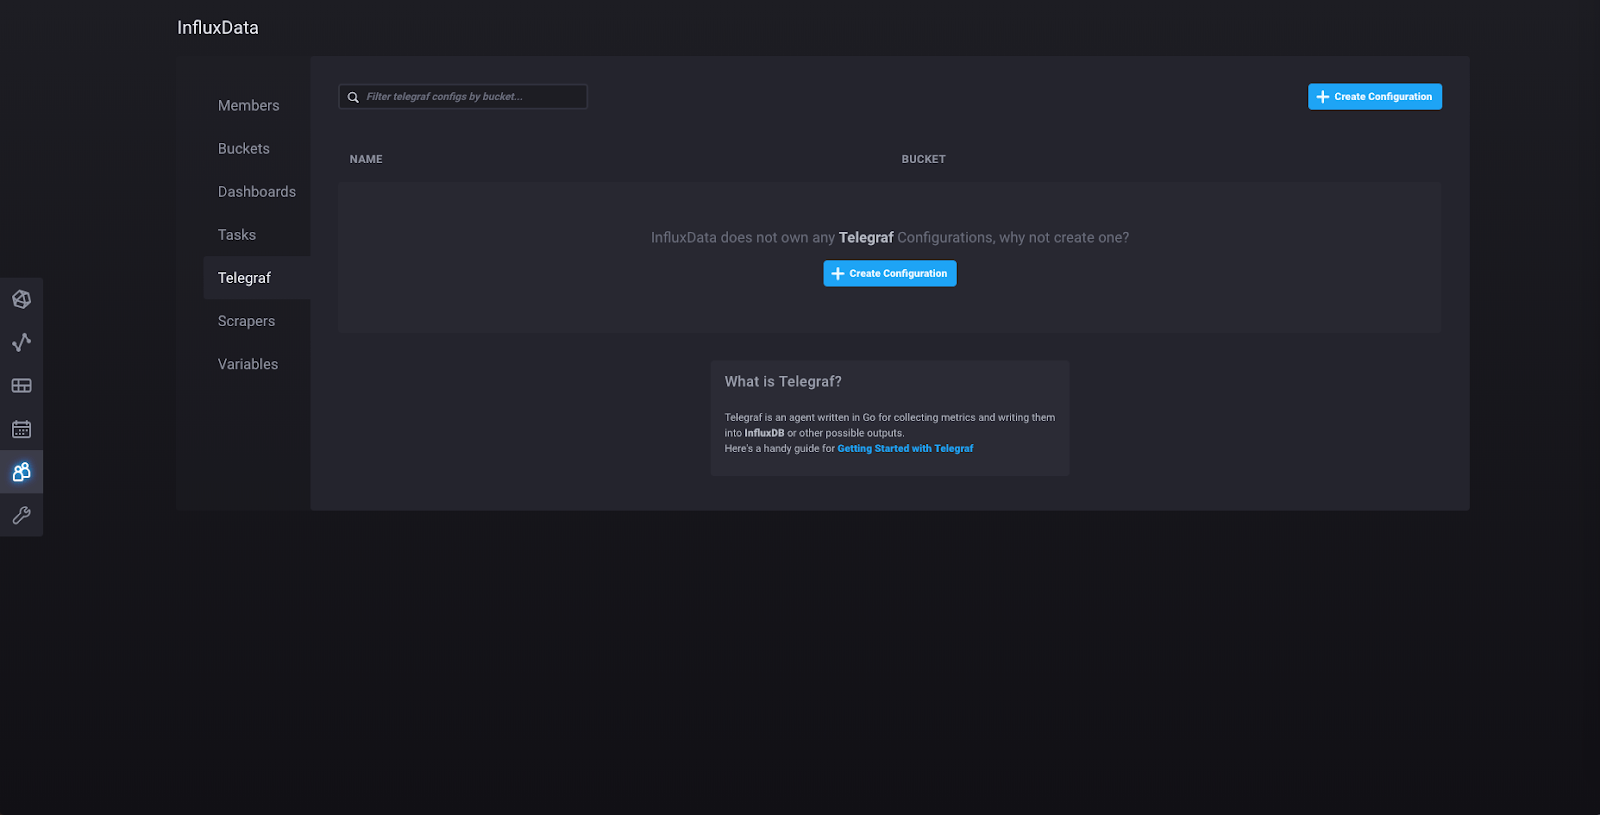
Now click “admin” in the left sidebar and then click “Configure a Data Collector”, which will take you to this page:
Click “Create Configuration” and you will be taken to this page, where you will see a number of collections of plugins that are currently available in 2.0. More collections will be added as 2.0 is further developed. Select the “System” collection of plugins (make sure you click the “Bucket” dropdown on the left side and select the bucket that you just created):
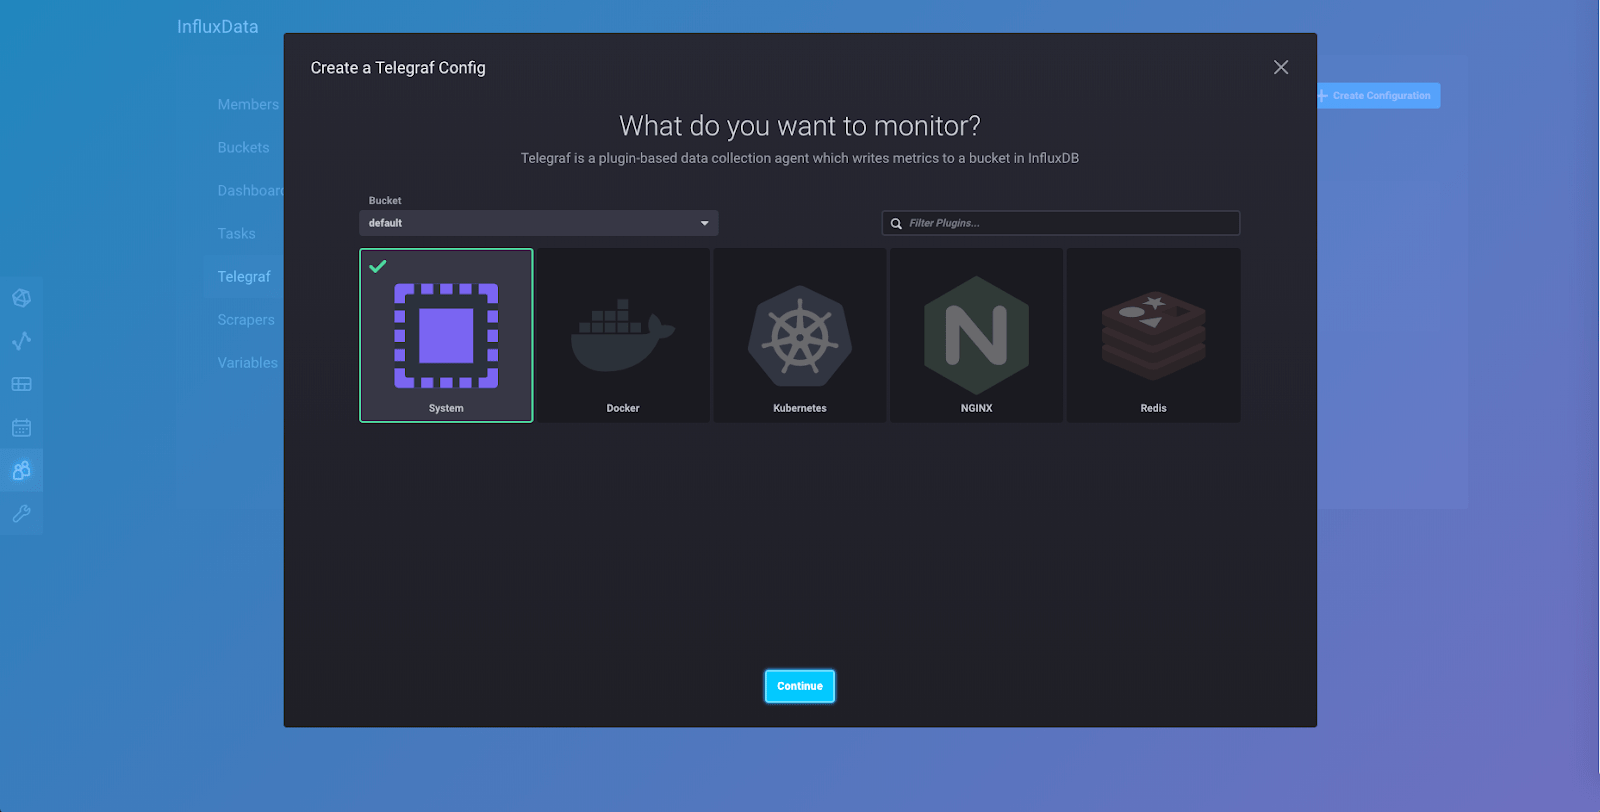
The “System” collection of plugins collects metrics from your Linux machine and is one of the best ways to start playing around with data so you can see how InfluxDB 2.0 works. Click “Continue” and you’ll be taken to this page:
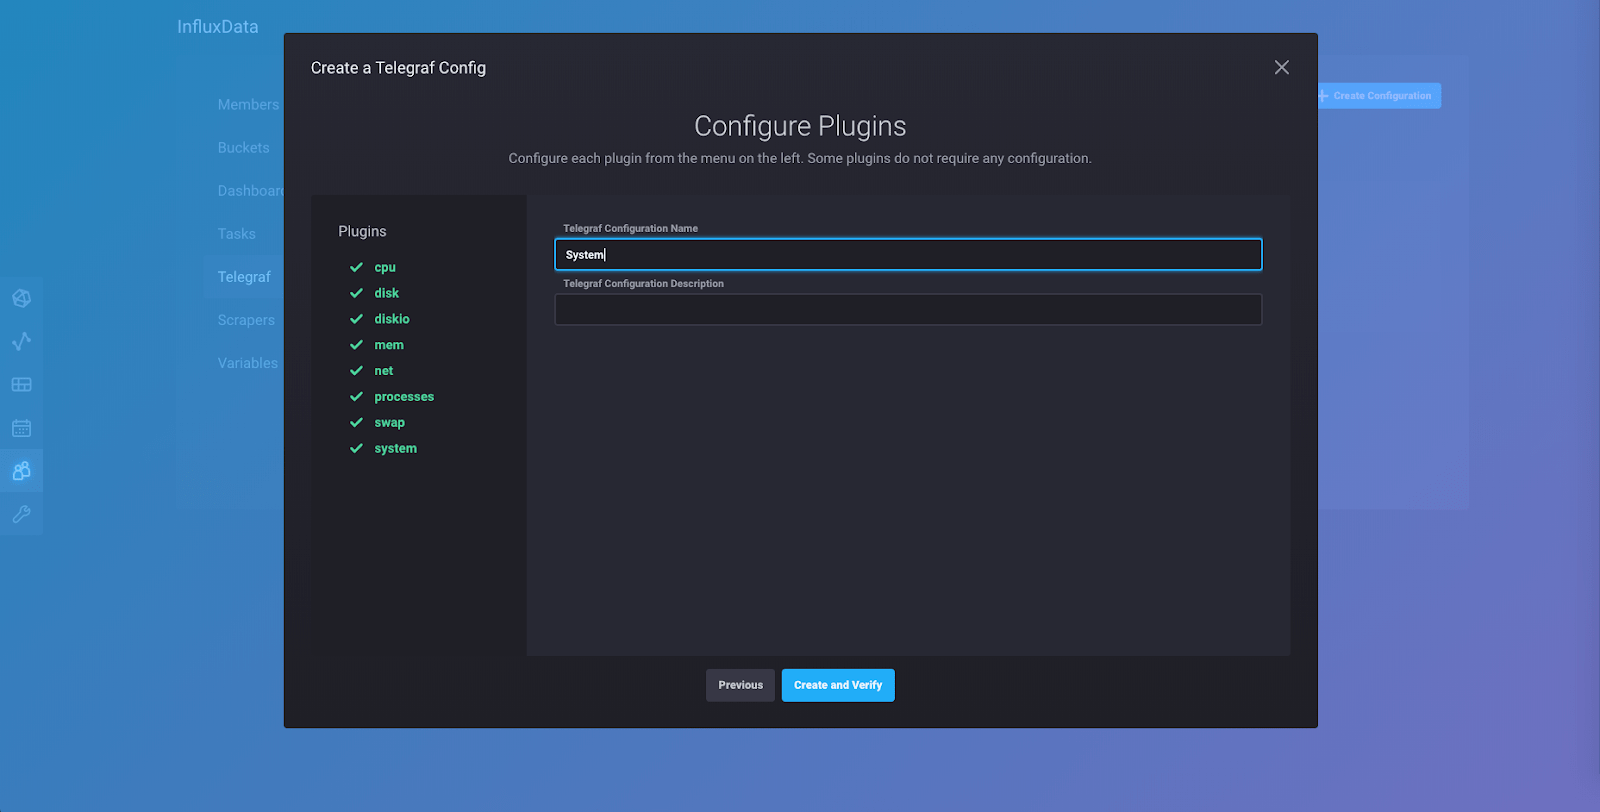
Go ahead and name your configuration “System” so you can follow along with this tutorial. You can keep the description blank. Click “Create and Verify” and you’ll be taken to this page:
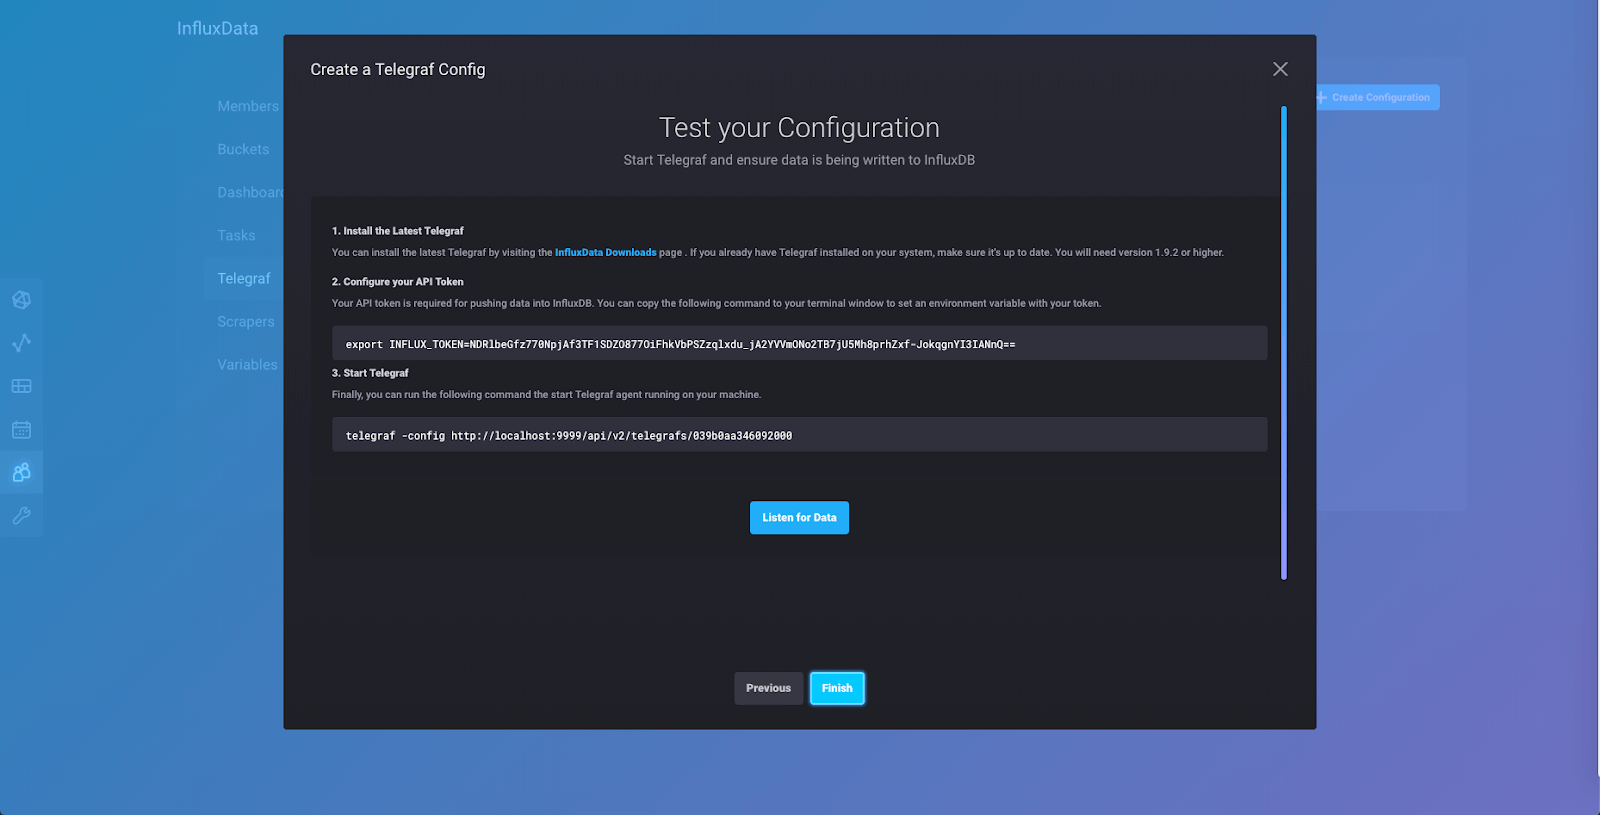
If you have not installed Telegraf, now is the time to do so. You can click on the link to visit the downloads page and install Telegraf following the instructions there depending on your system and whether or not you want to use Docker.
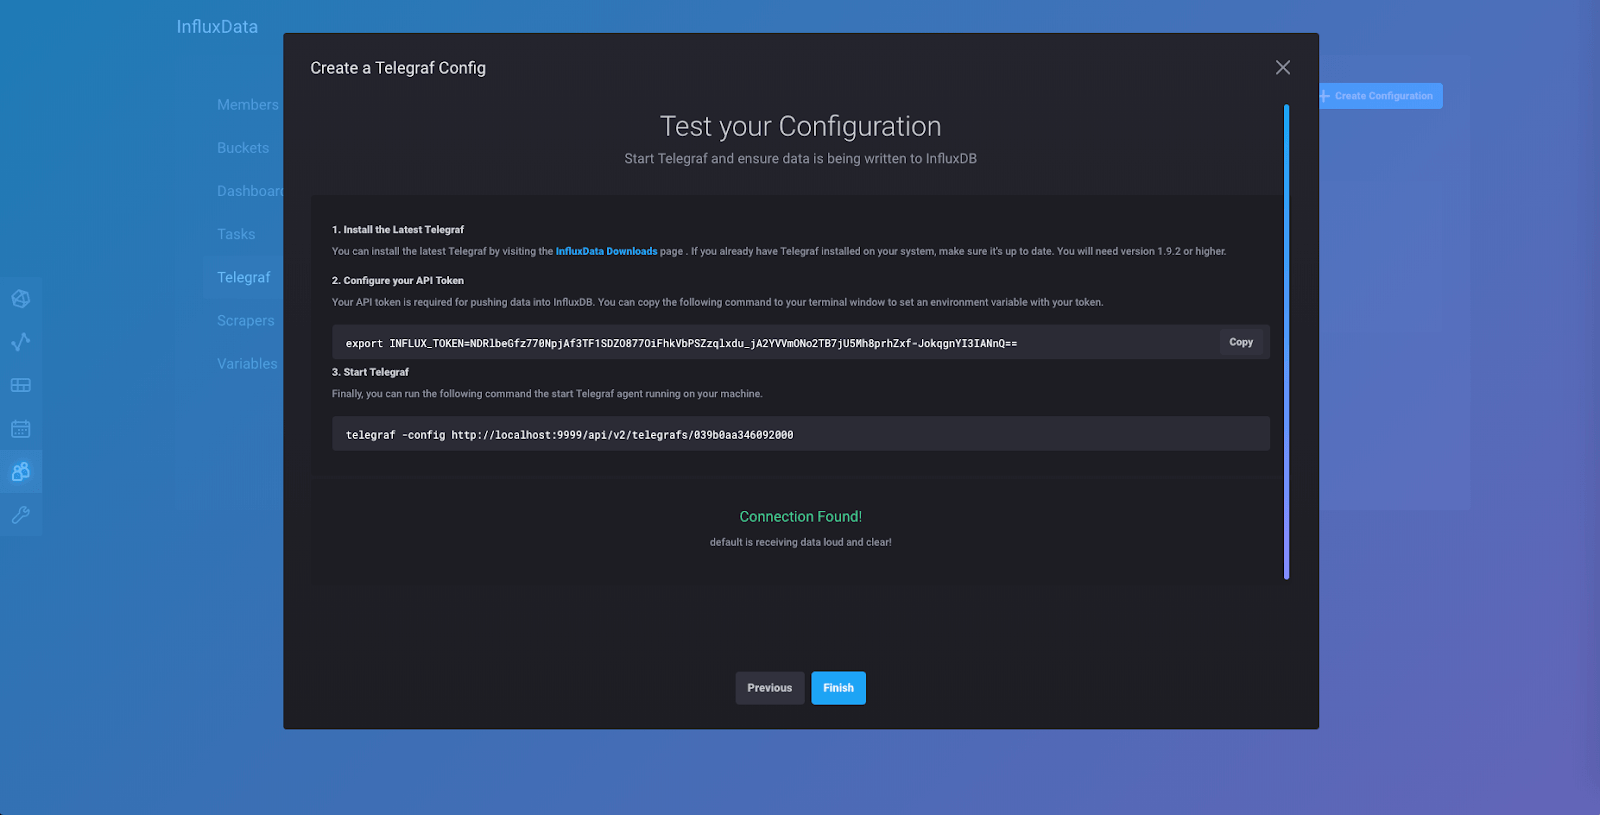
Once you have Telegraf installed, you will want to set an environment variable with your telegraf export token, as explained in Step 2. The export token is a secure way to provide another application with access to write data to your instance. Open a new terminal tab, and then copy and paste the command in Step 2 into the prompt for that tab.
In that same tab (you should have two tabs open now, the first one is where the Alpha is running either from your download or in a Docker container) you will run the command in Step 3.
This will start the Telegraf agent which will collect metrics from your computer using the “System” collection of input plugins that we selected earlier.
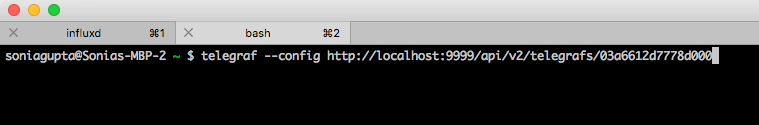
Click “Listen for Data” and if everything is wired up correctly, you will get a “Connection Found!” notification and see this page:
Click “Finish” and you will be taken to this page:
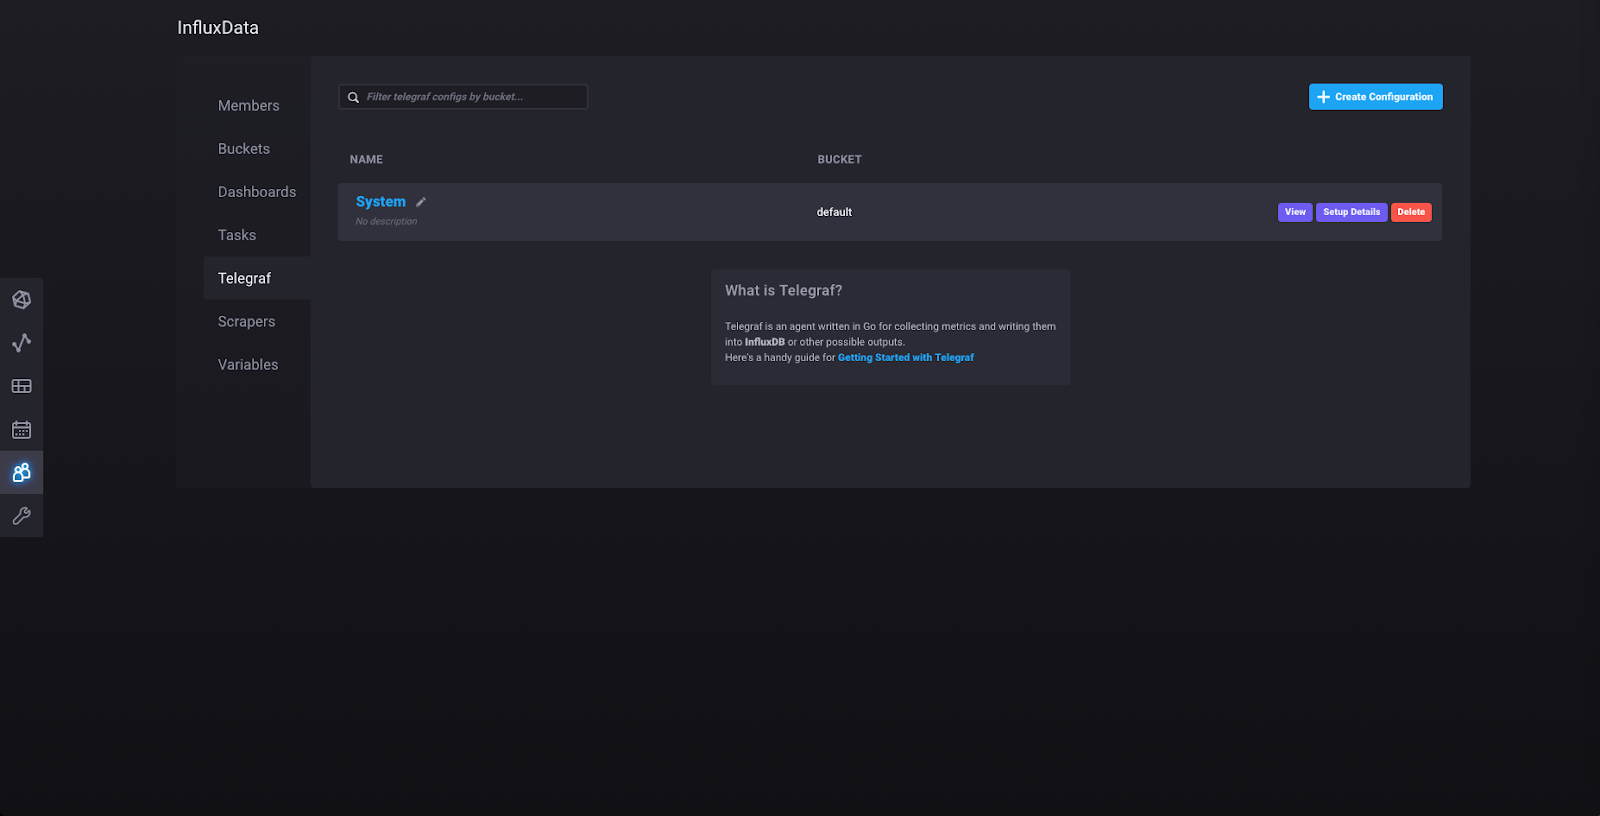
Here you can see the Telegraf configuration that you just made. Clicking on the name of the configuration (“System”) will show you the configuration file:
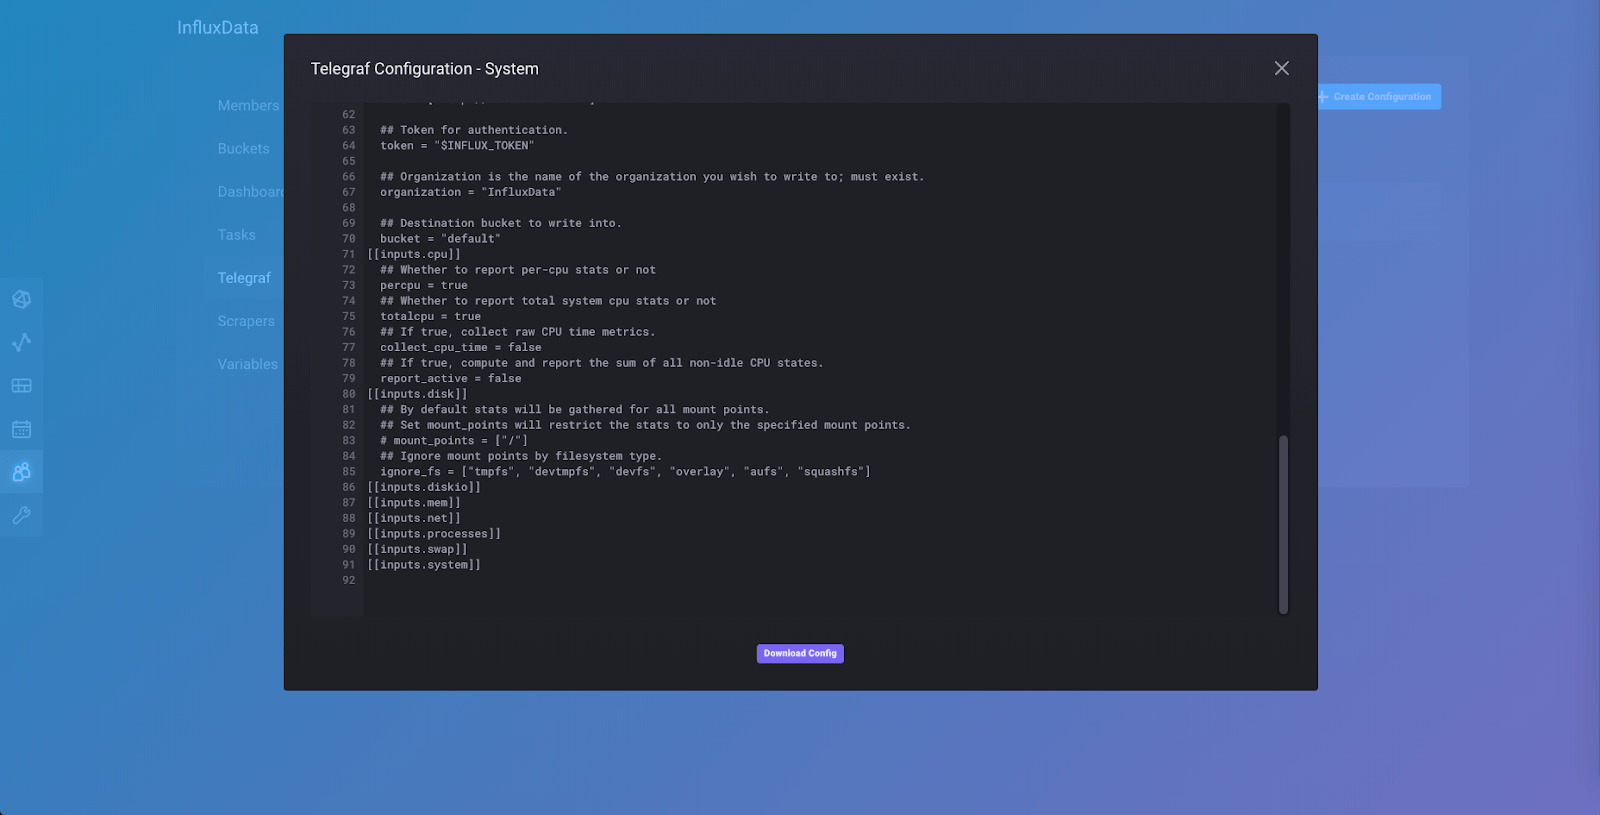
If you scroll down to the bottom of the configuration file, you will see the collection of input plugins we added to our config file, one of which is [[inputs.cpu]]. You can also download the config here to make changes to it and add other input and output plugins manually. You could then run Telegraf from the downloaded config file instead of through the API. You can close the config by clicking the “x” in the upper right corner of the popup.
Now for some fun! The “System” collection of plugins includes a predefined dashboard that you can now see by clicking “Dashboards”:
Click “System” and you’ll be taken to a page that looks something like this:
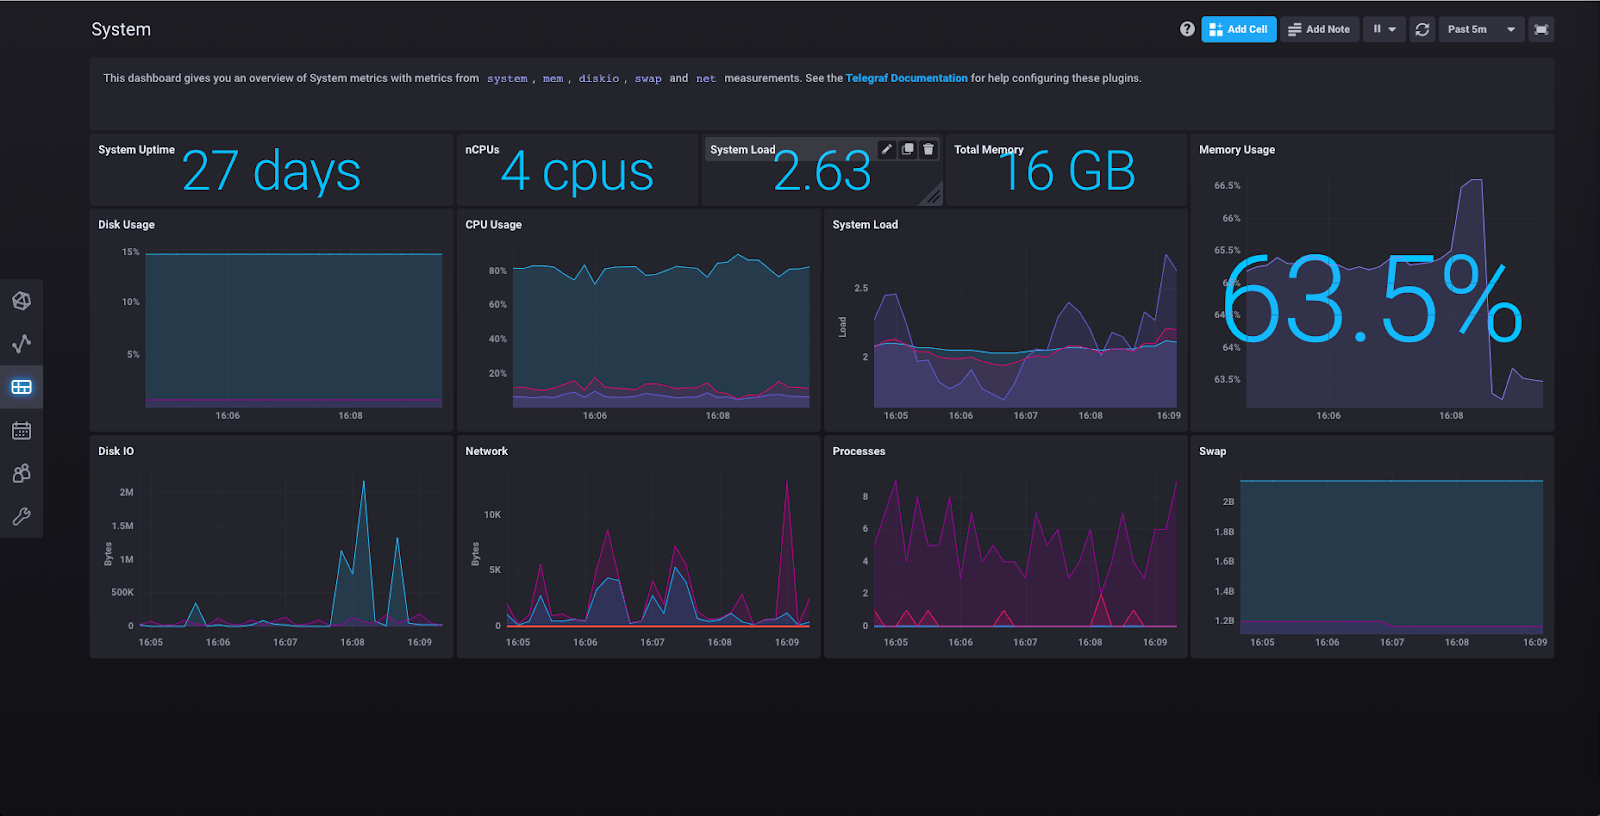
Here you can see the results of the “System” collection of plugins having collected various metrics about your machine.
Querying data with InfluxDB 2.0
Next, click “Data Explorer” in the left sidebar:
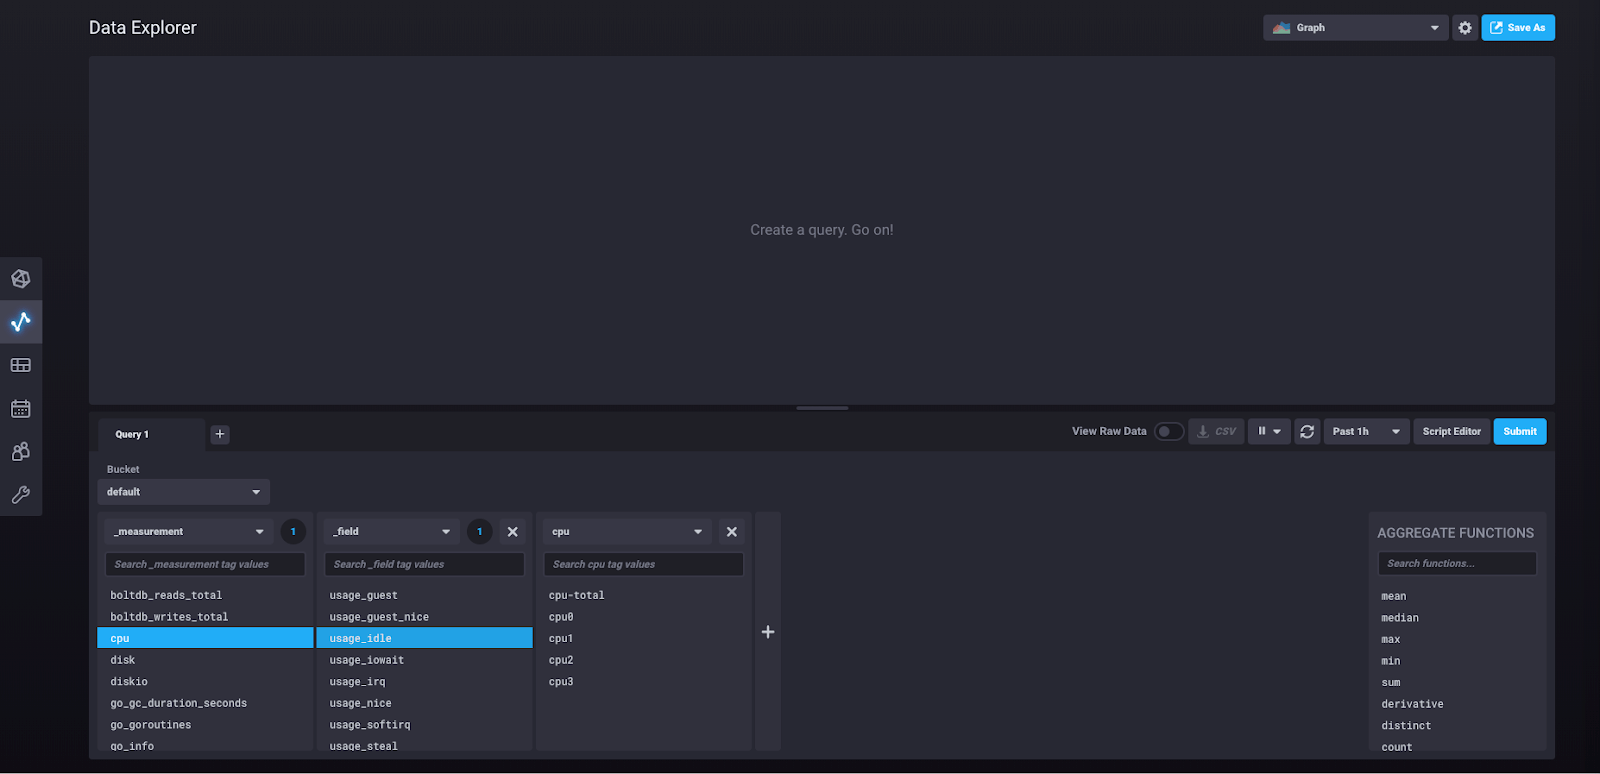
You are now in the query builder. Under “_measurement” select “cpu.” This should pop up another block which contains the fields associated with that measurement, like so:
Click “usage_idle” and another block will pop up which contains the tag key “cpu” and all of its possible values:
At any point in this process of building out the query you can click “submit” and see the results of the query you have built:
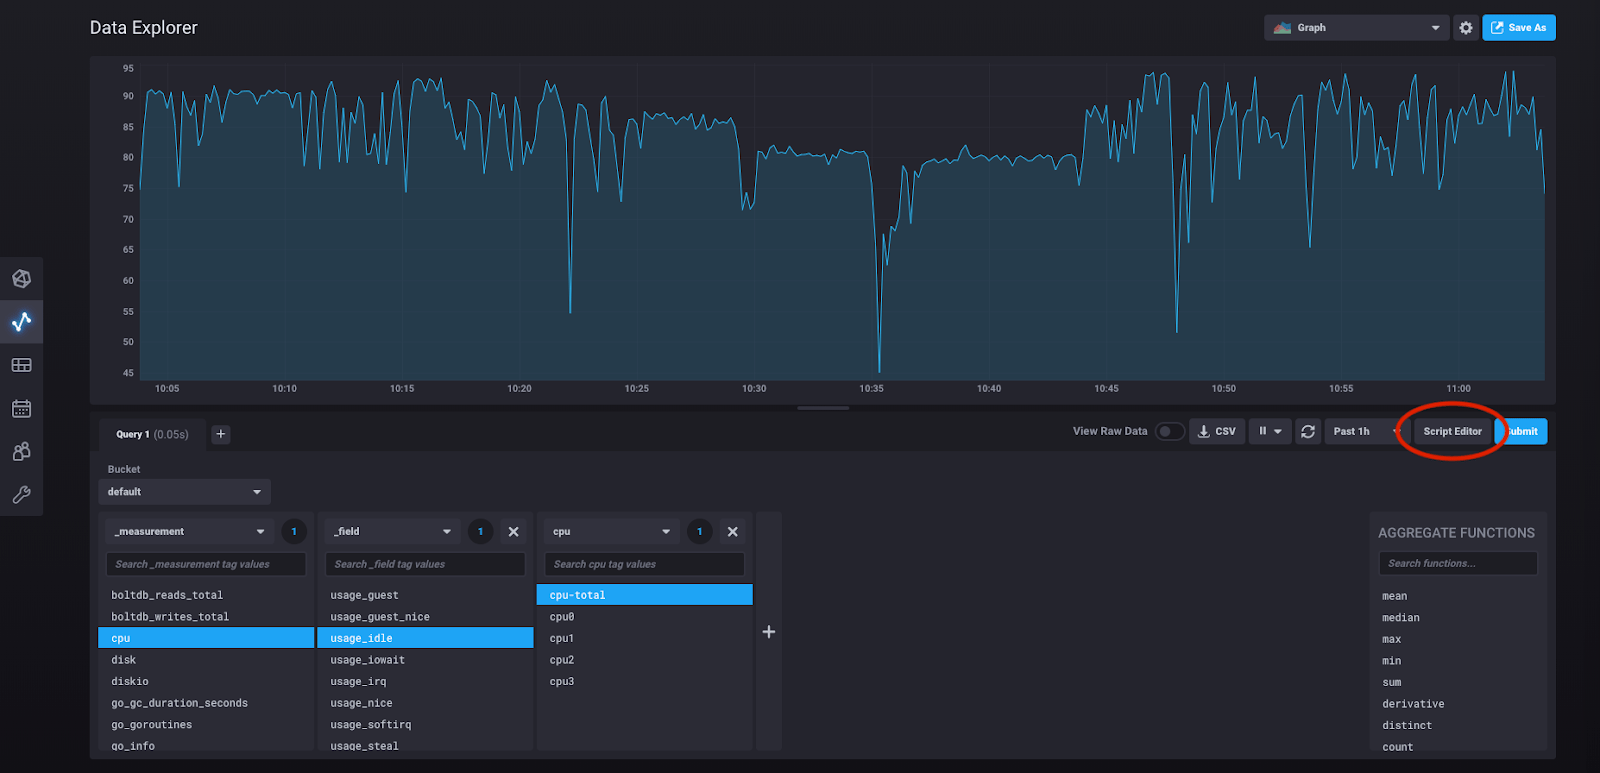
So what is the query we’ve actually built here? We can see it by clicking “script editor.”
Doing so will take us to this view:
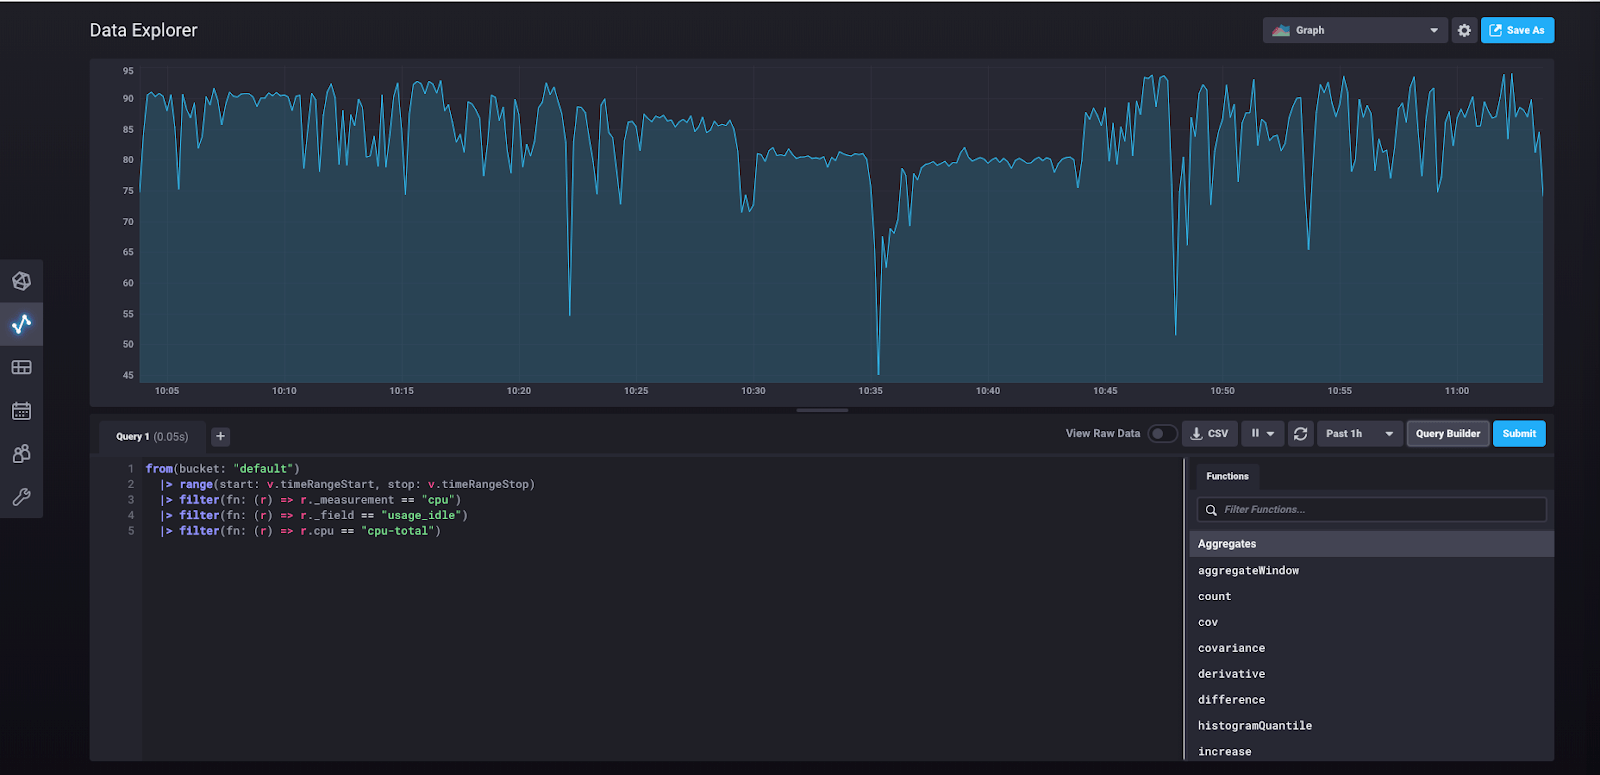
What you’re seeing here is the underlying Flux query that was built in the query builder and that was run when you clicked “submit.”
Writing data with InfluxDB 2.0
Now we can try manually writing some data to the database (as opposed to collecting it through a scraper or the Telegraf agent) and querying that data using the UI.
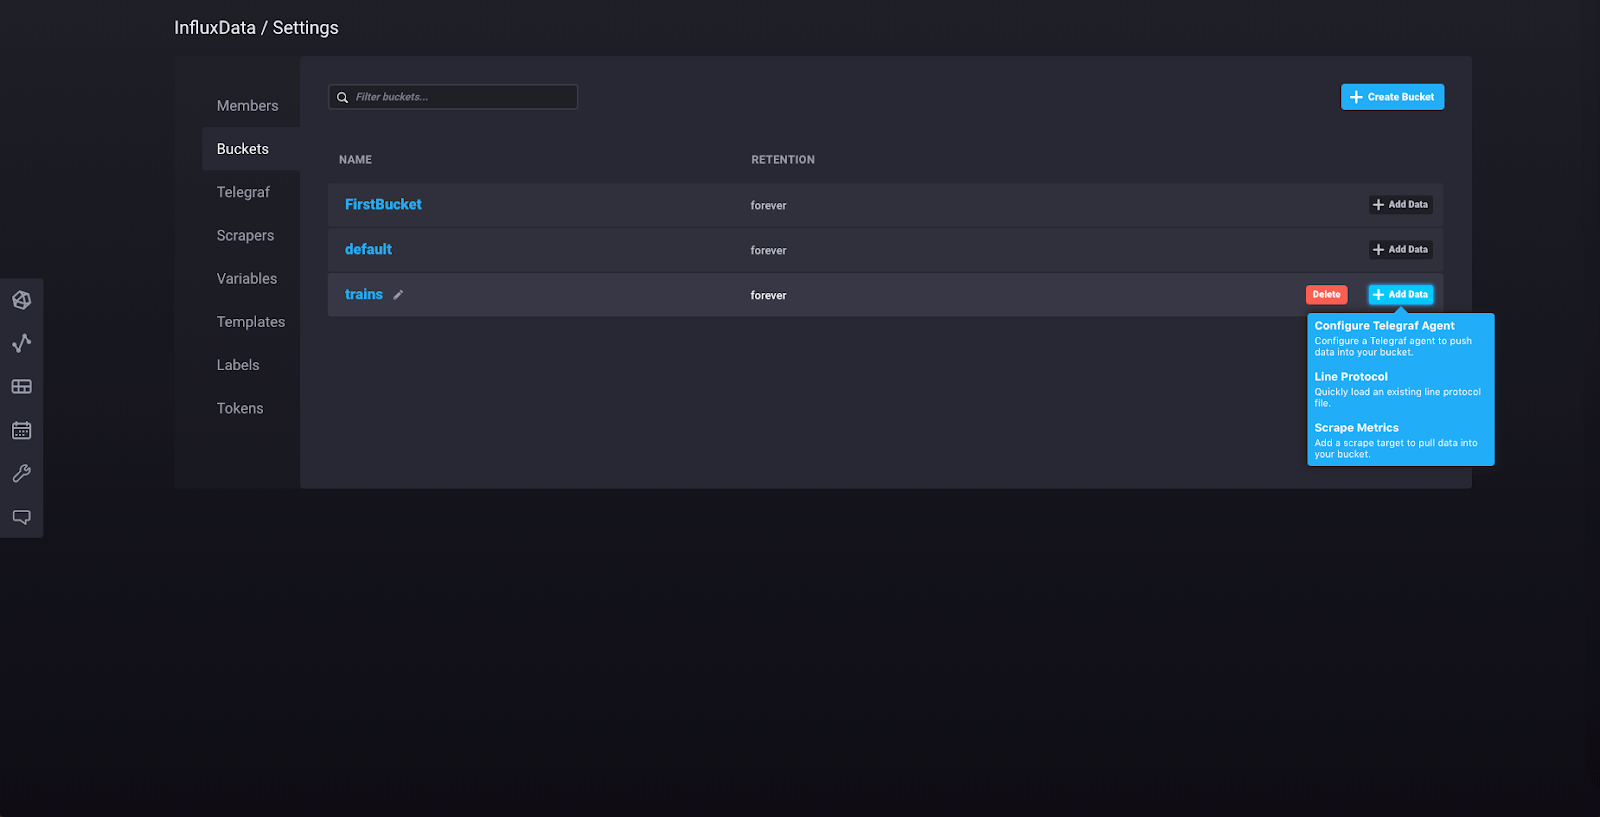
Under “Configuration” in the sidebar, click “Buckets.” You should see this view, with the buckets that we created earlier.
Click “Create Bucket” in the upper right-hand corner.
Name your bucket “trains” and keep the retention policy as it is (leave “How often to clear data?” set to “Never”). Now click “Add Data” for your “trains” bucket.
Select “Line Protocol” from the dropdown, and you’ll see this view:
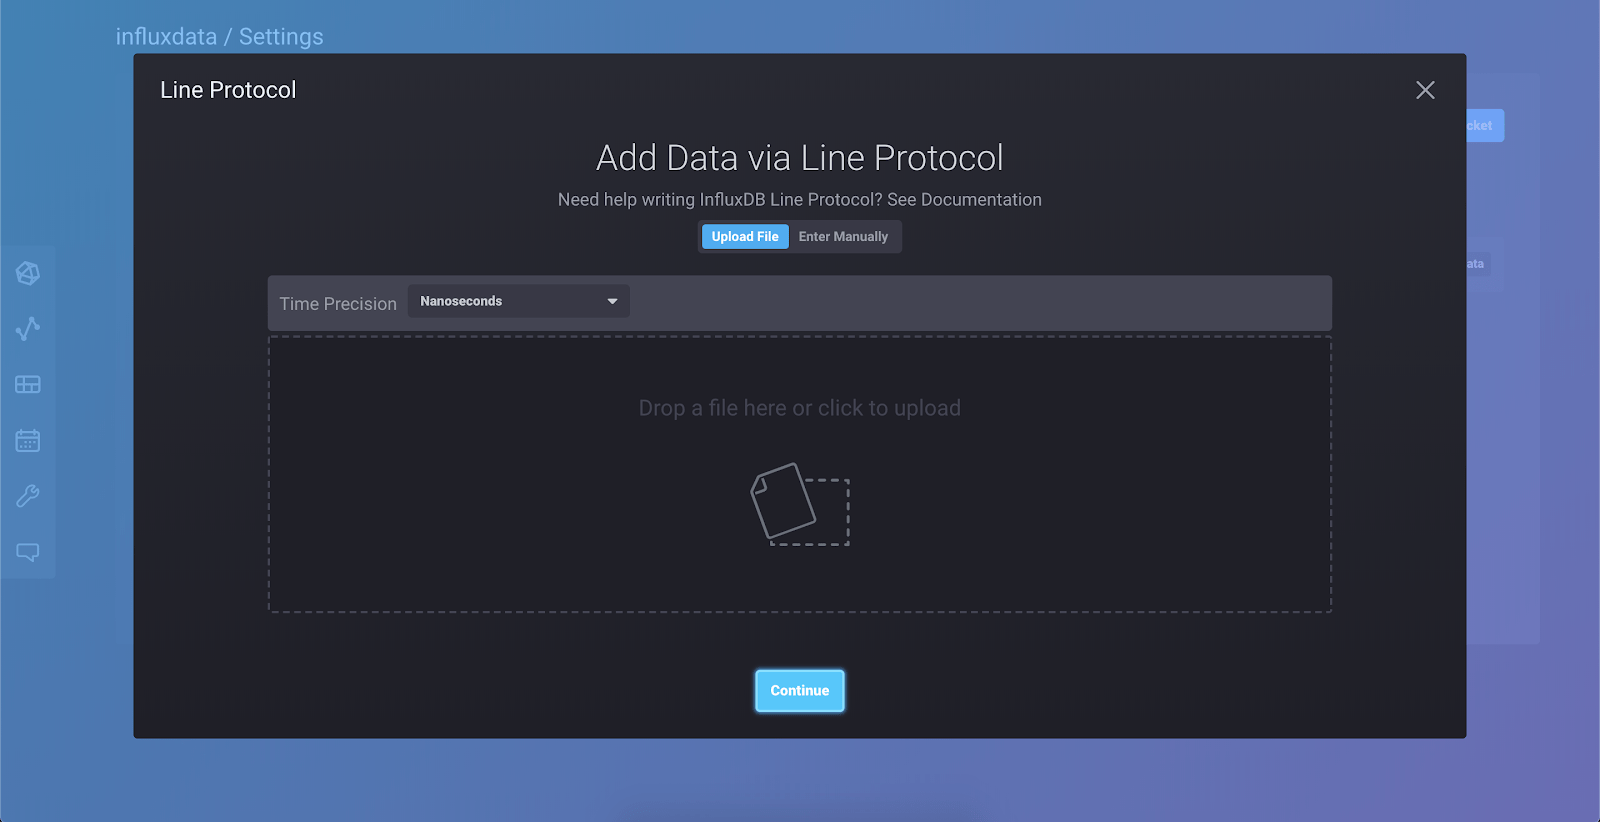
Select “Enter Manually” and paste this line into the window:
passengers_in_car,train=a,car=one,driver=gupta count=125Now click “Continue.” You’ve just written your first point to the database!
Let’s query the database to retrieve that data point. Click on “Data Explorer” in the left sidebar. From the “Bucket” dropdown, select “trains.”
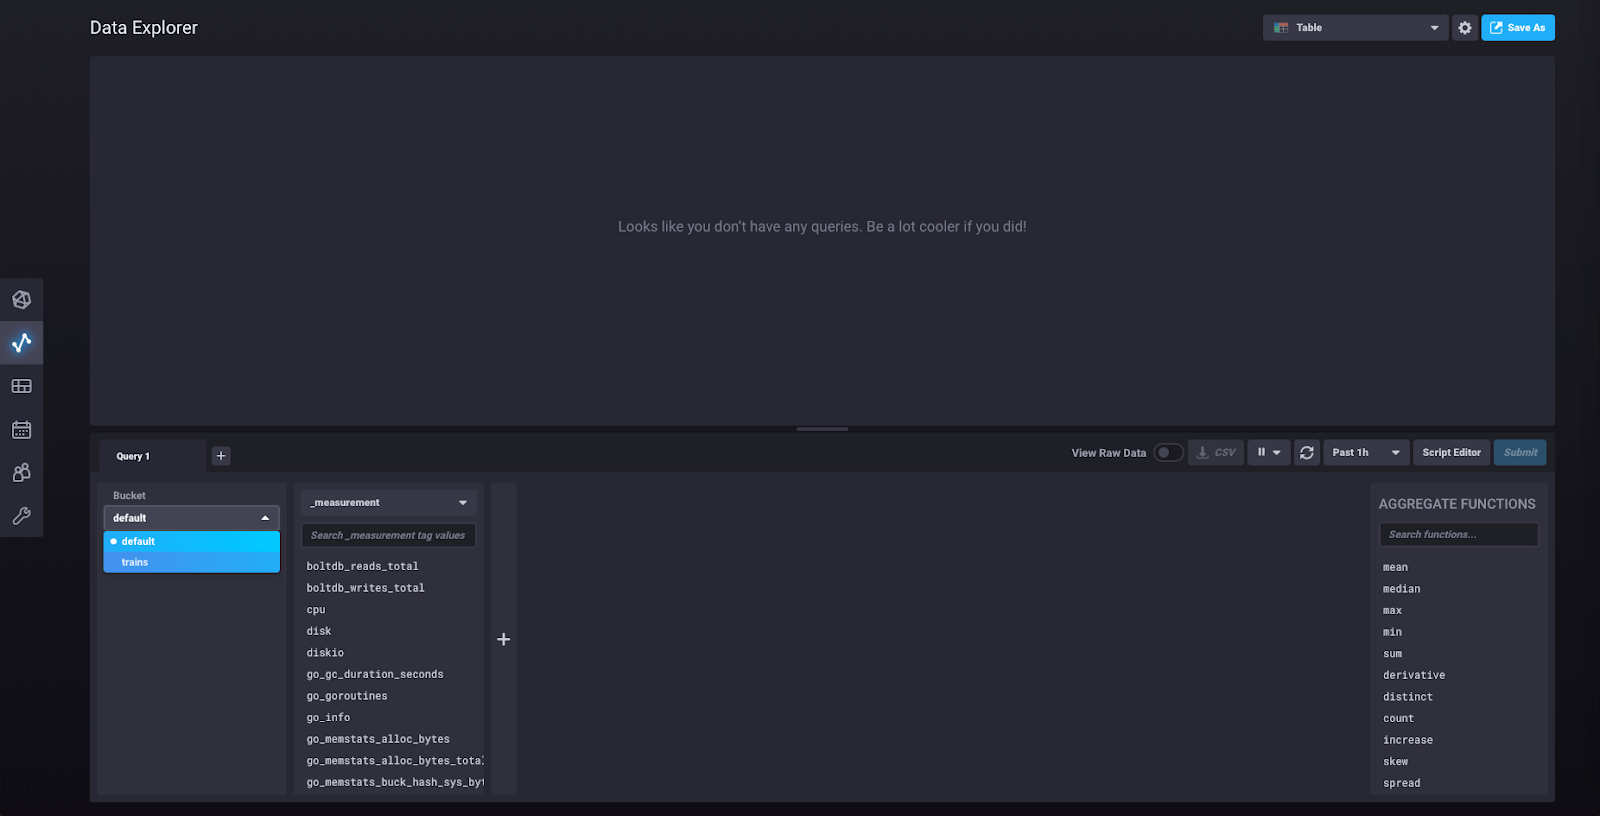
You should now be able to see “passengers_in_car” as a measurement. Click on it, and another block will pop up, like so:
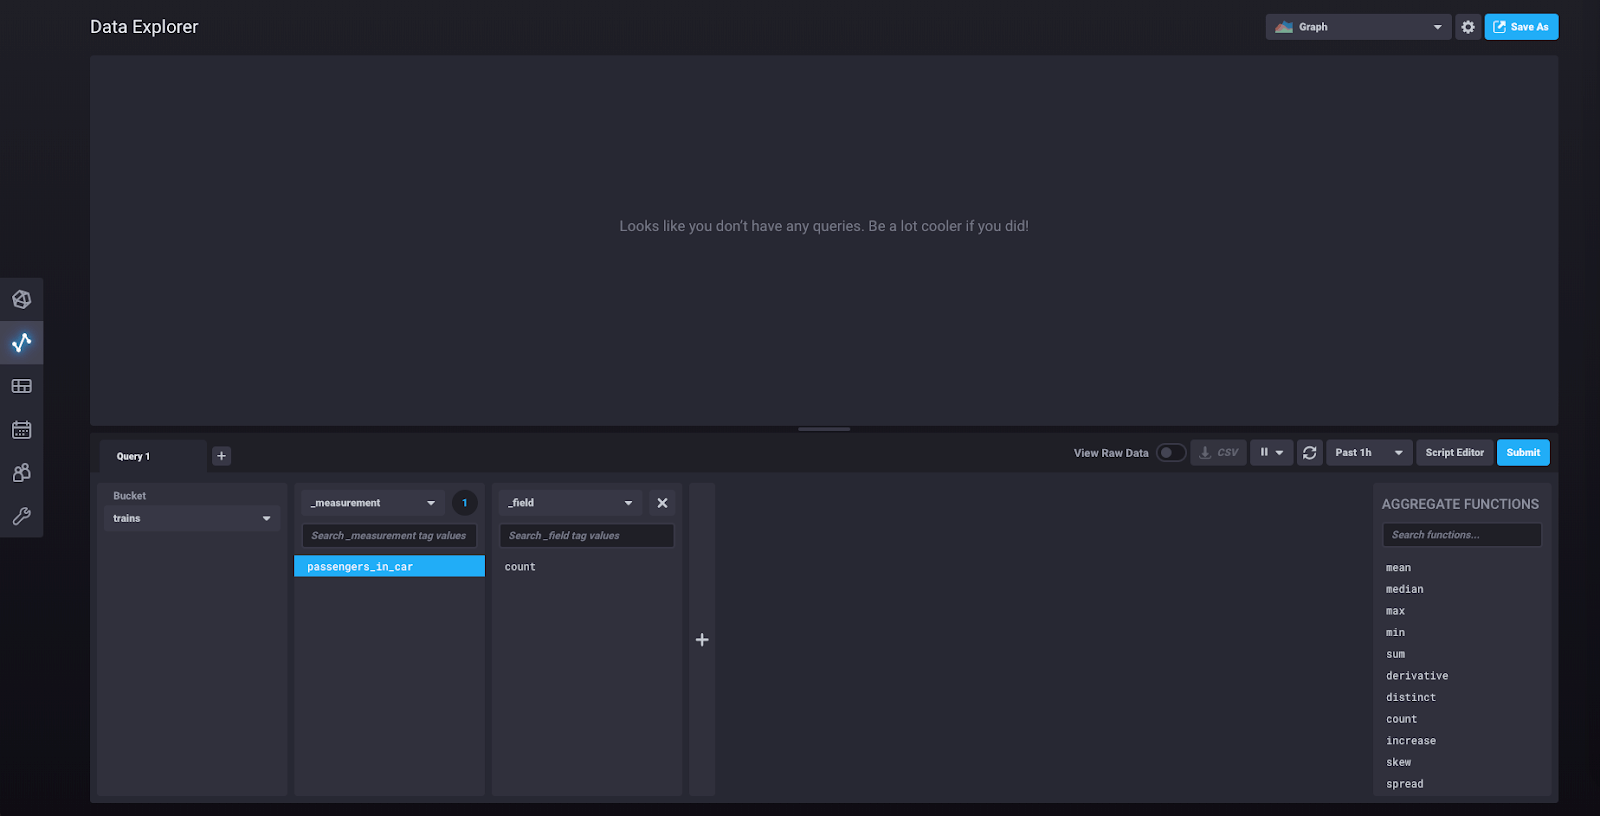
At this point you can click “Submit” and you will be shown a graph of the single data point we just wrote. If you click on the dropdown that says “Graph” in the upper right corner, you’ll find an option to see your data as a Table. Select that option. You should now see this view:
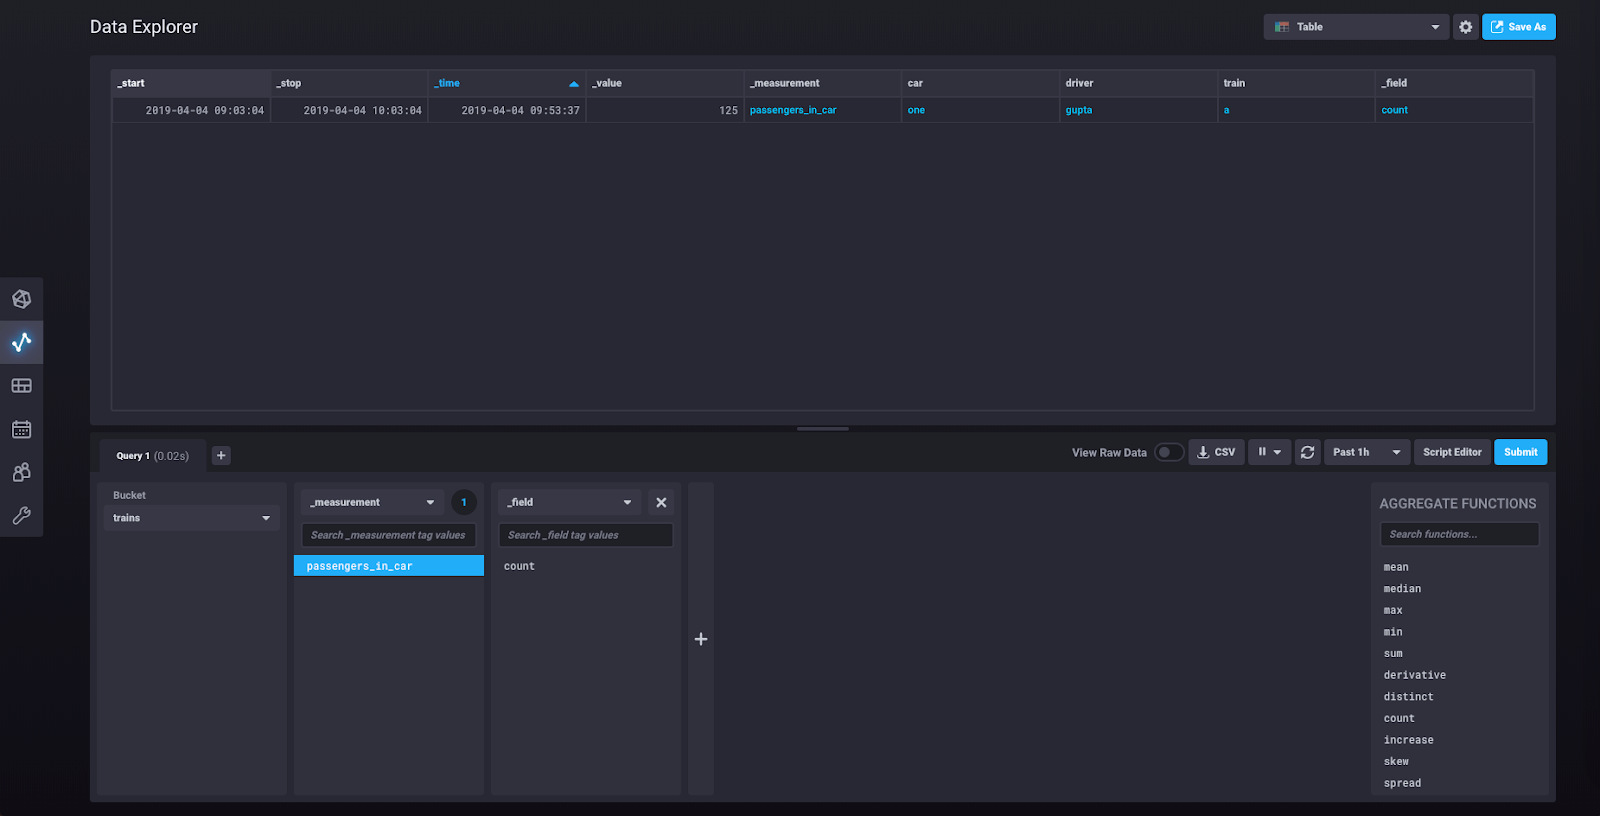
You can now look at the underlying query by clicking “Script Editor:”
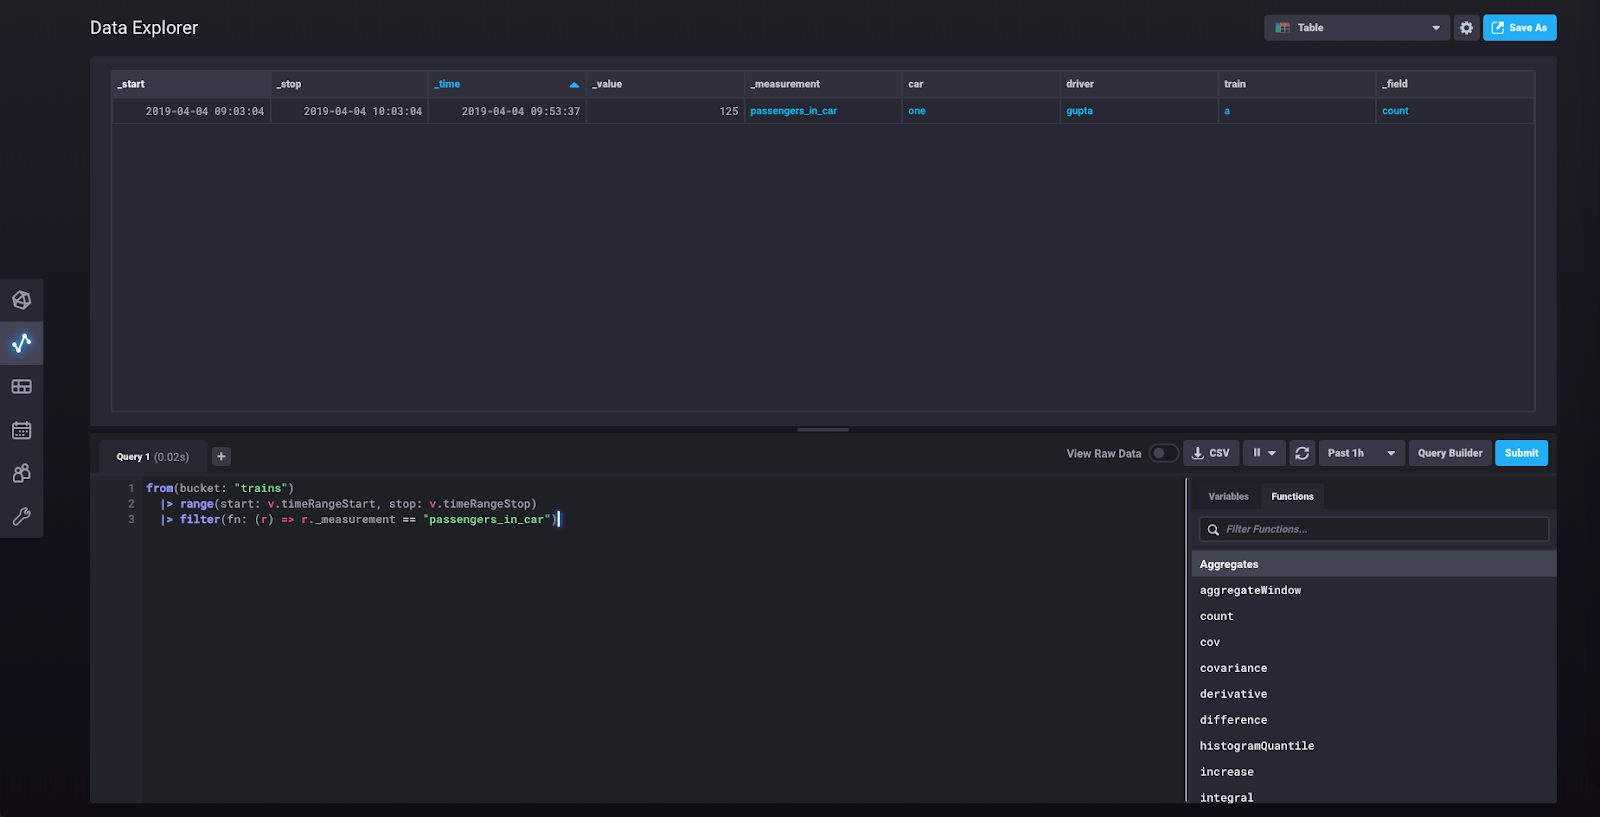
This shows you the Flux query that was built for you as you created your query in the query builder. You can modify the query from this view.
We’re at the end of this tutorial, so if you’d like to shut down the influxd daemon and the Telegraf agent you can exit them using ctrl + c on a Mac.
InfluxDB 2.0 walkthrough summary
You’ve now seen a few of the major features of InfluxDB 2.0 including scraping metrics, running Telegraf, querying data, and writing data. There are many other features that we haven’t covered here, so you can look forward to seeing more posts on those features in the future. Please note that InfluxDB 2.0 is not yet production-ready, but we welcome your feedback and encourage you to experiment with the Alpha as new versions are released. Have fun!
