How to Connect Grafana & InfluxDB IOx
By
Madu Mitha Ravi
updated October 20, 2023
Product
Navigate to:
This article was originally published on Medium.com and is reposted here with permission from the author.
Trying to connect Grafana & InfluxDB IOx? Follow this tutorial to learn how.
Assumption
InfluxDB IOx account is set with a bucket that gets populated with time series data.
It’s good to have the InfluxDB connection details handy.
Type 1: Using datasource — Flight SQL
Configs & requirements
- Installation of custom Flight SQL plugins to be utilized by Grafana OSS version and unzip to the Grafana plugins path
url -L https://github.com/influxdata/grafana-flightsql-datasource/releases/download/v0.1.2/influxdata-flightsql-datasource-0.1.2.zip \
  -o influxdata-flightsql-datasource-0.1.2.zip
unzip influxdata-flightsql-datasource-0.1.2.zip -d /path-to-grafana-plugins/
- Configuring Grafana by editing the defaults.ini under conf folder of your Grafana
a) Update the plugins directory to point to the plugin
b) Allow the unsigned version of the plugin to be used
c) Set the environment variables
[paths]
plugins = path-to-grafana-plugins
[plugins]
allow_loading_unsigned_plugins = influxdata-flightsql-datasource
GF_PATHS_PLUGINS=/path-to-grafana-plugins/
GF_PLUGINS_ALLOW_LOADING_UNSIGNED_PLUGINS=influxdata-flightsql-datasource
- Restart Grafana to reflect these configuration changes
Grafana Flight SQL datasource setup
- Launch Grafana UI http://localhost:3000/
- Navigate to Configurations -> Datasources
- Add Data source -> Select FlightSQL -> Name your configuration
- Input the FlightSQL connection details similar to below, validate by “Save & test”
Note:
- Connection details are based on your InfluxDB IOx account setup — host/url, tokenID and bucket name
- SQL is the query language to access the data

Sample exploration of SQL query using Flight SQL
- Navigate to Explore (Flight SQL)
- Design and Run your SQL query which pulls data from your connected InfluxDB IOx using the Flight SQL

- View run time using Inspector option, similarly other options can be accessed as required
Type 2: Using datasource — InfluxDB
Grafana InfluxDB datasource setup
- Launch Grafana UI http://localhost:3000/
- Navigate to Configurations -> Datasources
- Add Data source -> Select InfluxDB -> Name your configuration
- Input the InfluxDB connection details similar to below, validate by “Save & test”
Note:
- Connection details are based on your InfluxDB account setup — host/url, user credentials, organization, tokenID and bucket name
- Flux is the query language used to access the data


Sample exploration of Flux query using InfluxDB
- Navigate to Explore (InfluxDB datasource)
- Design and Run your Flux query which pulls data from your connected InfluxDB
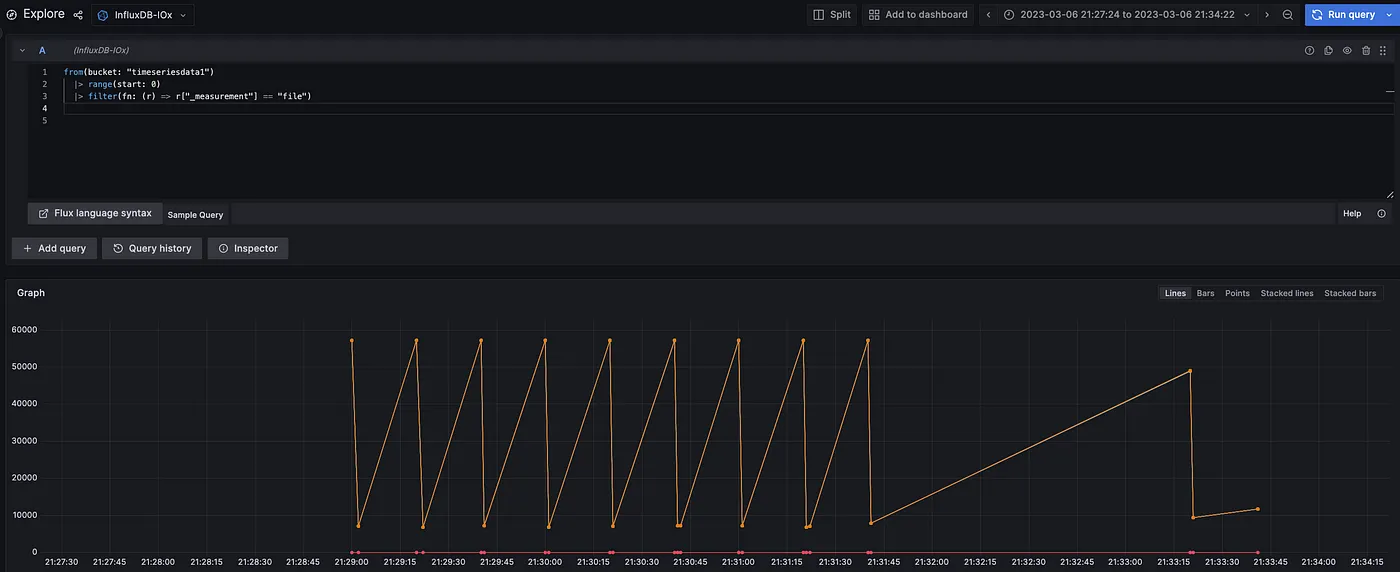
- View run time using Inspector option, similarly other options can be accessed as required
With this blog post, we have learned the two ways of configuring, connecting and querying time series data from Grafana — InfluxDB IOx by utilizing SQL with Grafana datasource Flight SQL and Flux query language with Grafana datasource InfluxDB.
Thank you for reading!
