How to: Deadman Check to Alert on Service Outage
By
Community /
Product, Use Cases
Aug 30, 2022
Navigate to:
This article was written by Tyler Nguyen, Summer 2022 intern at InfluxData.
Whether you’re using InfluxDB to record massive amounts of historical stock market data to analyze the current economic trends or simply to monitor the number of times the lights in your smart home turn on and off to cut down on wasted electricity, a sudden shock or delay in the flow of incoming data can be detrimental to your operation in the majority of scenarios. Fortunately, however, InfluxDB is more powerful than just a storage solution or data querying tool: the ability to set up automated tasks is an incredibly useful feature of InfluxDB Cloud. Of the endless possible tasks you can create, conveniently, one of the available preset tasks is a “Deadman Check,” which checks for any abrupt hindrance or stoppage of incoming data, and can even alert you through any third-party messaging platform that supports webhooks when any of your services stop writing to InfluxDB.
1. Creating a check
- Once logged into the InfluxDB Cloud 2.0 user interface, navigate to the left sidebar and find the “Alerts” section.
- In the top right corner, there will be a “Create” dropdown box to create a new alert, from the dropdown menu, select the type of alert — in this article we will be using the “Deadman Check”.
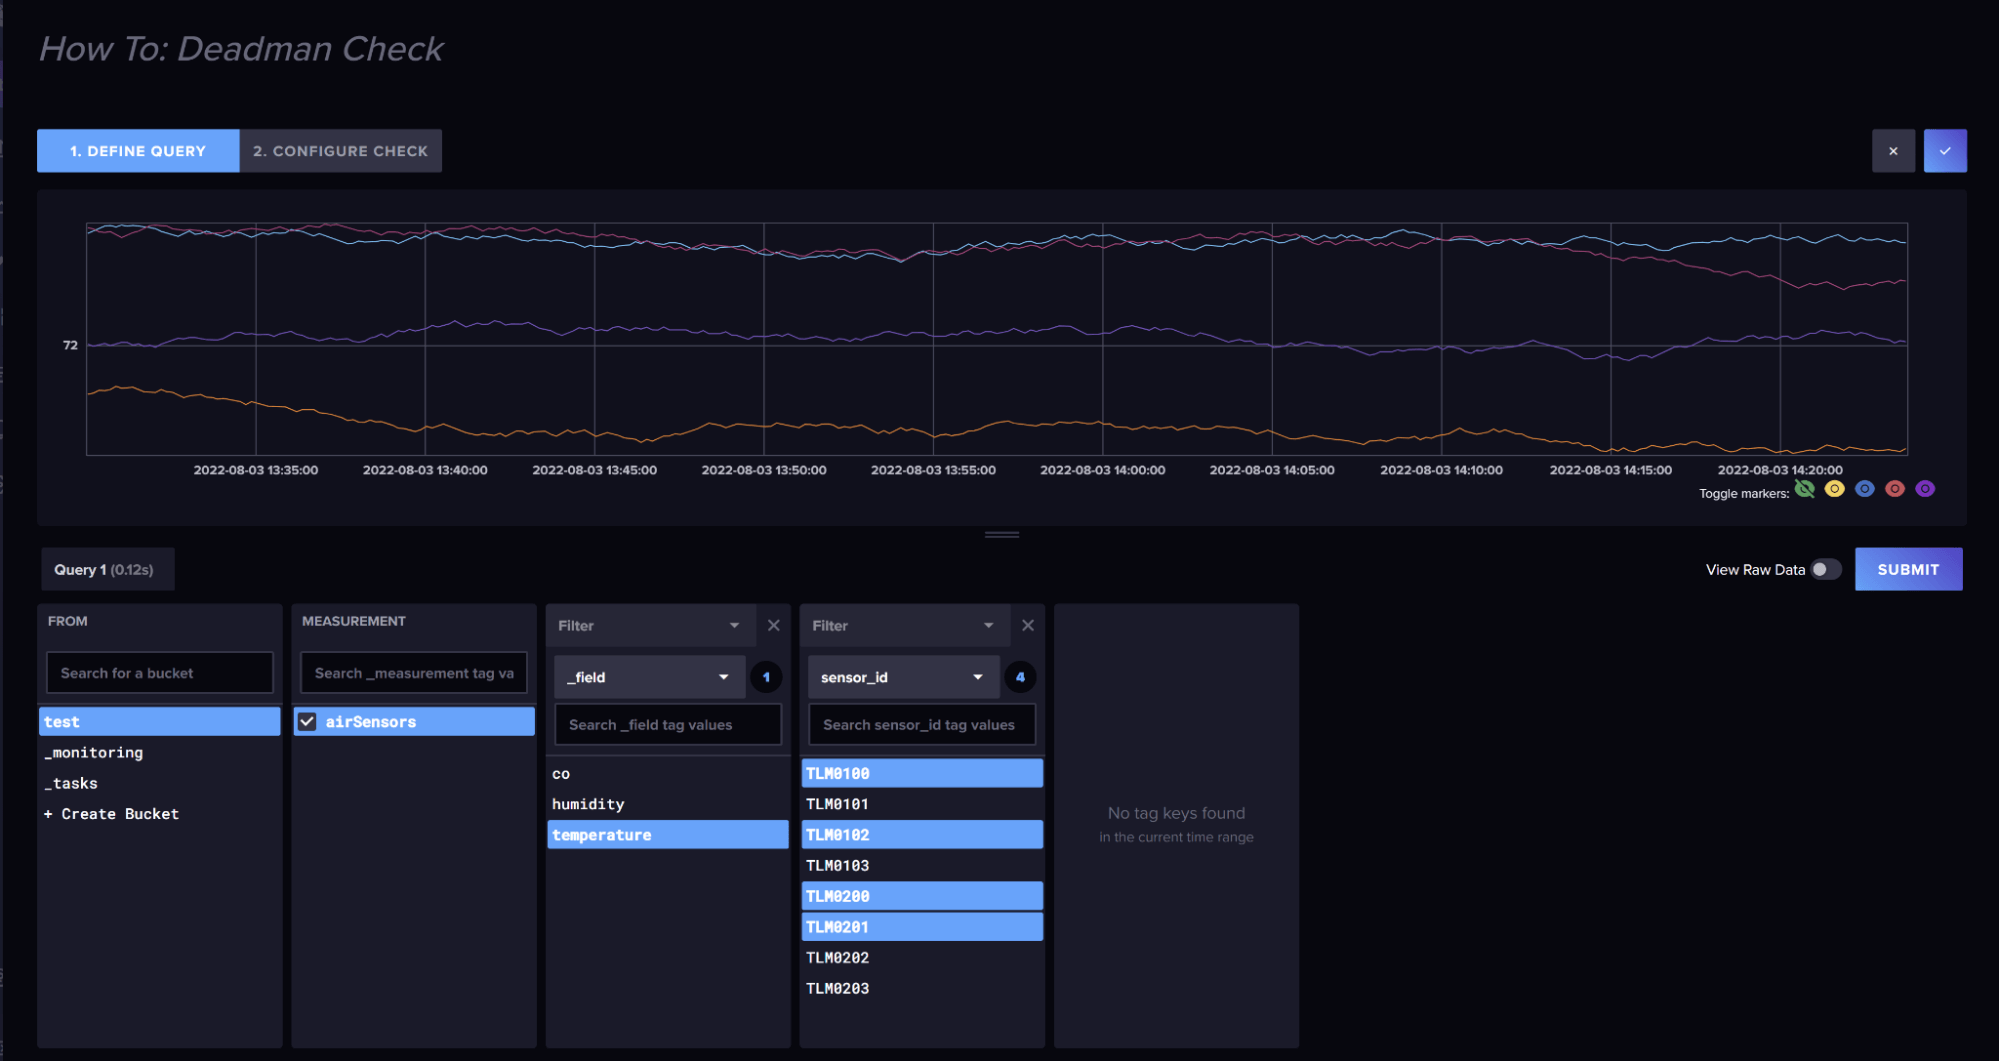
- Defining the Query: After selecting the type of check, a new page will appear with two tabs: one to define the query and one to configure the check.
- To define the query, you must select the data you want to work with — at least one field from the bucket you want to perform the check on. Additionally, you can name the check at the top of the screen to manage and organize all of your different checks.
- When you’re finished, click submit. This will query the relevant data, display a visualization for the bucket and field(s) you chose, and generate Flux scripts to detect a valid deadman scenario.
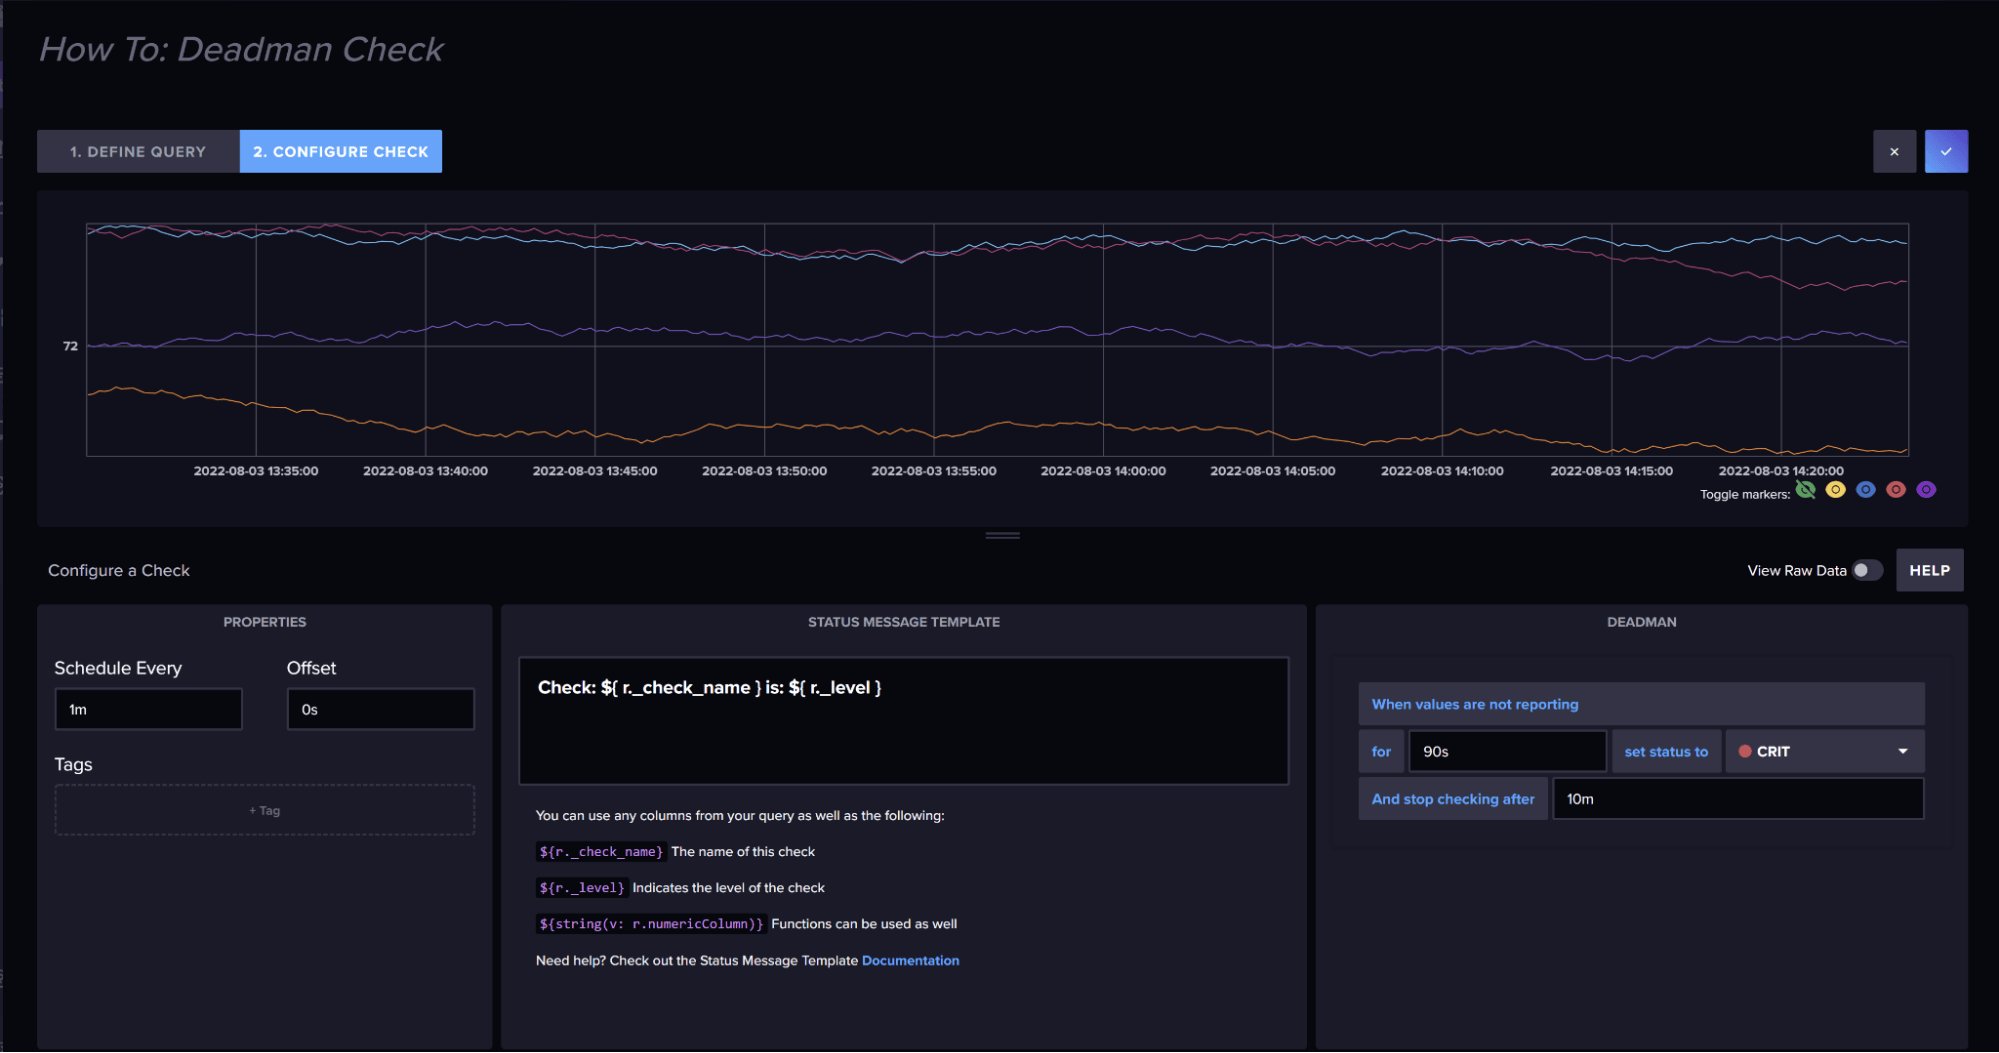
- Configuring the check: The next page contains the settings to configure the check itself.
- Properties: Here you can schedule how often the check will happen, as well as include an offset in the case of any late data.
- Status Message: This is where a message template has already been created for you, but you can clear it and add your own message if you’d like.
- Deadman: In the “for” box, you will enter how long after data has stopped being written that you would consider to be a proper “deadman” scenario. In the “set status to” box, you will determine the severity of your check. For example, if you selected 90 seconds and critical, this means that after 90 seconds of data not being written, the status will be set to critical. Finally, you can set a time to stop monitoring the series and click the check mark at the top to officially create the check.
2. Configure a Slack App as an endpoint
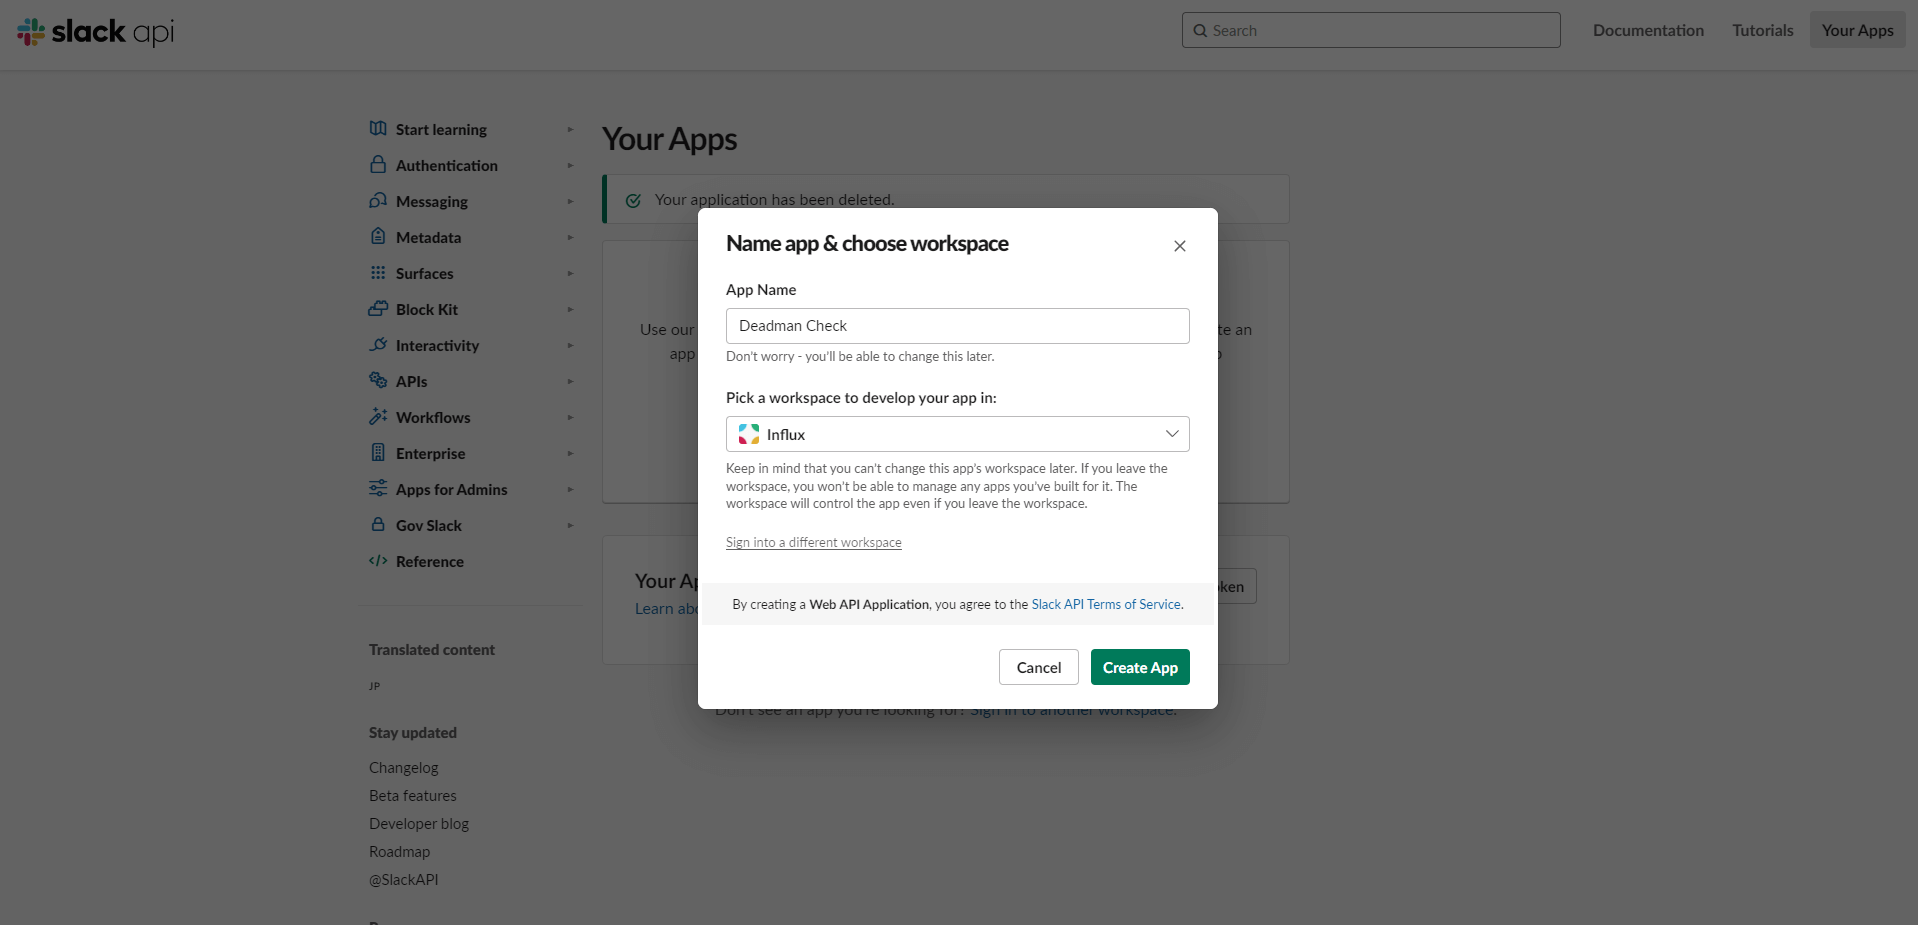
- Login to your desired workspace in Slack.
- Create a new Slack App or use an already existing Slack App in that workspace as an endpoint.
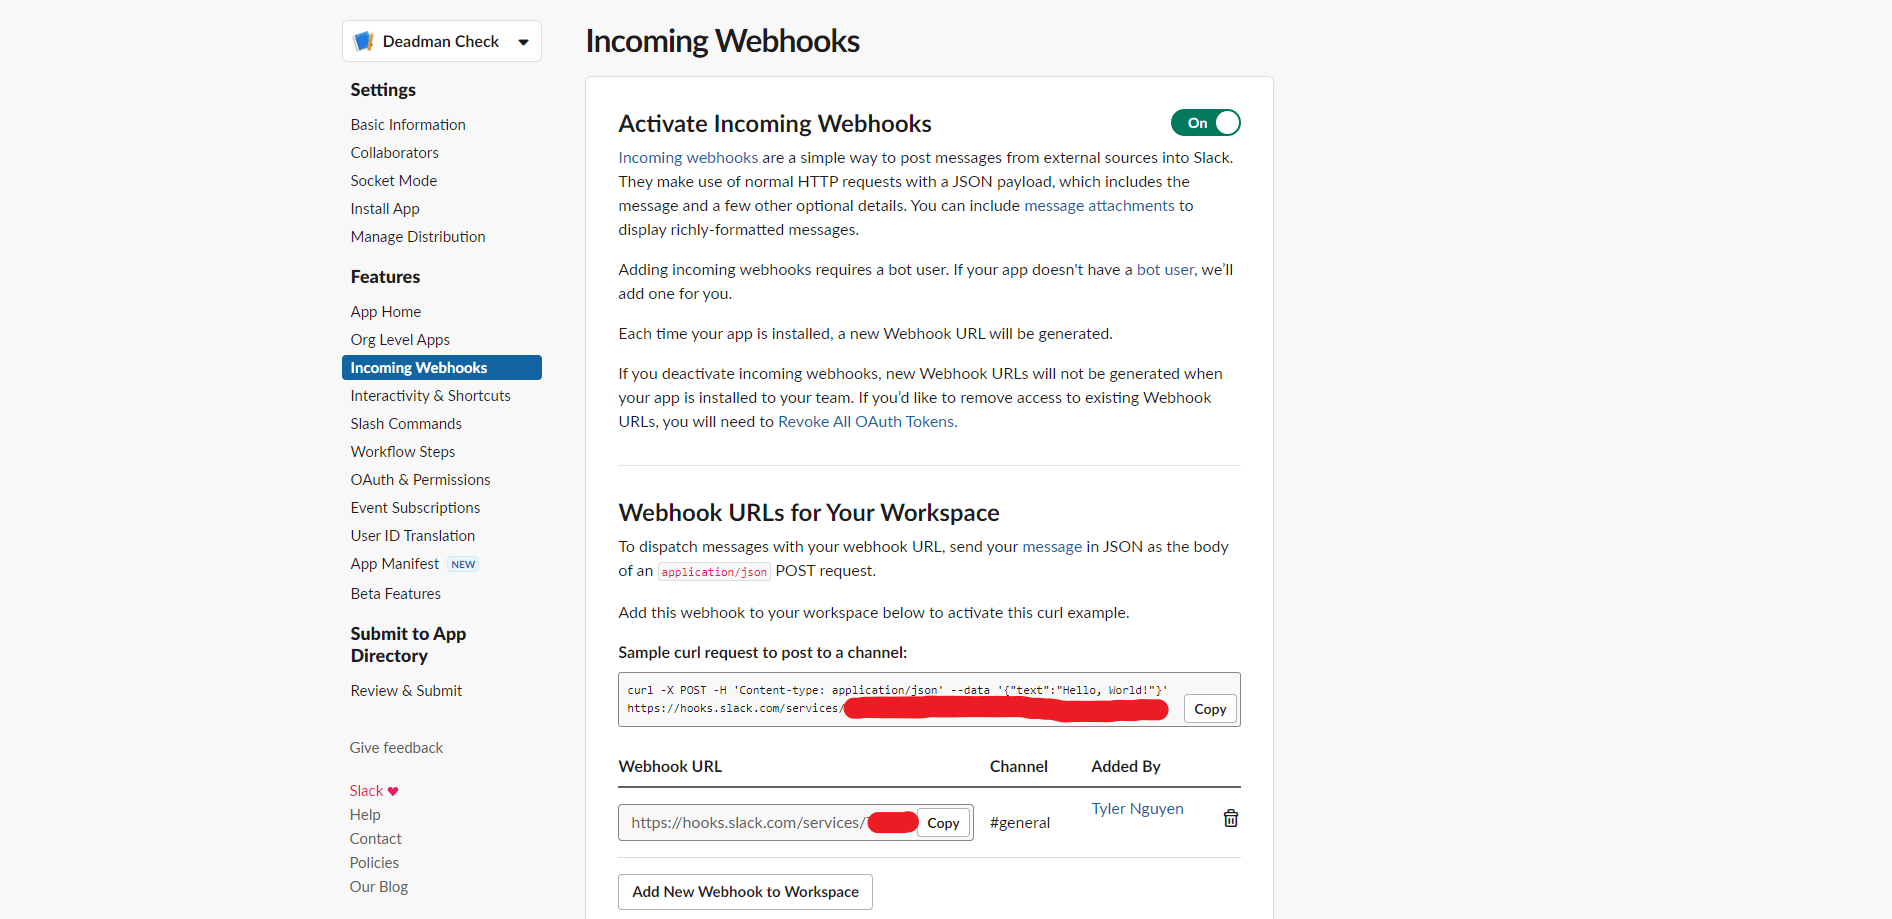
- In the “Add Features and Functionality” section under “Basic Information,” navigate to the “Incoming Webhooks” panel.
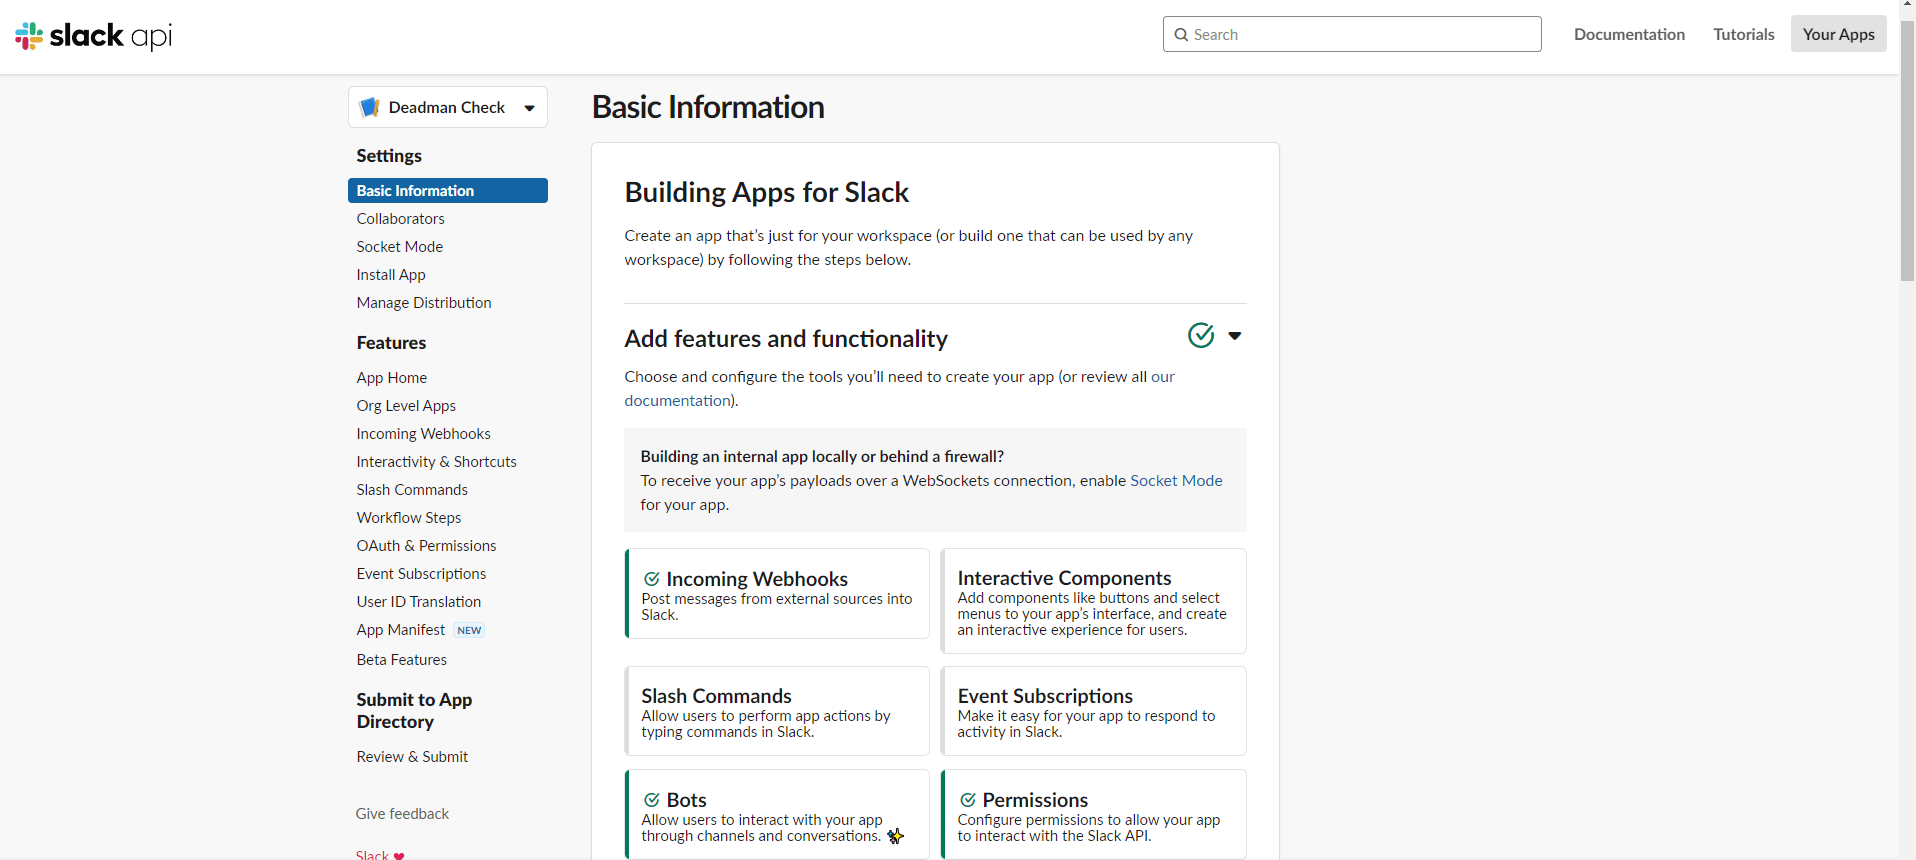
- Enable “Incoming Webhooks,” create a new webhook URL, and give it permission to send messages to one of the text channels in the workspace. This will be the URL you give to InfluxDB in the next section.


3. Creating a Notification Endpoint
- On the “Notification Endpoints” tab, you will find that it looks very similar to the previous tab. Click the “Create” box, once again.
- A new page will appear where you can enter the information of your desired endpoint.
- Destination: InfluxDB supports Slack, PagerDuty, and HTTP as valid endpoints.
- It’s worth noting that the free plan of InfluxDB only allows usage with Slack, which is what is used in this article.
- Following this, you can name and describe the endpoint for organizational purposes.
- Lastly, you would put the link of your webhook URL from the previous section in the remaining field.

4. Creating a Notification Rule
-
Similar to the “Notification Endpoints” tab, the last tab called “Notification Rules” has a “Create” box to add a new rule.
-
A new page will pop up, detailing the properties for the new rule.
-
About: this section allows you to name the new rule and set a frequency that it checks the status of the series
-
Condition: Here you can set the condition for when the notification rule is triggered. Additionally, you can trigger the rule for certain tag values as well.
-
Message: Select the endpoint you just created in the last section to tell the rule where to send a message. You can put anything you want in the message, but the default template informs you that a notification rule was triggered and is followed by the message you created in the check from section 1.

Conclusion
Congratulations! You have successfully created a deadman check, complete with third-party notifications. Service outages are more common than you might think, so it is crucial to handle them immediately, which further illustrates the robustness of InfluxDB. If you are an InfluxDB open source or free tier user and need help, please reach out using our community site or Slack channel. If you’re developing a cool IoT application on top of InfluxDB, we’d love to hear about it, so make sure to share it on social using #InfluxDB! Additionally, feel free to reach out to me directly in our community Slack channel to share your thoughts, concerns, or questions. I’d love to get your feedback and help you with any problems you run into!
