How InfluxDB Helps a Hobbyist Improve His Home and His Career
By
Caitlin Croft
updated December 14, 2025
Product
Use Cases
Developer
Navigate to:
 I recently spoke with Matthew VanTassel, CTO at Rise to learn how he’s using InfluxDB at home to make his house smarter, to improve his online gaming and to understand his garden better. Understanding the versatility of InfluxDB at home helped him realize the full potential of InfluxDB in his job.
Caitlin: Matt Tell us a little about yourself.
Matt: I originally wanted to be a forestry engineer but moved to a different province and missed enrollment. I joined the local college’s tech program (Electronic Data Development). I always loved technology, but it wasn’t necessarily what I was aspiring to do. I got connected with a local developer, joined a small design firm, and started doing design and front-end development. I grew into doing more backend and e-commerce work and I eventually joined a startup called Radian6, which was acquired by Salesforce. I worked at Salesforce for about eight years and in that time was promoted from a Junior Developer (AMTS) to Director of Software Engineering. After Salesforce, I joined former colleagues at another startup – Rise as Chief Technology Officer (CTO).
Caitlin: Why did you join Rise and what are your responsibilities as CTO?
Matt: At Salesforce, I started with social media monitoring and engagement. When I left, I was working on Customer Journey Marketing for their Marketing Cloud product Journey Builder. Having worked with some of Rise’s team previously, it made the move easier. I was looking forward to joining a company in a new industry with new challenges. I’m having a lot of fun at Rise and I’ve been getting to learn and teach a lot! As someone who’s done a lot of home renovations and DIY projects, I’m passionate and motivated by Rise’s ambitions.
As CTO, I’m the one to call when something breaks (haha). As we don’t have an official product management team, I’m also the owner of our product roadmap, including designing and planning large feature rollouts. I work with customers to help them through issues and help my team triage bugs and design new functionality. All of the aspects of software development fall under me including: sprint deliverables, backlog prioritization, monitoring and instrumentation, deployments and software quality, including test automation.
Caitlin: How did you originally discover InfluxDB?
Matt: I found InfluxDB in 2016 while triaging a problem with servers in my HomeLab. At home I’ve created my own data backup infrastructure and I had a few DIY data backup attempts fail. I’ve lost all my data, twice it was heartbreaking to lose years of data in an instance because of a catastrophic failure. I knew I needed a better solution than my hardware RAID5 implementation. I settled on Unraid for my server and backup solution. A subreddit was a source of inspiration; I discovered the possibilities for my own HomeLab and how I could manage that infrastructure without it becoming another full-time job.
After purchasing my server from eBay, I discovered issues. There were performance issues such as slow file transfers, and my Time Machine backups for my Mac were slow. I needed to dive into the issues and figure out what was going on. The out-of-box tools provided weren’t helpful.
I wasn’t specifically looking for a time series database I knew I needed a comprehensive monitoring solution. I needed to collect metrics and events from my entire infrastructure, store, analyze, and graph the data. I considered Logstash, Kibana and ElasticSearch. I found the ELK stack difficult to implement and hard to understand.
Someone recommended InfluxDB with Telegraf and Grafana for visualization on Reddit. I found that I could run InfluxDB with Telegraf in Docker containers and was able to configure it quickly. After reading some documentation, I started playing with InfluxDB and Telegraf and began pushing metrics into InfluxDB. I started using premade dashboards available in Grafana. From learning about InfluxDB to having a dashboard was under an hour!
By monitoring metrics like CPU, memory, disk and network usage, I found the culprit of my performance issues. One of my hard drives was slowly dying and causing my entire infrastructure to suffer. Having this insight to quickly pinpoint the issues made me realize that InfluxDB and Telegraf are the pillars of my HomeLab architecture. I love how easy it was to implement and how the documentation and online community enables me to easily write my own solutions to get more data into InfluxDB.
In researching InfluxDB and other tools, I found the pieces that worked best for me and my use cases. I looked at the documentation for different programming languages and really loved what I found for Node.js.
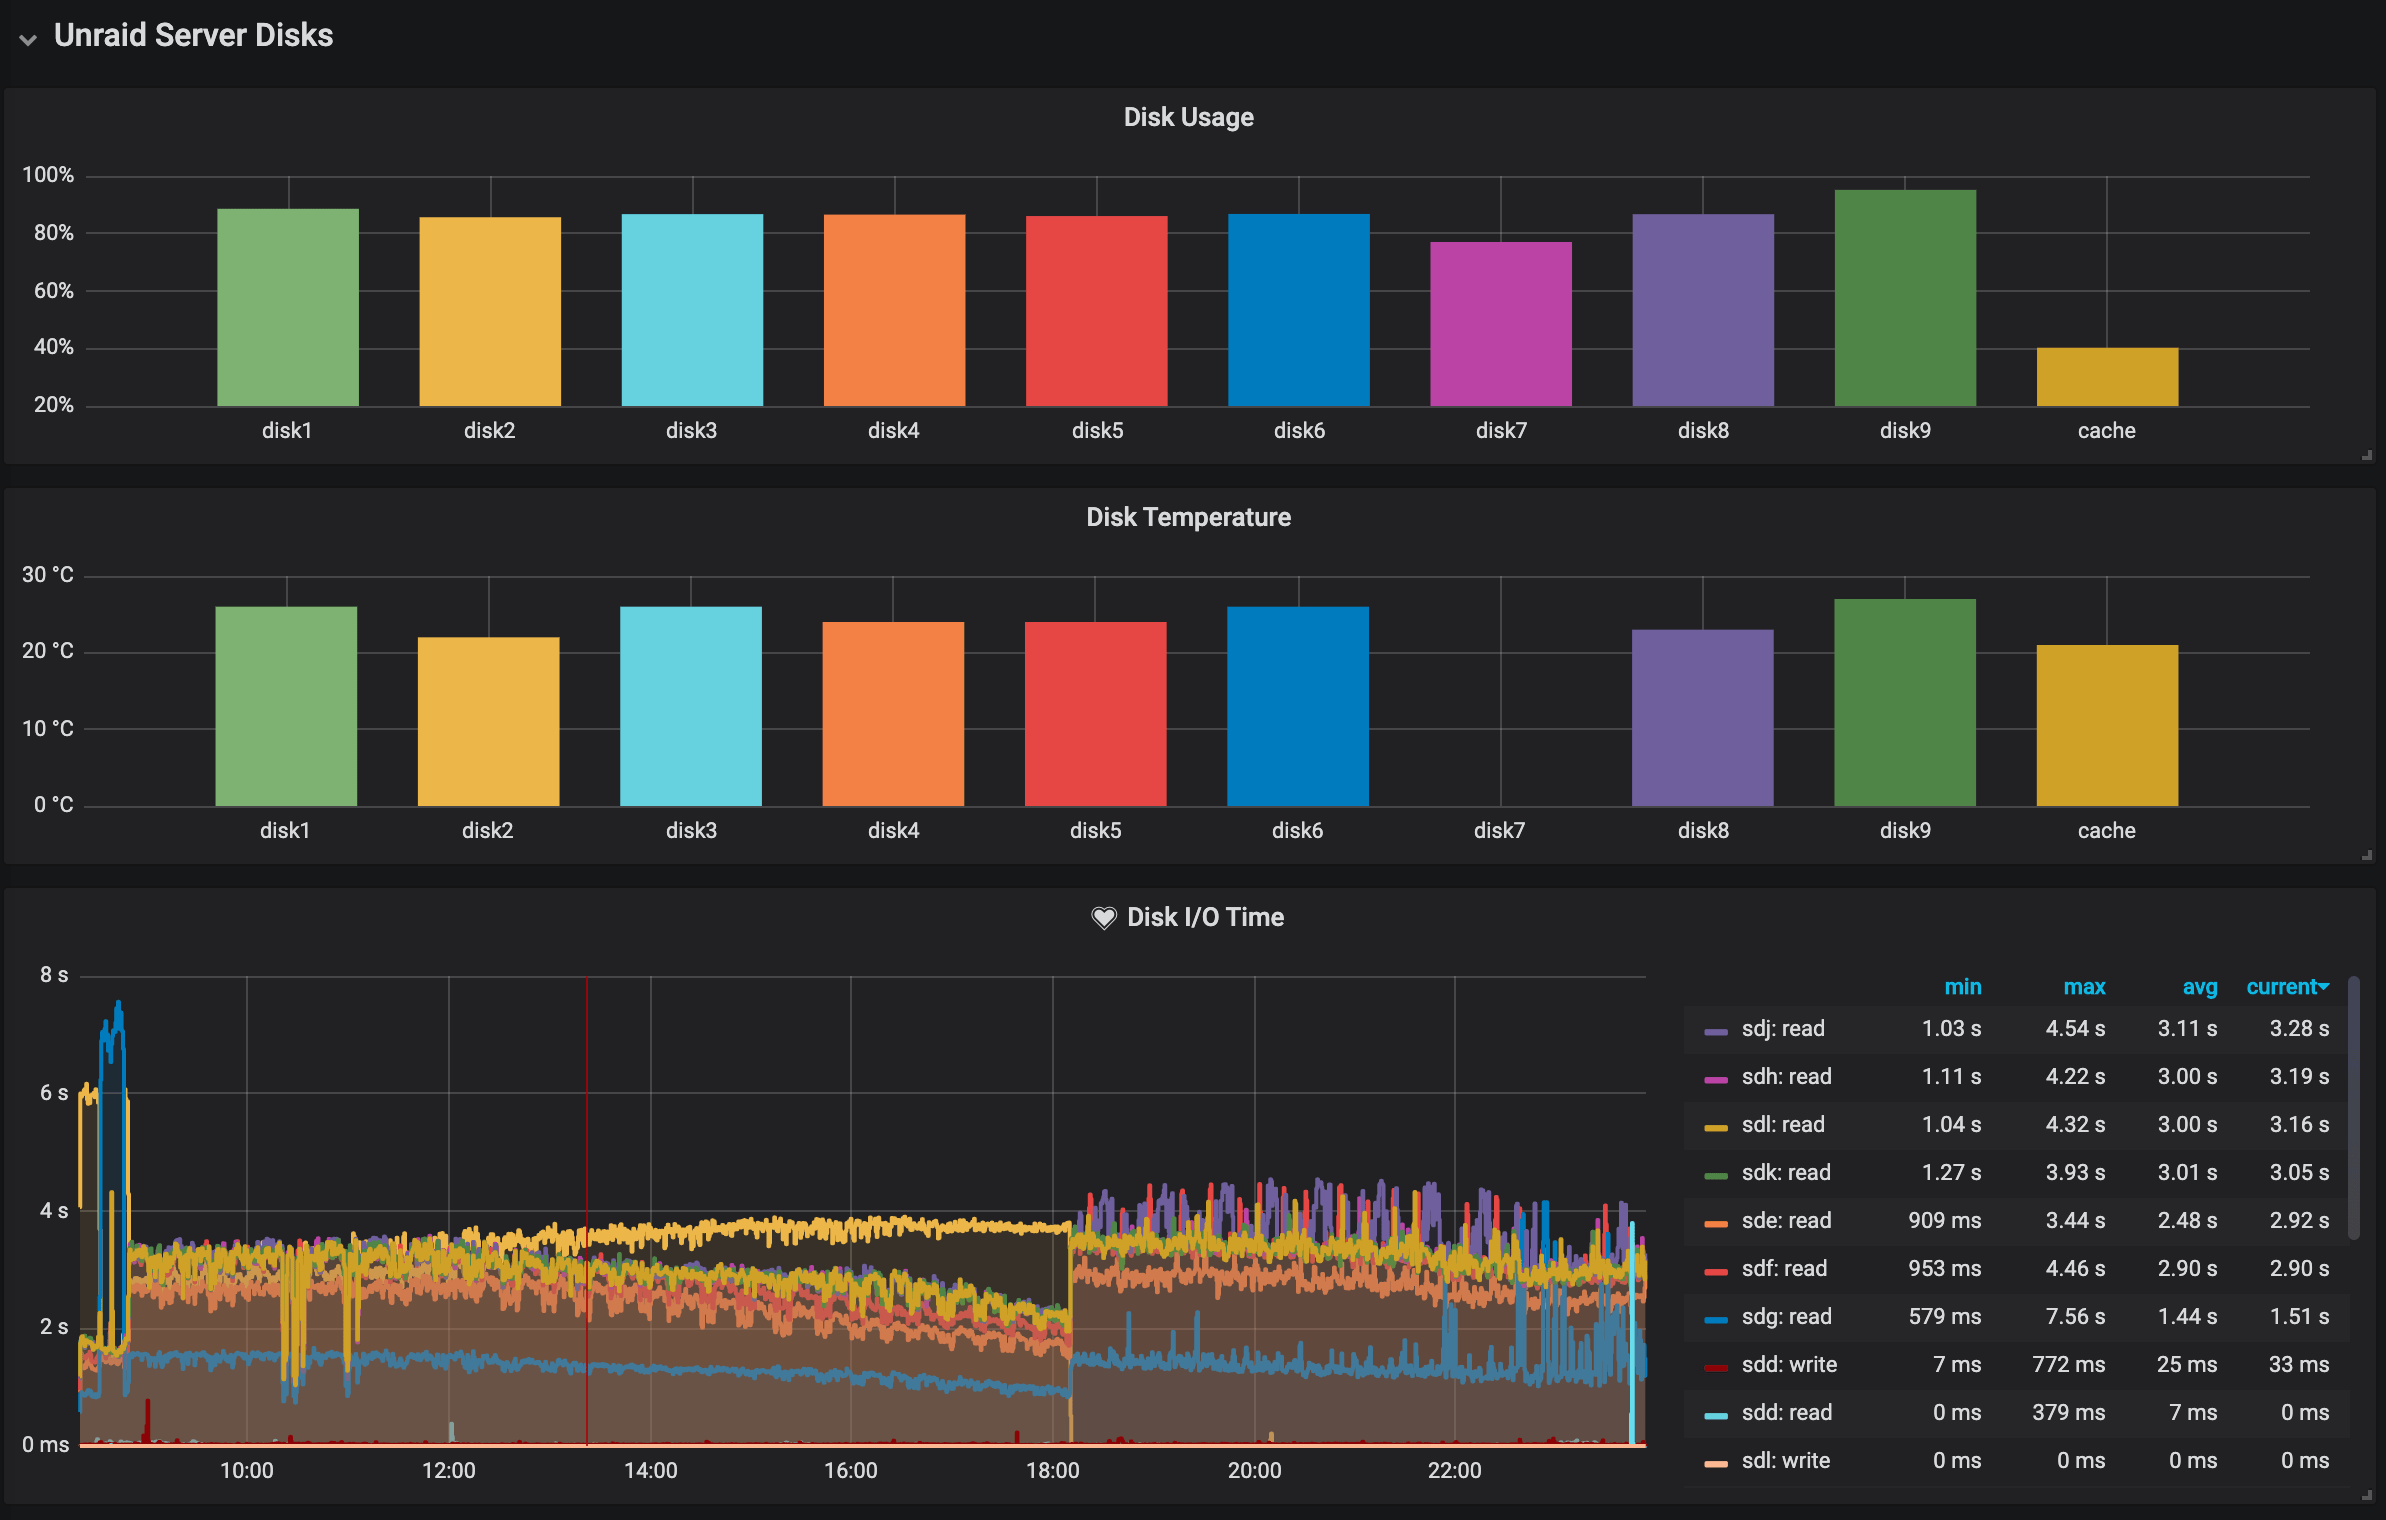
Unraid server dashboards:
I also log all of my IoT devices, servers and Docker metrics to InfluxDB. I was pleasantly surprised when I learned that my Unraid server came with an Intelligent Platform Management Interface (IPMI) protocol. It allows me to network-access my server to pull several metrics. Here are a few screenshots of dashboards I use to monitor the general health of my server and my Docker containers.


Caitlin: How else are you using InfluxDB at home?
Matt: When my son was born, I had long nights with free time (hurray for paternity leave!). I had fun experimenting and seeing what I could get into my dashboard. I was on paternity leave for 12 weeks. Lots of fun for me maybe not so much for my wife
Given previous challenges, I decided I needed a UPS as a battery backup. I was scared about what could happen during a power failure. I didn’t want to worry about data integrity, data loss or anything else. Once set up, I tested its runtime without electricity it was around 3-5 minutes. It wasn’t enough for the server to shut down. I got another battery backup and used the first for my networking hardware. I needed a way to monitor both UPS devices. Even at home, scalability became an issue as I continue to add devices to the network and infrastructure. I didn’t want to come home from work to another set of problems.
I purchased SmartThings’ DIY smart home solution. I can connect nearly any device, and I’m not locked into a particular vendor. They have an amazing API, so integration is easy. However, a common issue is the hub doesn’t let you know when batteries are dying or dead (it’s getting better). It could be something important like a glass break detector – you could have someone break into your home and not know. This was a huge concern for me. I chose not to allow it to unlock my front door as I don’t want to give that much control to an internet connected service. I like going to bed and turning off all lights and locking the doors. I’ve automated some of my lighting. Lights in bathrooms will dim during the day and will turn off roughly five minutes after you leave. All of these tools only work if the batteries are working.
I found a SmartThings Community post which helped me get disparate sensor data into InfluxDB. InfluxDB saved the day there because now I get an alert if the batteries’ values haven’t changed over a certain number of hours or days. If I see that a battery’s level hasn’t changed in five days, it’s probably dead.
All of my thermostats are connected and I’m able to see the current draw in terms of kilowatts. I chart usage in terms of dollars and compare it against the current temperature in the room. I can answer questions like “are they running when they shouldn’t be?” and “am I actually paying for what I’m using – is my monthly bill accurate?” I’m able to determine if there are issues with any of the thermostats. I created a script which polls my local power utility company for the current kWh rate at that time, and it allows me to know the exact cost for my area.
SmartThings dashboard:
The dashboard provides a great snapshot of various rooms in my home, showing the status of lights, temperature of various rooms, and battery levels of all SmartThings devices.

We built an awesome 10’ x 3’ x 4’ deep raised garden bed. The first year’s yield was amazing. The following year we added smart irrigation and I wanted to monitor sunlight, temperature, and the soil’s moisture and humidity levels. Using Raspberry Pi and GardenBot, I have all gardening metrics pushed into InfluxDB. If there’s going to be frost, I’m alerted so I know I need to start harvesting. I hope to work next year on finding a weatherproof enclosure and keep it out there all year long.
Prior to becoming a father, I was into the game series Battlefield. I’ve owned every game and have played 300+ hours of each. Through Battlefield Tracker, I can look at my stats in real-time. I wasn’t happy with how the stats were presented. I used their API, created a script to massage the data and pushed it into InfluxDB. I was then able to play and tell if I was getting better, worse, etc. Any stat I cared about, I had them available on my dashboard.
Battlefield Tracker dashboard:
Being able to track my online gaming performance has allowed me to view my stats (such as ranking within game, time played every week, and general game stats and scores) in a format I find usable.
![]()
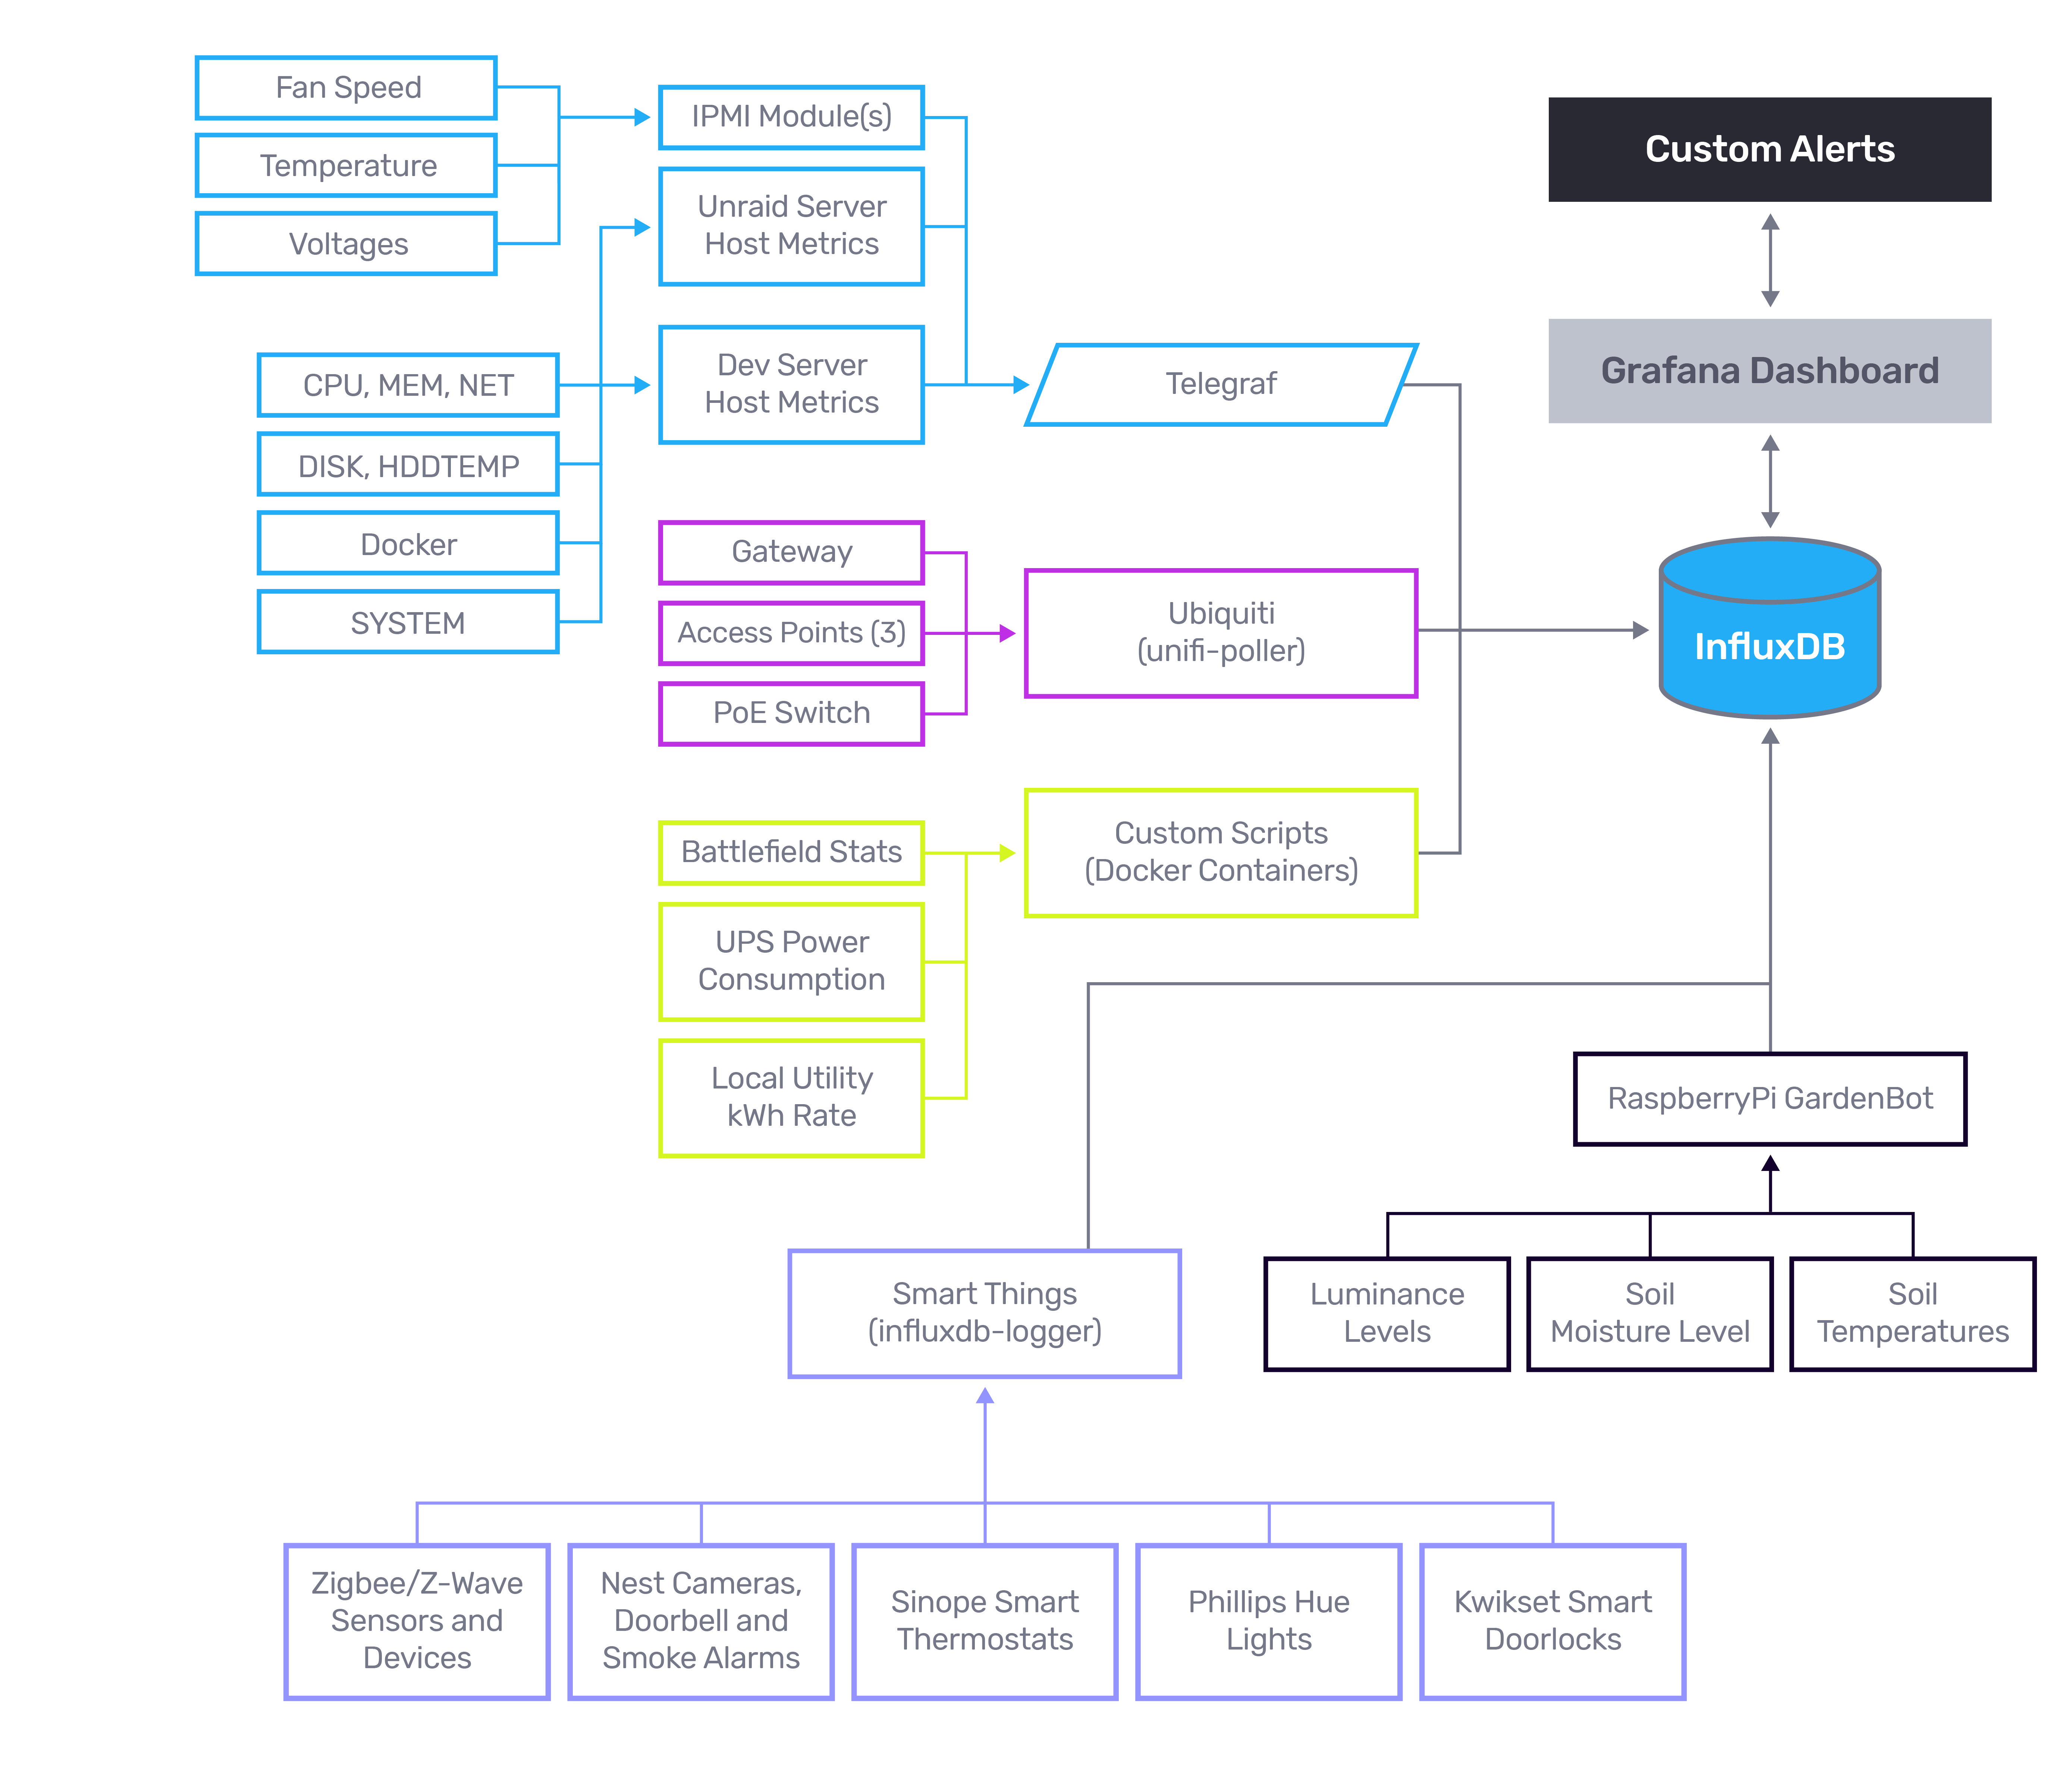
Architecture diagram:
If I can pull data from a device in or around my home, I will and it will be stored in InfluxDB. I track and graph data from my smoke alarms, and I’m able to see when smoke or carbon monoxide are detected. Event data from my Nest doorbell is pushed to InfluxDB. I can only capture on/off data from my Phillips Hue lightbulbs. This isn’t very valuable, but I’m hoping that in the future I can track consumed wattage and graph it over time. Here’s an overview of all the data I’m collecting in InfluxDB.

Caitlin: Any future projects you’re hoping to use InfluxDB for?
Matt: I’d like to improve my smart home. I use Nest cameras and I love them, but I’d like to own the videos and have control over them, and not pay a monthly fee. I’ll be moving to Ubiquiti cameras. I’m using a simple repository to pull Ubiquiti data into InfluxDB. I’d love to have stats on motion and sound. Nest currently provides this with a fee per camera which adds up quickly. I have a lot of metrics pushed into InfluxDB which I’m not currently using. I’d like to play around with that data and create some visualizations with it.
I’d like to get a whole home energy monitor like Sense. I would be able to correlate all electricity service data and all device data. I think it would be awesome to be able to graph every power-consuming electronic device in my house in a single dashboard!
By learning so much about InfluxDB at home, when I joined Rise, I realized that a time series database could help address some of the challenges we were facing. Like most companies out there, we are always working to improve our product and our customer experience. While we’re already using InfluxDB, I’m looking forward to expanding our use of InfluxDB at Rise.

To learn more about how Rise is utilizing InfluxData, check out the full story.
If you’re interested in sharing your InfluxDB story, click here.
