How InfluxDB Helps Retail Organizations Prepare for the Cyber Five Weekend
By
Caitlin Croft
updated December 14, 2025
Product
Use Cases
Developer
Navigate to:
The five-day period from Thanksgiving to Cyber Monday is known as the Cyber Five Weekend (also known as Cyber 5). Forbes estimates that people spent $3.7 billion on Thanksgiving Day in 2018. They approximate that over 165 million people shopped over the entire weekend. This is a 16.5% increase year over year. On Black Friday, people spent $6.2 billion online, with a 23.6% year-over-year growth. Online retail has become a very competitive landscape and organizations have to ensure they are doing everything possible to obtain customers and keep them returning. Detecting and fixing issues in real time impacts a company’s bottom line.
The importance of website performance and page load time
According to BBC, many customers won’t wait three seconds for a page to load before becoming impatient and considering moving to another retailer. According to a 2019 study, 53% of visitors will leave if it takes longer than three seconds to load. A half-second difference in page load time can make a 10% sales difference in sales for online retailers.
Retail websites have become slower in recent years due to connectivity speeds. Third-party connectors, like Google, Facebook, and Twitter can slow down websites due to chat and other functionalities. Some lags are worse in certain areas of the world. The average load time in Australia can be longer if the websites originate in the USA.
Ecommerce websites rely on fast load times to maintain or improve their search engine rankings, website traffic and ROI. Reducing website load times can increase the probability that a potential customer will find them through a search engine. While Google doesn’t share how they create search rankings, they have warned website owners if their sites are slow-loading. As Phillip Walton, a Google engineer articulates, “on the web, a good first impression can make the difference between someone becoming a loyal user or them leaving and never coming back”.
Retail organizations turn to InfluxDB
Retail companies around the world rely on InfluxDB to provide them with better real-time analytics and insights in their data. One of the UK’s largest retailers uses InfluxDB to monitor 700+ terminals located in its shops. The retailer is using time-stamped data to improve its online customer experience and to enable better incident alerting and management. By using InfluxDB, the European retailer is continuously improving its internal operations. One of the world’s largest food and beverage organizations uses InfluxDB to monitor one of its luxury coffee and espresso brands’ ecommerce websites. The company uses InfluxDB to collect website traffic data to monitor and improve its website performance.
Wayfair is “one of the largest online retailers for home decor and furniture.” They are headquartered in Boston, Massachusetts, operate in North America and Europe and employ over 10,900 people. They have hundreds of applications sending metrics from their data centers into InfluxDB. InfluxData’s platform has become a vital component to Wayfair’s Cyber Five Weekend monitoring and alerting systems.
Cyber 5 at Wayfair
Wayfair’s brands include Wayfair, Joss & Main, ALLMODERN, Birch Lane and Perigold. Their selection of home furnishings, decor, home improvement and housewares products amount to over 14 million items. In September 2018, they reported that in the last twelve months they generated $6.2 billion in net revenue.
According to Nirag Shah, CEO and co-founder of Wayfair, “We see the overall cadence of holiday shopping changing with online becoming the clear leader throughout the holiday weekend, driving outsized growth. As the broader shift from brick and mortar to online shopping continues to gain momentum, Wayfair is capturing a leading market share in the home goods category.”
In 2018, Wayfair estimated they had customers purchasing faucets or vanities every 15 seconds, Christmas trees every ten seconds, sofas every nine seconds, mattresses every six seconds, barstools every five seconds and rugs every one and a half seconds. Most customers purchased smaller goods like accessories, linens and furniture. In 2018, the heaviest item shipped was a 3,000 pound wooden shed. Wayfair reported “a 58 percent increase year-over- year in direct retail gross sales, defined as dollars of order intake, for the five-day peak shopping period of Thanksgiving Day through Cyber Monday”. The highest peak during the five days was Cyber Monday.
Customers’ buying patterns are evolving as more retail companies increase their ecommerce presence. Through holiday promotions and flash sales, Wayfair is seeing shifts in the marketplace. In 2018, Shah stated: “We anticipated the continued shift of dollars online and were well positioned to capture that growth on Black Friday and throughout the weekend”.
Wayfair's IT infrastructure
Wayfair’s team has eight data centers. Three are located in Boston, Seattle and Ireland. Additionally they have several cloud data centers with Google Cloud. This provides the team with complete redundancy. They use DNS to control the set of service names. This helps determine which backend clusters are active and which are in standby mode. Wayfair uses a multi-stage Kafka pipeline to pull metrics data from local data centers where data is collected into central locations for ingestion into InfluxDB, the purpose-built time series database.
In the last decade, Wayfair has been improving its software development and data center operations. Due to the extreme spikes in business during the US Thanksgiving holiday week, Wayfair knew it needed to bolster its infrastructure to handle higher data volumes. They also needed better analysis and visibility into their data. They have two Wayfair Operation Centers (WOC’s) in Boston and Berlin. Between the two WOC’s, they have 24x7 coverage. They are constantly analyzing their IT infrastructure based on important parameters.
To ensure the best customer experience, they track customer activity throughout the purchasing process. They have event trackers, timers and other metrics coming from over 2,000 virtual machines running hundreds of applications. Their data is used by their developers, internal alerting engine and other stakeholders. They work with their marketing team to understand when email communications are sent out. Understanding when campaigns are scheduled, helps them understand when there will be peaks in website traffic.
Example of Wayfair's data pipeline for one of their data centers
The below diagram shows the steps involved in Wayfair’s data pipeline.
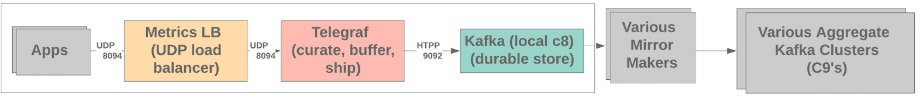
The first four steps occur on the local data center where the application resides. All of these components are local to each data center:
- Metric Load Balancer (Metric LB): Enables the team to send a metric without waiting for delivery confirmation. Wayfair needs to ensure the metrics are collected correctly and aren't lost.
- Curate: Use Telegraf to drop a bad tag or block a bad metric.
- Buffer: Use Telegraf to keep metric data and write as much to Kafka.
- Ship: Use Telegraf to send the data to Kafka.
In the last two steps, data is consolidated from all eight data centers into a single Kafka cluster rather than spread across different clusters.
Wayfair's production backend
The backend of Wayfair’s primary production systems is shown in the diagram below:
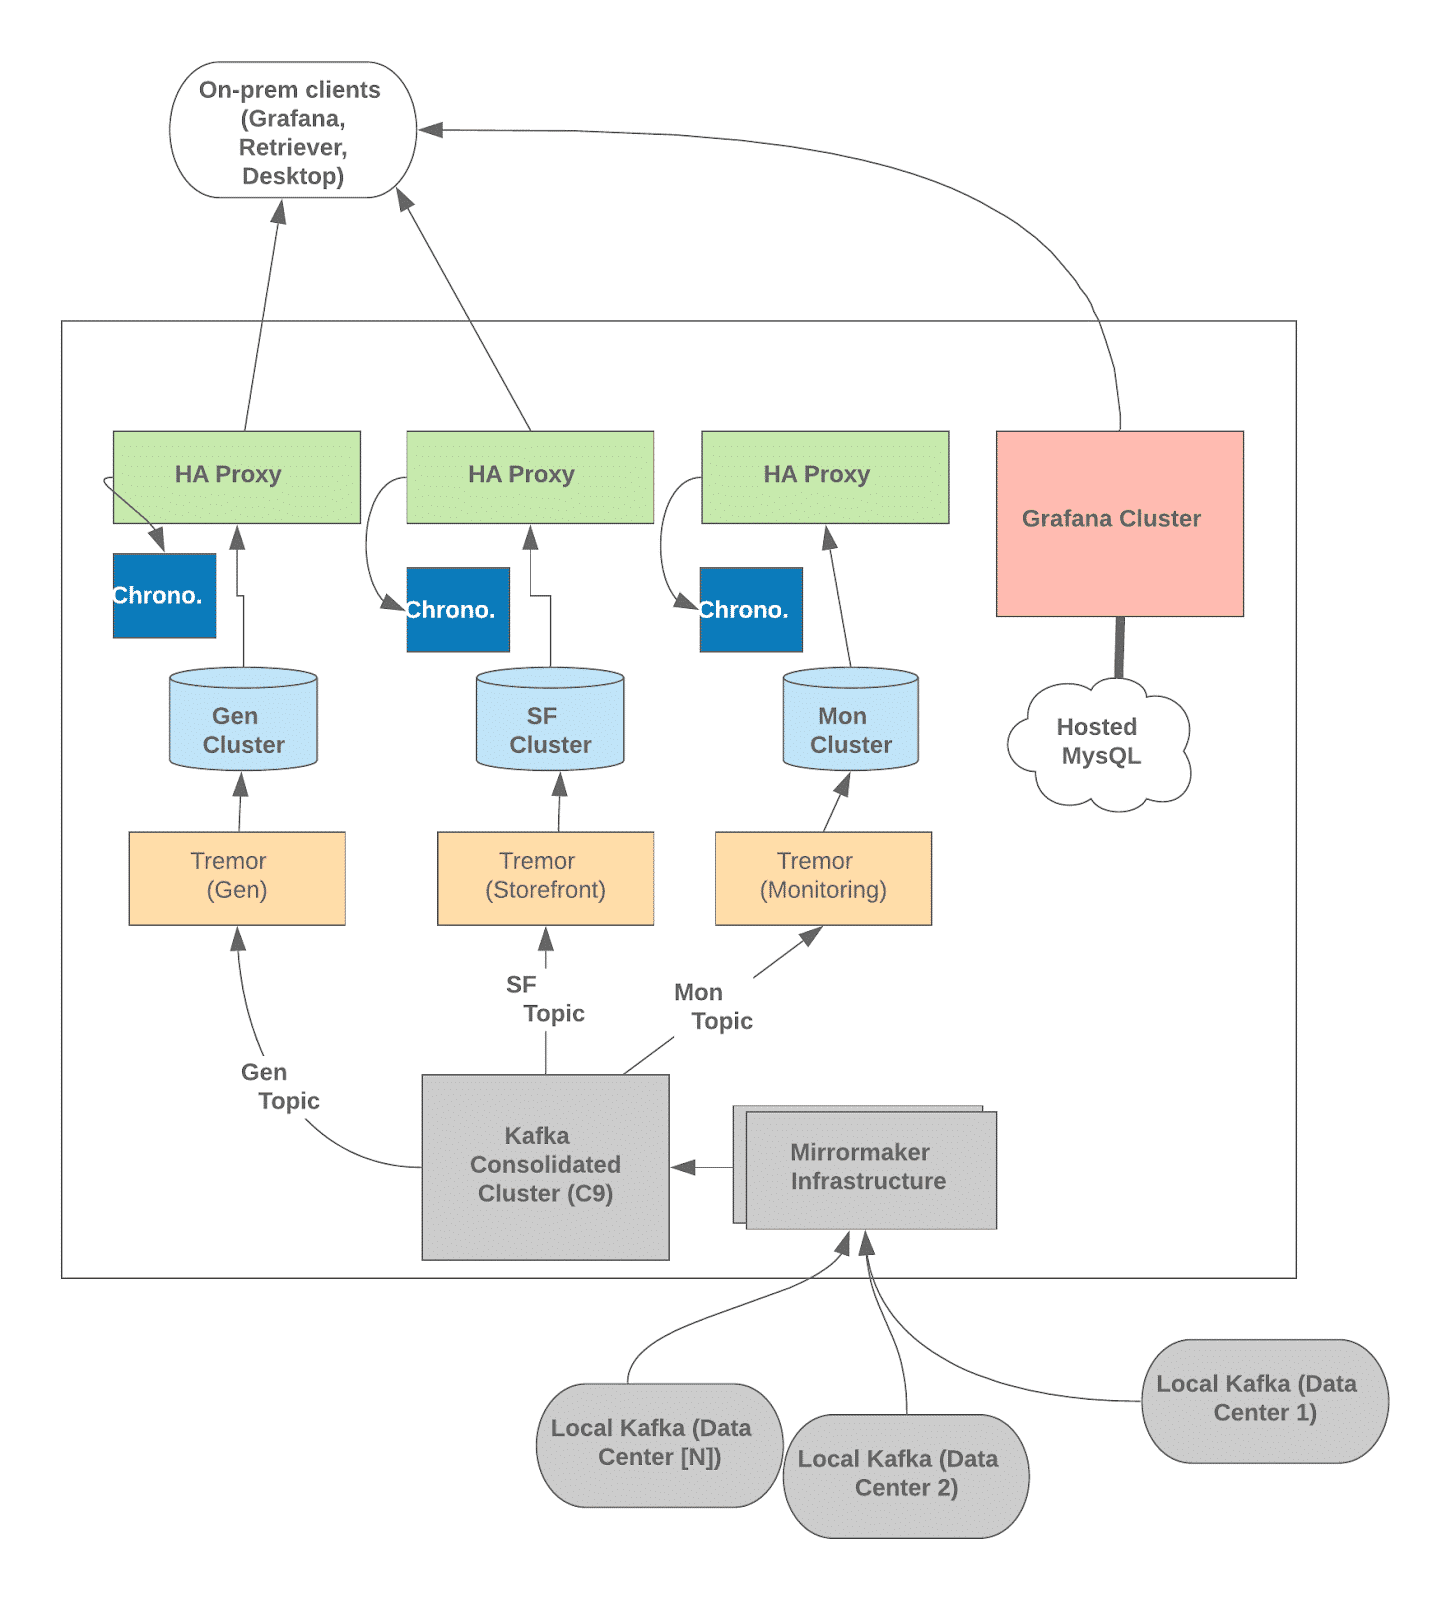
The backend’s dataflow is as follows:
- Mirrormaker pulls data from their local data pipelines (i.e. diagram 1) and consolidates the data into larger Kafka clusters.
- Data is ingested into the cluster specific to the content type.
- Tremor is an application that Wayfair built to pull data from Kafka and write it to InfluxDB. Tremor will be shared with the open source community in 2020.
- Wayfair uses clusters to segment their traffic data, such as "Gen" for General, "SF" for Storefront and "Mon" for Monitoring.
- Every cluster has Chronograf running.
- Having high availability (HA) is important for Wayfair, so they use a HA proxy in every cluster.
Wayfair uses InfluxDB for real user monitoring (RUM)
Wayfair’s Storefront Engineering team values accurate performance monitoring. They deploy code changes constantly, which directly affects their customer-facing websites. Every code change has the potential to positively or negatively impact performance. Understanding page load times helps catch regressions, find opportunities to speed up systems and determine whether the improvements worked in reality.
Their team is interested in all web performance metrics including: server-side, synthetic tests and real user monitoring (RUM). Server-side metrics are easy to build, but don’t catch issues that occur on the client side. Synthetic user monitoring can only provide information on client performance based on predetermined specifications. Synthetic is limited to specific URLs and an artificial test environment.
RUM uses JavaScript and API’s to record load times experienced by customers. By tracking real customers, Wayfair is able to discover issues that normally would be invisible to their systems. This is increasingly important as their websites are becoming more complex (due to resources, images, fonts and scripts from third-party servers and networks). Wayfair customers’ network conditions, like latency and bandwidth, can contribute to unexpected experiences online.
Wayfair collects 50 million RUM data points across eight sites daily, hundreds of page types and thousands of devices. These devices include mobile phones, tablets and computers. During the Cyber Five Weekend, Wayfair knew they needed to be able to handle 3x-5x their typical traffic at the highest peaks. InfluxDB has improved visibility into their data and helped improve customer experience. Their platform is scalable and able to address future needs.
About eight years ago, Wayfair started using Graphite as their time series database. They used the tool for charts and alerts. Over time they enhanced the system by adding more validation and capabilities. They added the ability to break out metrics by web browsers. Their RUM dashboards became helpful at pinpointing issues. However, there were quirks with their system that made data analysis hard. As Hagan points out, “RUM is particularly challenging to measure and visualize due to the wide range of values and outliers.” The outliers were significantly skewing their data, and they found that Graphite was susceptible to these issues. Prior to InfluxDB, Wayfair’s data pipeline included pushing data between data centers using UDP. While it was fast, it was missing some desired components.
Wayfair started evaluating InfluxDB in 2016 and eventually switched to InfluxDB Enterprise as their time series platform. They chose InfluxData’s on-premises offering as they wanted to manage their own virtual machines and high-volume clusters. They valued that it wasn’t vulnerable to the same issues as Graphite. InfluxDB uses a true median calculator; therefore, their data isn’t skewed. Wayfair’s team worked directly with InfluxData’s team to ensure they were using the purpose-built time series database most effectively. They found that InfluxDB’s schema took a little while to set up, but it was more powerful and flexible. Using InfluxDB and Grafana, Wayfair was able to create customized dashboards.
Improving their customer experience is important to Wayfair’s team. Understanding how and when customers interact with their online stores is vital to their bottom line. They started monitoring with a new metric: Time to Interactive (TTI). Using an API, they are able to determine when a site is ready to quickly respond to customers’ requests. They are also considering using Walton’s First Input Delay measurement, a measure of site interactivity.
Wayfair has become a strategic customer for InfluxData. As active members of the InfluxDB community, they have already contributed Telegraf plugins. To learn more about how Wayfair is using InfluxData’s platform, check out the full story.
If you’re interested in sharing your InfluxDB story, click here.
