How Predefined Dashboards in InfluxData's Chronograf Make Metrics Simple
By
Katy Farmer
updated December 14, 2025
Product
Use Cases
Developer
Navigate to:

I talk about metrics a lot. Usually, I’m muttering about the importance of monitoring while I watch YouTube clips of cats not making jumps. Now, we’re going to talk about one way we can access those metrics easily. Just as I’m an animal lover who sometimes wants to see cats fail, I’m a command line lover who sometimes needs to visualize data.
The Problem
Visualizing data is a particularly hard problem, but we don’t want to have to think about that when we use visualization tools. We want our data available as quickly and easily as possible. Given that, I was particularly excited to see the latest release of Chronograf (1.7.3), which includes improved onboarding that gave me just what I was looking for.
The Experience

I’m using MySQL as the database for a few of my Rails apps, and I want a dashboard to visit when things inevitably go wrong (after all, these apps were developed by past Katy, and she can’t be trusted). There are some specific metrics I care about regarding my database, and I don’t necessarily want to write a query when things are starting to go wrong.
I’m using MySQL as the database for a few of my Rails apps, and I want a dashboard to visit when things inevitably go wrong (after all, these apps were developed by past Katy, and she can’t be trusted). There are some specific metrics I care about regarding my database, and I don’t necessarily want to write a query when things are starting to go wrong.
Collecting Metrics with Telegraf
Metrics about the database live in the internal performance database, which for MySQL is the performance_schema database (and the more human-readable sysdatabase). Now, we could query this database to find what we’re looking for, but we can expedite this process by using the Telegraf MySQL plugin to send those metrics straight to InfluxDB. If you’re thinking that it sounds silly to send metrics from one database to another, you’re right but not if our plan is to keep that data long-term or build useful visualizations from it. Keep in mind that what we want is a dashboard to view when things are behaving dangerously.
Building the Dashboard
We’ve done the hard part, which was pretty easy: Telegraf is sending our MySQL metrics to InfluxDB. Now let’s do the even easier part: building the dashboard in Chronograf.
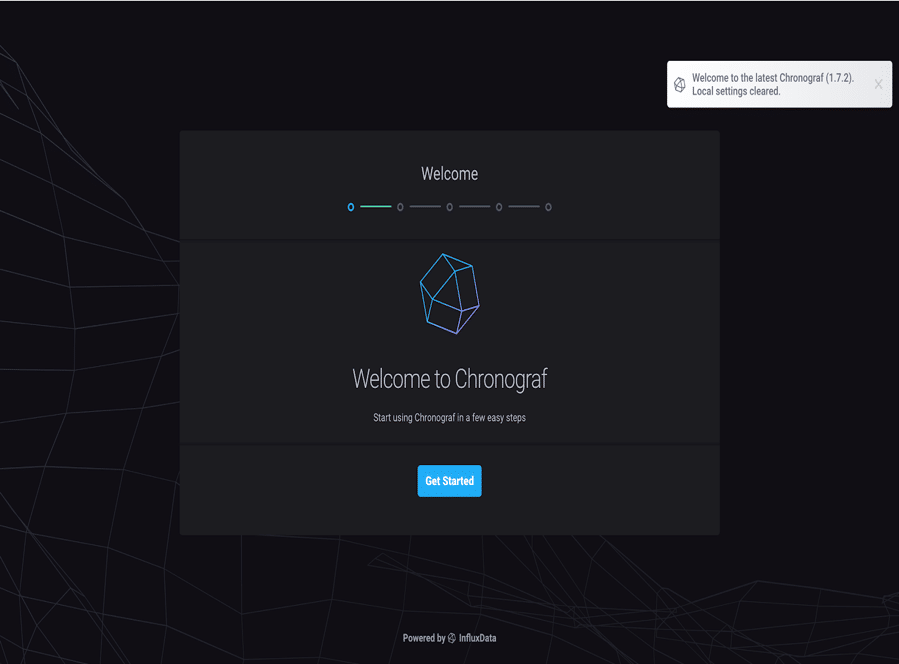
After installing Chronograf (1.7.3 or higher), we get a warm welcome, which is new as of the 1.7.x line.
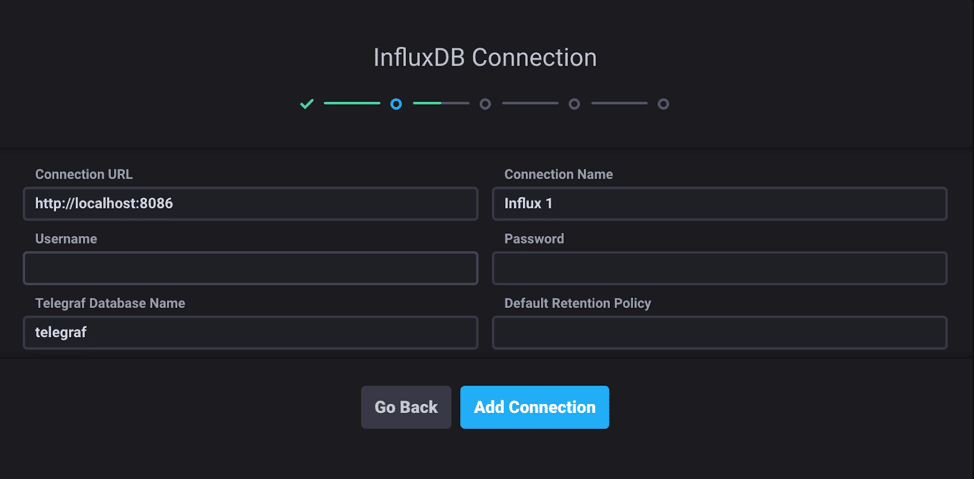
Through these onboarding steps, we can configure our InfluxDB settings or leave them as the default for now.
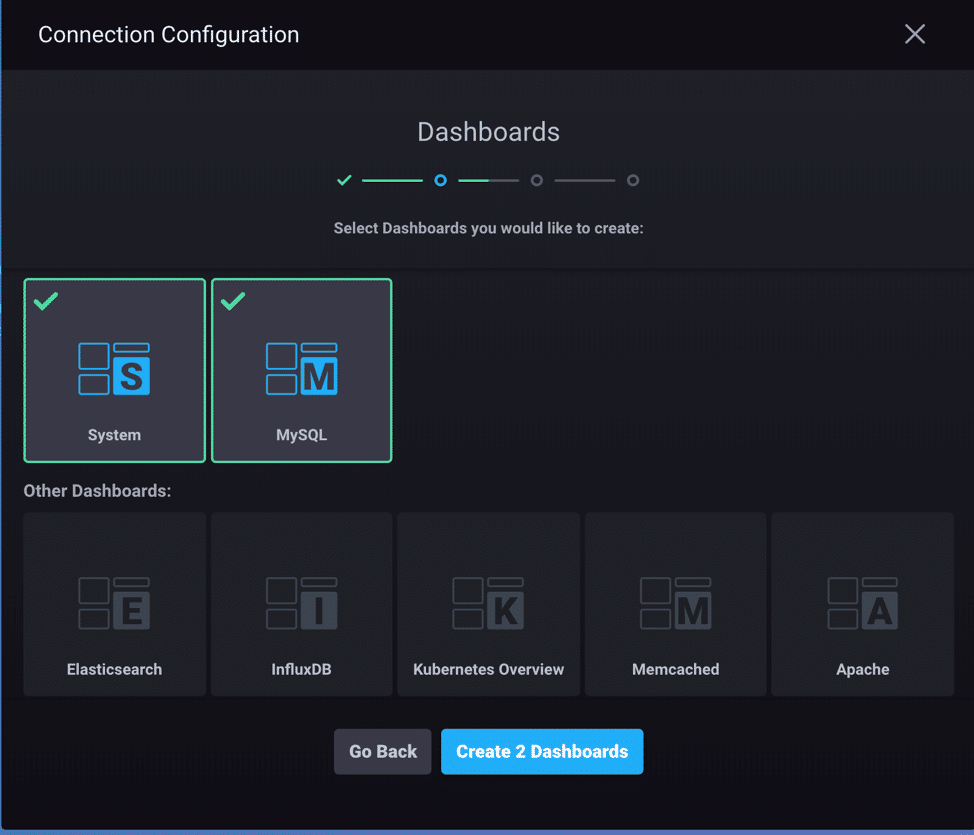
When we reach the “Dashboards” section, we can see that there are suggested dashboards for our Source; in this case, both MySQL and System (which collects things like local CPU usage, memory, etc.) are suggested. And we didn’t have to do anything besides send those metrics in via Telegraf. So, let’s set up both! Who knows what we (okay, I) might break?
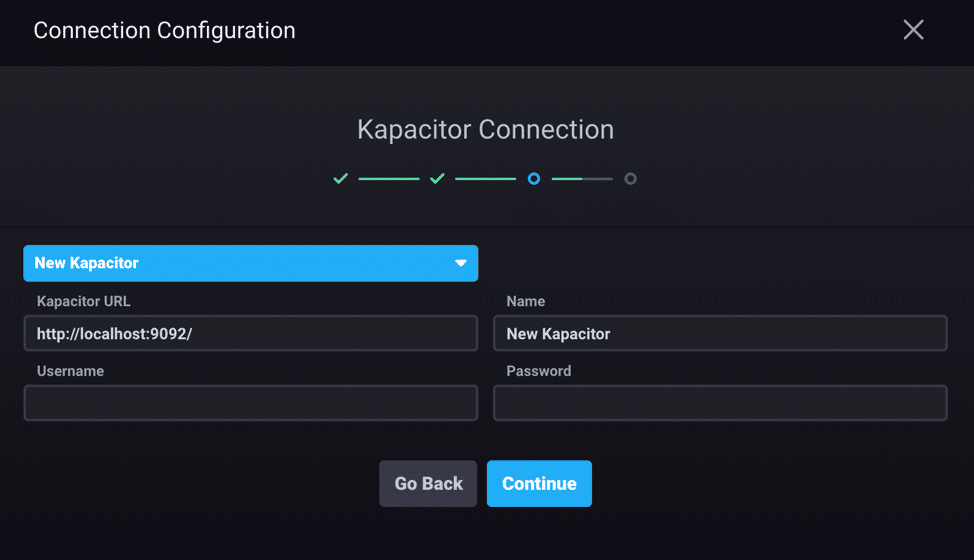
All that’s left in the onboarding is to set up Kapacitor, but we can leave the defaults in place for now and continue onward.
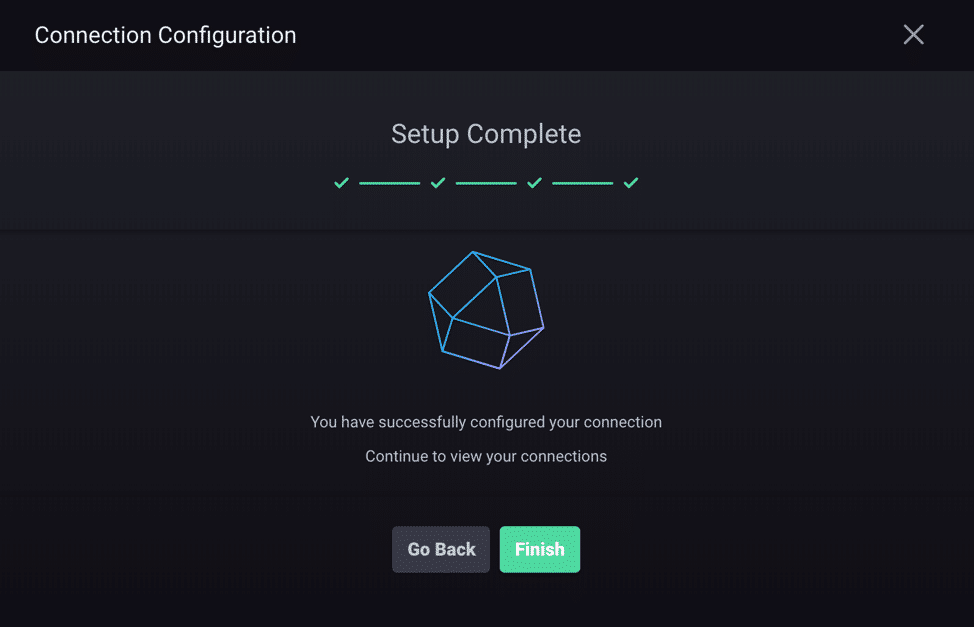
We’re done setting up Chronograf. We clicked, like, five times, so hopefully, we’re not so tired we can’t click just a few more times. All we have to do is visit the Dashboards tab to see our predefined dashboards in action.
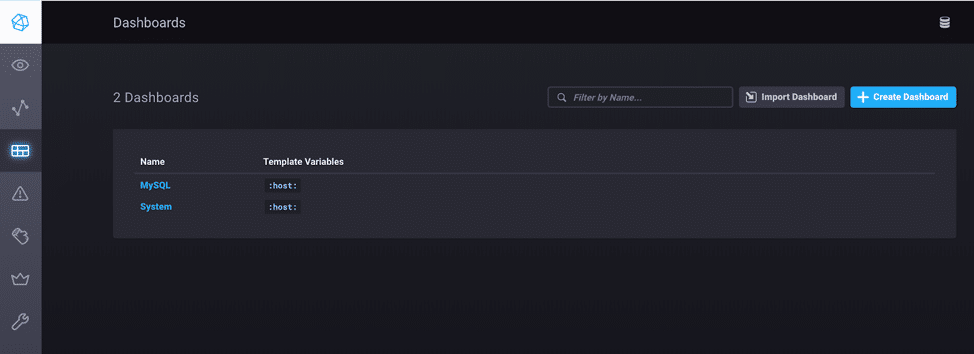
Both of the dashboards we selected during setup are listed (MySQL and System), but let’s make sure they actually work.
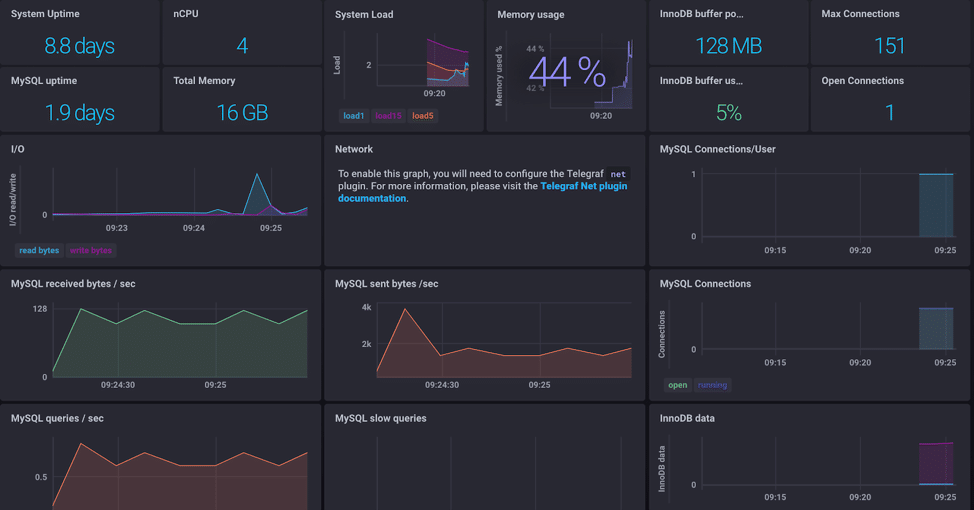
Look at all of these beautiful metrics. We can see the number of MySQL connections, queries per second, bytes sent and received per second, and lots more. All I had to do was leverage the metrics I was already collecting with Telegraf.
Let’s check on the System dashboard.
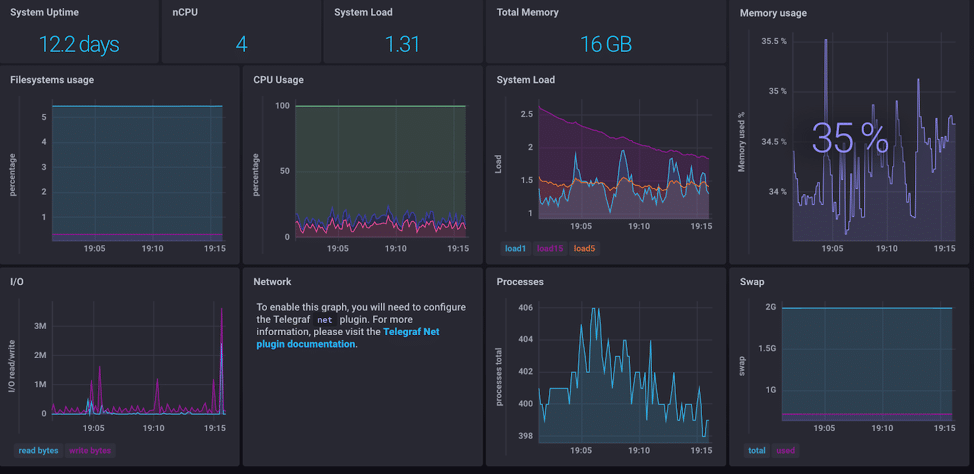
As usual, my local machine needs to be restarted but is otherwise working like a champ.
Summary
It’s easier than ever to set up predefined dashboards in Chronograf, which I’ve been waiting for. While the feature existed before, it was a bit clunky and out of the way. Now, I can do what I’m best at: clicking through defaults. There are also predefined dashboards for metrics from Kubernetes, Redis, Apache and more so we can monitor the services that matter to us with as little work as possible. Set up the newest version of Chronograf with InfluxDB and tell me how it works for youI’ll be watching clips of dogs missing food in slo-mo.
