Part 6: How-to Create an IoT Project with the TICK Stack on the Google Cloud Platform
By
Todd Persen
updated December 14, 2025
Product
Use Cases
Navigate to:
Part 6 : Setting up Alerts with Kapacitor
In this part, we are going to take a look at Kapacitor, the “K” in the TICK stack. Kapacitor is a stream and batch processing engine, that is both a data processor and an alerting engine. In our case, we are going to specifically use it in the following way:
- Define an Alert that monitors the temperature data and checks if it crosses a threshold of 30 degrees Celsius.
- If the temperature reported is greater than that, we would like to log this record in a file and also raise a notification in our Slack channel.
The capabilities of Kapacitor are much beyond that and it comes along with a complex engine to detect data patterns and funnel that to multiple channels that it supports straight off the bat. In our case, logging the high temperature in a file and raising a notification via Slack are just a couple of integrations that it can do.
So let’s get started with setting up Kapacitor and seeing our temperature alert in action.
Installing Kapacitor
We are going to run Kapacitor on the same instances as our InfluxDB instance. This instance is running on the Google Cloud, so the best way to install this software is by SSH’ing into the instance.
To set up Kapacitor into our VM instance (the instance running InfluxDB), we will need to SSH into the instance. Follow these steps:
- Login to Google Developers Console and select your project.
- From the sliding menu on top, go to Compute --> Compute Engine --> VM Instances
- You will see your VM instance listed.
- Look out for the SSH button at the end of the row.
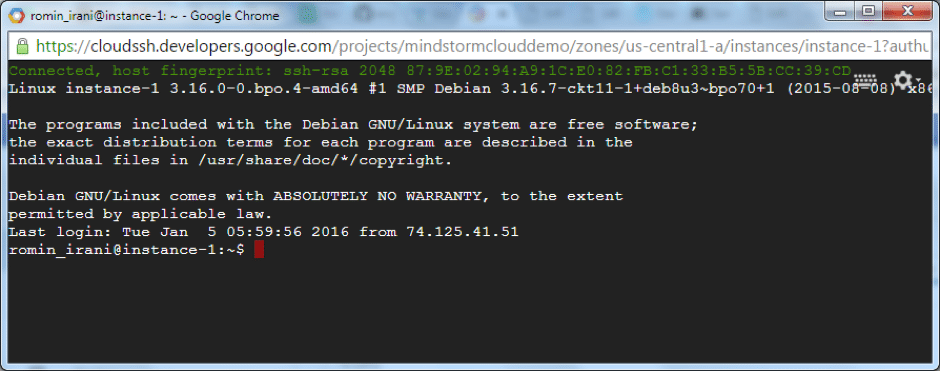
- Click that and wait for the SSH session to get initialized and set up for you. If all is well, you should see another browser window that will transport you to the VM instance as shown below:
 The next thing is to install Kapacitor and since this a Debian Linux that we had opted at the time of creating the VM, we can follow the steps for installing Kapacitor as given at the official documentation site.
wget https://s3.amazonaws.com/kapacitor/kapacitor_0.10.1-1_amd64.deb
sudo dpkg -i kapacitor_0.10.1-1_amd64.deb
On successful installation you will ideally have two applications that we will be using:
- `kapacitord` : This is the Kapacitor daemon that will need to be running to process the data coming into InfluxDB.
- `kapacitor` : This is the CLI that we will use to talk to the kapacitord daemon and setup our tasks, etc.
Generating a default Configuration file
Kapacitor is a powerful product with multiple configuration options that makes it challenging to create an initial configuration file. Hence to make it easier, we can take the help of the kapacitord application to help us generate a default configuration file.
We go ahead and generate a default configuration file : kapacitor.conf as shown below:
$ kapacitord config > kapacitor.confThe Configuration file (kapacitor.conf) has multiple configuration sections including connection to InfluxDB, the various channels that one can configure and more.
Here are few configuration sections of interest in the kapacitor.conf file:
- `[http]` : This is the API Endpoint that kapacitord will expose and which the Kapacitor client will communicate to.
- `[influxdb]` : On startup, Kapacitor sets up multiple subscriptions to InfluxDB databases by default. This section has various configuration properties for connecting to the InfluxDB instance. You will notice that it is a localhost url since InfluxDB instance is running on the same instance.
- `[logging]` : This section has the default logging level. This can be changed if needed via the Kapacitor client.
- `[slack]` : The section that we are interested in our tutorial is to get notified via Slack. The various properties include the channel in Slack that we want to post the message to, the incoming Webhook URL for the Slack Team, etc. We shall look at this a little later in this tutorial, when we set up the Slack Incoming Webhook Integration.
Start the Kapacitor Service
We do not make any changes to our kapacitor.conf file at the moment. We simply launch the Kapacitor Service as shown below:
$ kapacitord -config kapacitor.confThis starts up the Kapacitor Service and you will notice towards the end of the console logging that bunch of subscriptions are setup, including that on the temperature_db database that we are interested in.
Kapacitor Client
The Kapacitor CLI (kapacitor) is the client application that you will be using to communicate to the Kapacitor Daemon. You can use the client to not just configure Alerts, enable/disable them but also check on their status and more.
One of the commands to check if there are any Tasks setup for Kapacitor is via the lists command. We can fire that as shown below:
$ kapacitor list tasks
Name       Type      Enabled   Executing Databases and Retention Policies
This shows that currently there are no tasks configured.
Create the High Temperature Alert Task via TICKscript
The next thing we are going to do is setup the Task to detect if the temperature is greater than 30 degrees Celsius from Station S1. The Task Script is written in a DSL called TICKscript.
The TICKscript for our High Temperature alert is shown below:
stream
   .from()
   .database('temperature_db')
   .measurement('temperature')
   .where(lambda:"Station" == 'S1')
   .alert()
   .message('{{index .Tags "Station" }} has high temperature : {{ index .Fields "value" }}')
   .warn(lambda:"value" >= 30)
   .log('/tmp/high_temp.log')
Notice that it is intuitive enough to read the script as given below:
- We are looking at working in the stream mode, which means that Kapacitor is subscribing to realtime data feed from InfluxDB v/s batch mode, where Kapacior queries InfluxDB in batches.
- We then specify which InfluxDB database via database(). This will monitor the stream of data going into our temperature_db database.
- A filter is specified for the Tag Station. The value that we are interested in is the "S1" station.
- For the above criteria, we would like to get alerted, only if the measurement value is greater than 30.
- If the value is greater than 30, then we would like to log that data in a temporary file at this point (we will see the Slack integration in a while).
- The message that we would like to capture (i.e. a custom message) is also specified. For e.g. "S1 has high temperature : 30.5".
We save the above TICKscript in temperature_alert.tick file.
Configure the High Temperature Alert Task
The next step is to use the Kapacitor client to define this task and make it available to Kapacitor. We do that via the define command as shown below:
$ kapacitor define \
-name temp_alert \
-type stream \
-tick temperature_alert.tick \
-dbrp temperature_db.default
Notice the following parameters:
- We name our Task as temp_alert.
- We specify that we want to use this in stream mode.
- We specify the TICKscript file : temperature_alert.tick.
- The Database Retention Policy is selected as the default one (infinite duration and a replication factor set to the number of nodes in the cluster) from the temperature_db database.
We can now look at the tasks that the Kapacitor Service knows about as given below:
$ kapacitor list tasks

Name                 Type      Enabled   Executing  Databases and Retention Policies
temp_alert           stream    false     false      ["temperature_db"."default"]
You can see that the Enabled and Executing properties are set to false.
Dry Run : Temperature Alert
One of the challenges that you face while developing an Alerting system is to test it out before it goes into Production. A great feature of Kapacitor is to do a dry run of the Alert based on a snapshot/recording of data.
The steps are straightforward and at a high level we have to do the following:
- Make sure that the Alert (temp_alert) is not enabled. We verified that in the previous section.
- We ask Kapacitor to record a stream of data that is coming into InfluxDB for a given interval of time (say 20 seconds or 30 seconds). While recording this data, we ensure that some of the data coming in meets the condition to fire the Alert as we are expecting. In our case, if the temperature is above or equal to 30, then it should log the data.
- Kapacitor records the data in the defined time interval above and gives us a recording id.
- We then replay that data and tell Kapacitor to run it across the Alert (temp_alert) that we have defined.
- We check if our TICKscript associated with the alert is working fine by checking our log file (/tmp/high_temp.log) for any entries.
- If the Test runs fine, we will then enable the task.
Let’s get going on this. We already have our temp_alert not enabled i.e. the value for the Enabled attribute is false, as we saw in the kapacitor list tasks command.
The next step is to ask Kapacitor to start recording the data for our alert. We ask it to record the data in stream mode (the other options are batch and query). We specify the duration as 30 seconds and also specify the task name (temp_alert).
kapacitor record stream -name temp_alert -duration 30sThis will make Kapacitor record the live stream of data for 30 seconds using the database and retention policy from the task specified. If your data is streaming in, give it a total of 30 seconds to record it. Alternately, you can also generate INSERT statements using Influx client.
Just ensure that the time interval from the first INSERT to the last INSERT is equal or more than the duration specified (30 seconds), where you send data via manual INSERT statements or even if it is streaming in.
The above command will complete and will output a recording id, an example of which is shown below:
fbd79eaa-50c5-4591-bbb0-e76f354ef074
You can check if the recordings are available in Kapacitor by using the following command:
kapacitor list recordings <recording-id>A sample output is shown below:
ID                                      Type    Size      Created
fbd79eaa-50c5-4591-bbb0-e76f354ef074    stream  159 B     17 Feb 16 22:18 IST
A size greater than zero indicates that the data was recorded. Now, all we need to do is replay the recorded data against the Alert that we have specified. The -fast parameter is provided to replay the data as fast as possible and not wait for the entire duration that the data was recorded against (in our case 30 seconds)
kapacitor replay -id $rid -name temp_alert -fastwhere $rid is a variable that contains the value of the Recording Id.
The data that I had used during the recording phase contained values over 30 degrees centigrade for some of the records and that is exactly what I would expect the Alert to be fired upon and the records to be written to the /tmp/high_temp.log file.
On checking the file /tmp/high_temp.log for entries, we do notice the entries as shown below:
$ cat /tmp/high_temp.log
{"id":"temperature:nil","message":"S1 has high temperature : 31",
}
{"id":"temperature:nil","message":"S1 has high temperature : 32",
}
{"id":"temperature:nil","message":"S1 has high temperature : 31",
}Enable the Task
Now that we have validated that our Alert is working fine, we need to go live with it. This means we need to enable the task as shown below:
$ kapacitor enable temp_alertYou can now check up on the details of your task via the show command as shown below:
$ kapacitor show temp_alertThis will print out details on the task along with the TICKscript for the Task as given below:
Name: temp_alert
Error:
Type: stream
Enabled: true
Executing: true
Databases Retention Policies: ["temperature_db"."default"]
TICKscript:
stream
   .from()
   .database('temperature_db')
   .measurement('temperature')
   .where(lambda:"Station" == 'S1')
   .alert()
   .message('{{index .Tags "Station" }} has high temperature : {{ index .Fields "value" }}')
   .warn(lambda:"value" >= 30)
   .log('/tmp/high_temp.log')

DOT:
digraph temp_alert {
stream0 -> stream1 [label="0"];
stream1 -> alert2 [label="0"];
}
Note that the Enabled and Executing properties are now true.
High Temperature Alert in Action
If the temperature values are coming in, the Task will be executed and the record will be written to the log file. A specific record from the /tmp/high_temp.log file is shown below:
{"id":"temperature:nil","message":"S1 has high temperature : 30","time":"2016-01-22T06:37:58.83553813Z","level":"WARNING","data":{"series":[{"name":"temperature","tags":{"Station":"S1"},"columns":["time","value"],"values":[["2016-01-22T06:37:58.83553813Z",30]]}]}}Notice that the message attribute has the message along with other tags, values and timestamp.
This confirms that our High Temperature Alert Task has been setup correctly and is working fine. The next thing to do is to set up the Slack Channel Notification.
Slack Incoming Hook Integration
The Slack API provides multiple mechanisms for external applications to integrate with it. One of them is the Incoming Webhooks Integration. Via this integration mechanism, external applications can post a message to a particular channel or an user inside a Slack Team.
Kapacitor supports posting messages to your Slack Team via this mechanism, so all we need to do is provide the details to the Kapacitor configuration, specify the slack notification in our TICKscript and we are all set.
Enable Slack Channel
The first step is to enable this integration inside of your Slack Team. To do that, we will assume that you are logged in to your Slack Team and you are the Administrator.
Go to Slack App Directory and click on Make a Custom Integration as shown below:
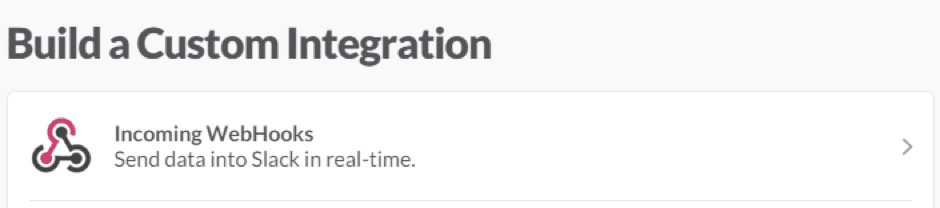
 This will bring up a list of Custom Integrations that you can build for your team and we will select the Incoming WebHooks as shown below:
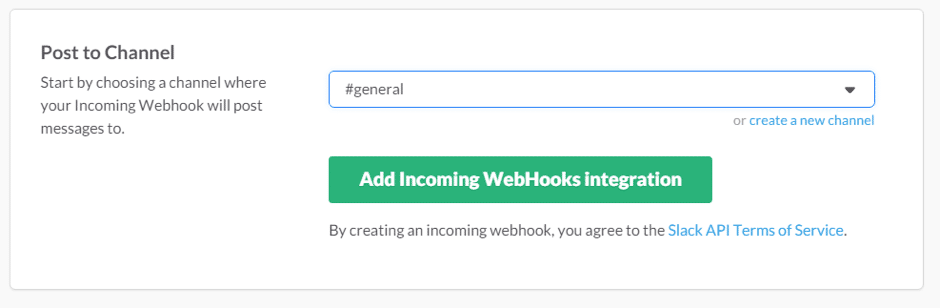
 We want the message to be posted to the #general channel, so we select that channel and click on the Add Incoming WebHooks integration.
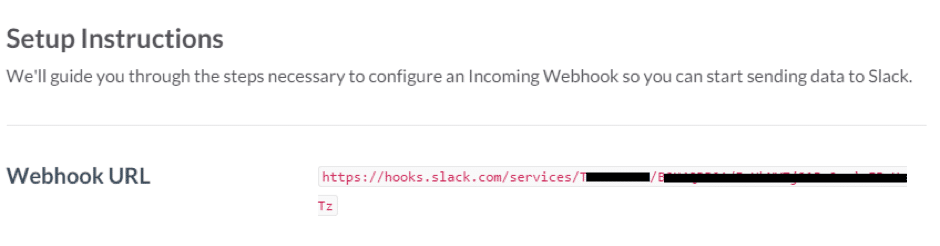
 This completes the WebHooks setup and it will lead you to the details page for the integration that you just setup. This will contain the Webhook URL that you need to note down. Kapacitor will just need to have this information, so that it can post the JSON Payload data to Slack, which in turn will deliver it to your #general channel.
Configuring Slack Channel in Kapacitor Configuration file
The next thing that we need to do is go back to the kapacitor.conf file that our Kapacitor service was using.
In that file, you will find the [slack] configuration section and which we fill out as follows:
[slack]
 enabled = true
 url     = "https://hooks.slack.com/services/<rest of Webhook URL>"
 channel = "#general"
 global  = false
Notice that the Webhook URL that we got from the previous section is set for the url property. We also enable this channel, specify the channel (#general) to post to and set the global to false, since we would like to explicitly enabled the Slack integration in our TICKscript.
Save this file and restart the Kapacitor service again.
You should see the last few lines in the startup console as shown below:
[udp:temperature_db.default] 2016/01/22 06:46:53 I! Started listening on UDP: 127.0.0.1:35958
[influxdb] 2016/01/22 06:46:53 I! started UDP listener for temperature_db default
[task_master] 2016/01/22 06:46:53 I! Started task: temp_alert
Notice that the listener has been started for our temperature_db database and our task has also been started.
Add Slack Channel to TICKscript
We have not yet modified our TICKscript, which only logged the high temperature to a file. We will add the Slack channel now.
Open up the temperature_alert.tick file in an editor and add the additional line as highlighted below:
stream
   .from()
   .database('temperature_db')
   .measurement('temperature')
   .where(lambda:"Station" == 'S1')
   .alert()
   .message('{{index .Tags "Station" }} has high temperature : {{ index .Fields "value" }}')
   .warn(lambda:"value" >= 30)
   .slack()
   .log('/tmp/high_temp.log')
Save the temperature_alert.tick file.
Reload Task
We will now reload the Task again because we have changed the script. To do that, you have to define the task again (use the same name) as shown below. The define command will automatically reload an enabled task:
$ kapacitor define -name temp_alert -tick temperature_alert.tickSlack Channel Notification
We are all set now to receive the Slack Notification. If the temperature data is streaming in and if the temperature value is greater than 30 degrees Celsius, you will see a notification in Slack. Shown below is a sample record in our general:
 This concludes the integration of Kapacitor into our IoT our sensor application.
What's next?
- In part seven, we will explore how to use Telegraf to collect system data about our temperature sensors. Follow us on Twitter @influxdb to catch the next blog in this series.
- Looking to level up your InfluxDB knowledge? Check out our economically priced virtual and public trainings.
