How to Use Grafana with InfluxDB to Monitor Time Series Data
By
Gunnar Aasen
updated December 14, 2025
Product
Developer
Company
Navigate to:
The “open platform for beautiful analytics and monitoring,” Grafana supports various backends that store time series data. One of those backends is InfluxDB. InfluxDB is a time series database built specifically for storing time series data, and Grafana is a visualization tool for time series data. Given this perfect match, Grafana has a tight integration with InfluxDB.
Introduction to time series monitoring with Grafana
Grafana is definitely one of the most popular time series data visualization tools that we recommend using with InfluxDB. Below are some basics on how to set up your Grafana dashboard with InfluxDB, how to use the Grafana InfluxDB solution to get the most out of your time series data, and how to visualize what you want - the way that you want - using InfluxDB time series database.
Grafana dashboard setup for InfluxDB
For starters, download InfluxDB and Grafana. The basic setup is to have InfluxDB and Grafana monitoring connected together. InfluxDB has an API, and typically, that defaults to port 8086 while Grafana’s API is on port 3000. And Grafana will call the InfluxDB API whenever it wants to query data.
When you set up the InfluxData time series platform, you will need a collection agent collecting your metrics. For InfluxDB, use Telegraf which already has over 200 plugins.

Some Grafana InfluxDB setup basics to remember:
- InfluxDB is essentially a time series database process that runs on a server. That process can also run on the same box that Grafana runs on. Grafana has a very lightweight server-side application, and most of Grafana monitoring runs in the browser.
- It's easiest to set up Grafana and InfluxDB on the same instance, yet if you find you have a very large installation of InfluxDB, a number of Grafana users, or a certain security, or deployment profile within your organization, then setting up InfluxDB and Grafana on separate servers is also perfectly acceptable.
- InfluxDB will be the more memory-intensive and CPU-intensive application of the two, simply because a lot of Grafana's work happens in the browser. To maintain best performance, we recommend for Grafana monitoring that you use the latest browsers.
Grafana and InfluxDB setup configurations
A lot of the defaults set up for InfluxDB can be maintained. Note that you can enable query logwhich will log all queries when executed or when sent to the InfluxDB API, which can be useful for debugging Grafana issues.
One important thing to note when setting up InfluxDB with Grafana is to set up the coordinator section of the configspecifically, set the maximum number of concurrent queries:
- If you have issues with different Grafana users all hitting InfluxDB with different open browsers and sending a bunch of time series database queries through, we recommend setting the max concurrent queries. You can also set query time-outs and set queries to be logged if they take longer than a certain amount of time.
- The settings around max-select point, max-select series, and max-select buckets are also very useful in limiting the amount of results that can be returned thereby preventing a particularly expansive query from potentially taking down the InfluxDB server or causing a slowdown for everyone else.
When exploring Grafana’s configuration file, you’ll find a wealth of other great ways to configure Grafana monitoring to make it more usable. These include setting Grafana http port, router logging, and enabling the user to make your browser pages load faster.
Learn about Grafana security settings
As for security settings, every Grafana instance has a default admin user and default password. If you are setting up Grafana monitoring on anything where anyone is able to get into your instances, set your own custom username or at least password to prevent people from getting access.
Here are some basic Grafana security settings:
- By default, Grafana will allow users to sign up and register and also allows non-admin users to create organizations. So we recommend setting the "enable anonymous access" option as "false" to prevent people from setting up users on organizations if you didn't want them to.
- Also, anonymous access is disabled by default, but you can enable anonymous access, which is very useful if you have a public Grafana dashboard that you'd like to promote.
- If you do a password reset that requires a user to receive an email, you'll want to set that up in the SMTP section.
- Grafana also has a number of log levels, so if you're trying to debug, definitely bump up the log level to debug.
- Grafana will expose metrics about itself Telegraf has a Prometheus input built-in so you can direct it towards that and receive or collect internal Grafana metrics, put them into InfluxDB, then graph them again in Grafana.
If you are using InfluxDB Cloud and need to configure access to different groups and users on Grafana to view the time series data that InfluxDB Cloud collects, view the webinar short “InfluxDB Cloud with Multi-Tenant Grafana.”
Setting up graphs for Grafana Metrics
InfluxData’s “How to use Grafana with InfluxDB” webinar explains how to use Grafana UI to set up graphs and use InfluxDB Query Builder.
Here are some webinar highlights on what to expect in building your Grafana dashboard and customizing your graphs:
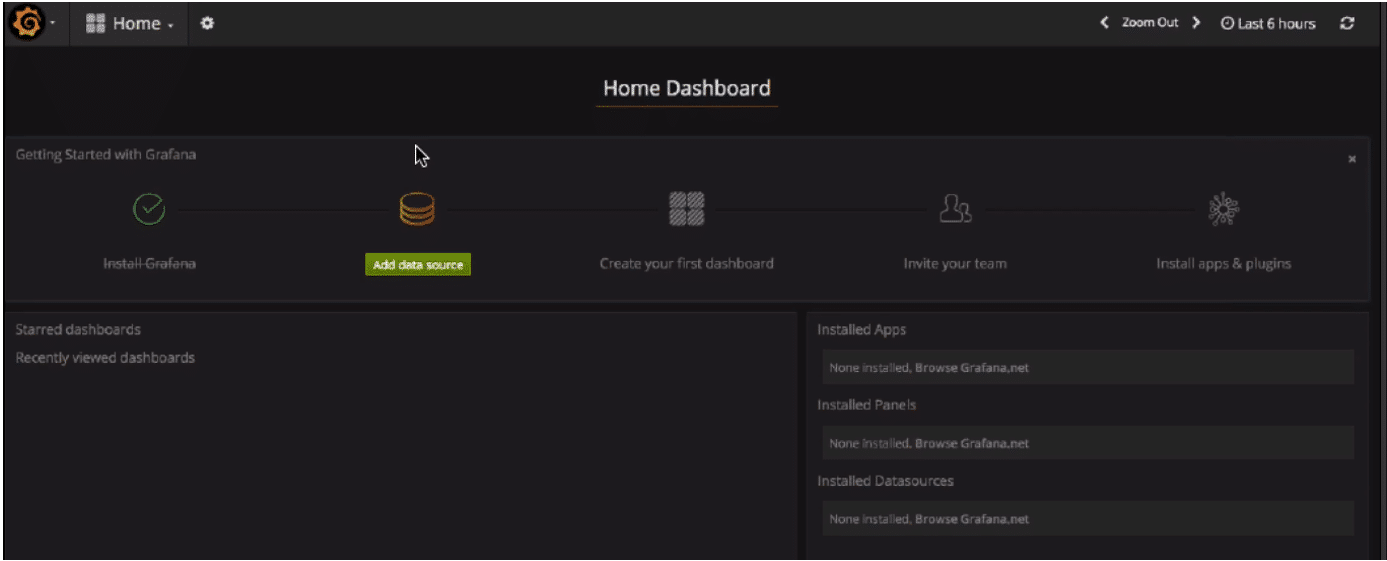
- Once in config, add a data source, select the InfluxDB Type, and give that source a name. You might want to make it the default data source for your Grafana monitoring instance. You pick the InfluxDB URL and enter the database, user, and credentials. Once you get the "success" notification on that, then you add a Grafana dashboard.
- Grafana dashboards are based off rows and panels. You can have multiple panels on a row, and you can edit panels.
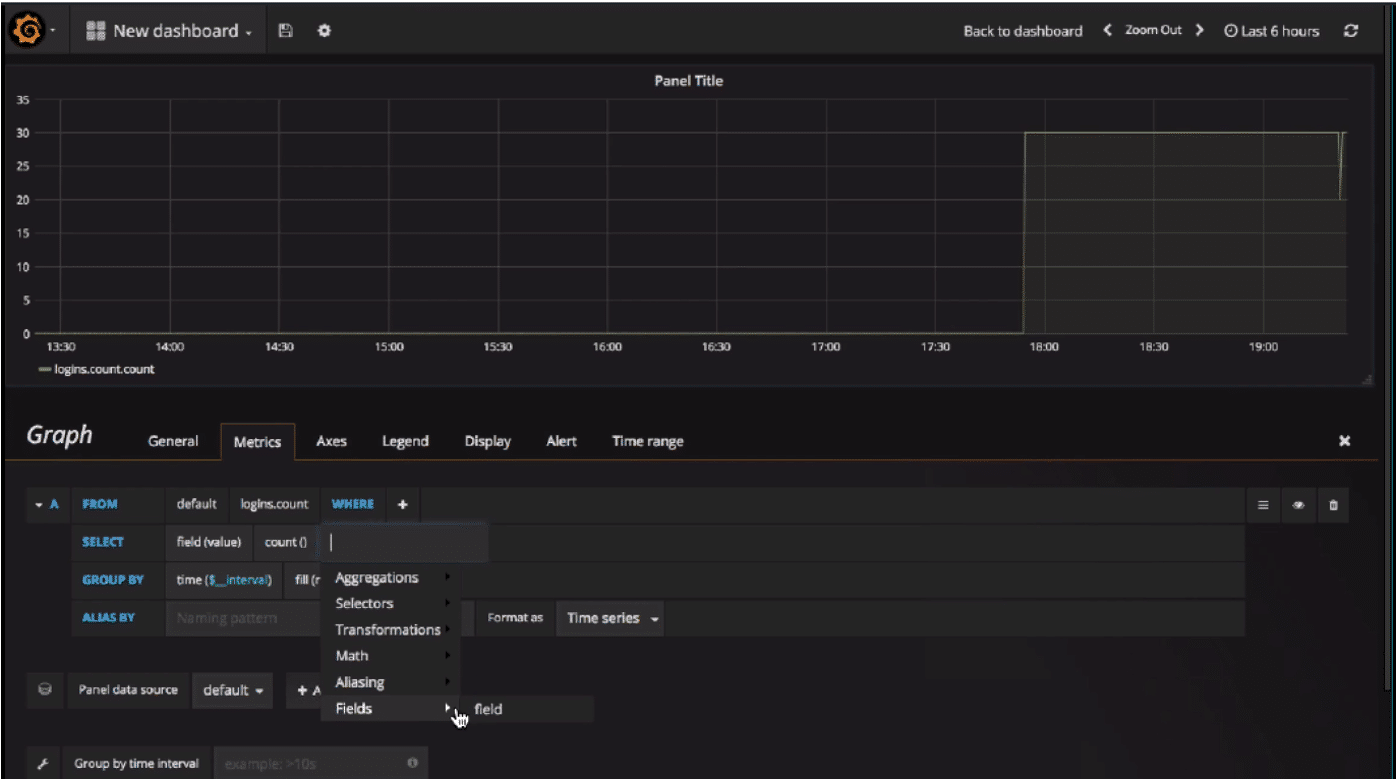
- While in edit mode, you see the Grafana Metrics path, where you specify your InfluxDB query. You can also specify the InfluxDB policy that you want to use.
- The default is to use the "value" as a field and "mean", but you can use any aggregator of your choice. You can also select multiple fields, or select the same field twice and use different aggregators.
- You can add various kinds of transformation like moving_average.
- Another property in the Grafana Metrics tab is how they're GROUPED BY. By default, Grafana GROUPS BY a predefined interval value, which is calculated based on the screen and the panel width. You can also specify how InfluxDB should handle null values.
- You can change how to display the graph (as lines, bars, points, etc.) and take advantage of the different display settings.
Optimize time series monitoring with Grafana
InfluxDB and Grafana perform well together, but you can definitely hit some performance issues. If you’re collecting a lot of time series data, or alternatively querying a lot of data and putting some stress on InfluxDB, you’ll typically find that InfluxDB since it is doing a lot of the server-side work is the first piece of the Grafana InfluxDB chain to experience issues.
Each Grafana graph is actually a query to InfluxDB. The more graphs you have, the more load there is on the InfluxDB server. So if you have a Grafana dashboard of 30 graphs, that’s 30 queries that you’re sending to InfluxDB and 30 queries that need to get the results collated by InfluxDB, and then sent back through Grafana monitoring. If you have a lot of queries or graphs, think about what you’re graphing and whether all the graphs that you have displayed are actually useful to you.
To further improve the performance of InfluxDB and Grafana, here are some helpful tips:
- Set your rows to be collapsible - when you collapse rows, Grafana will not show or render that graph, and therefore won't produce the queries to InfluxDB. So if you happen to have a Grafana dashboard that has a lot of useful graphs, that are perhaps not all useful at once, a great way to reduce or speed up your Grafana monitoring experience with InfluxDB is to use collapsible rows.
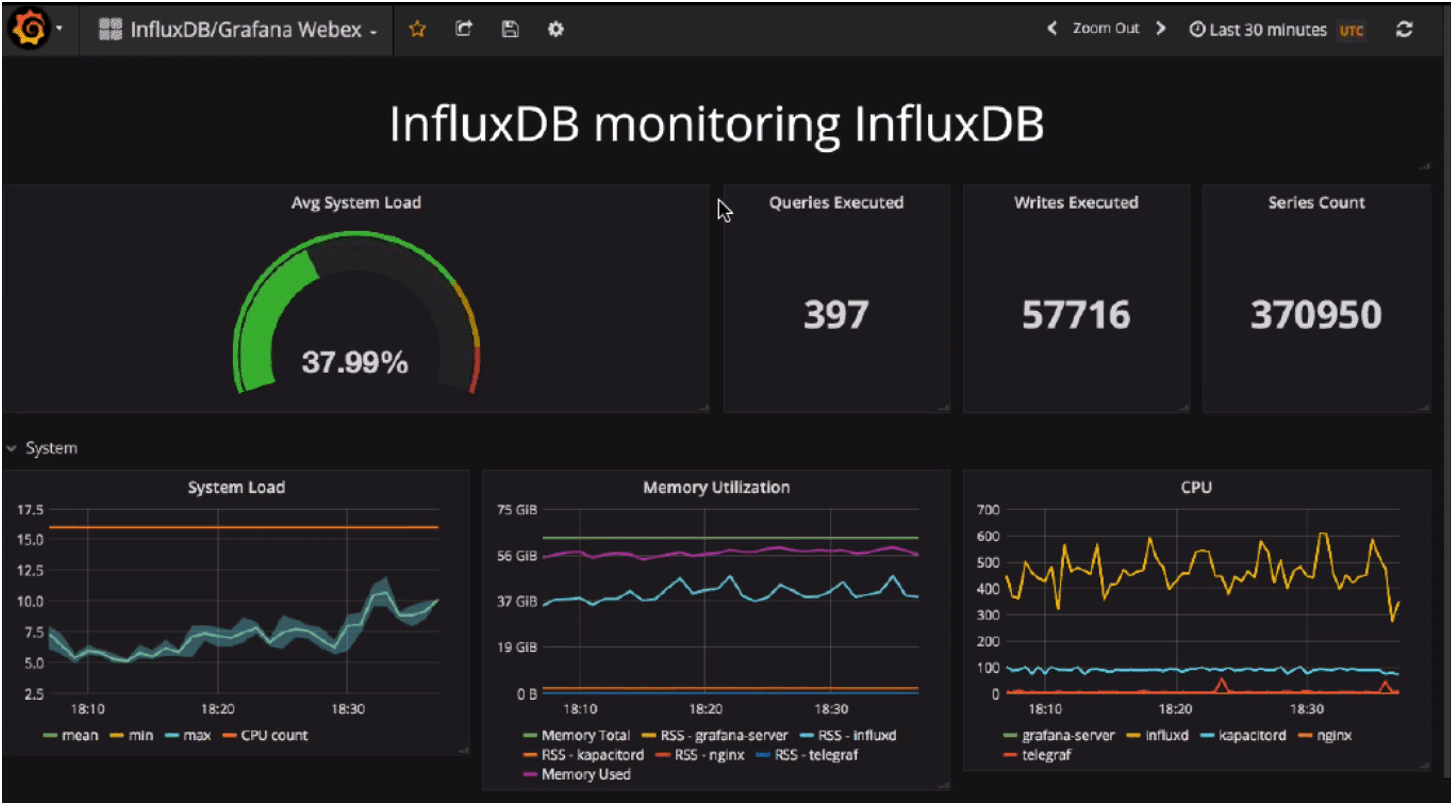
- There are also several graph types and other options you can add to graphs. For example, if you care only about the number of queries executed, you can just return the latest number of queries that was executed and not a graph over time. You can also do templating and annotations.
- Every query generated by Grafana graphs typically has a GROUP BY option, so you'll see a lot of recalculation on each loading of the graph.
- If you do a very expansive query to calculate, and InfluxDB takes a while to respond and the query times out and you get an error in your Grafana graph, wait a little before you hit the Refresh button.
- InfluxDB and Grafana monitoring both provide many logging options. If Grafana is displaying an error for a graph, go through and figure out why it's producing that error if it doesn't show up after one or two refreshes. InfluxDB doesn't cache queries, so every time you send a query, it recalculates the results. Typically, if you're zooming out or selecting larger time ranges, such as 24 hours, it'll take longer for InfluxDB to pull out all those results. The more data you accumulate, the more data Grafana and InfluxDB have to process to load.
Conclusion
There is no limitation on the number of Grafana metrics displayed on one graph, but remember to track those most useful to you for time series monitoring performance, extracting insights or enabling forecasts. If you’re thinking about how many Grafana metrics you want to display at one time, you might also want to think about what that time series data is actually showing you and what you’re trying to accomplish by reading all that data.
