Table of Contents
Our applications speak, and time series is one of their languages. DevOps, cloud computing and containers have changed how we write and run our applications. This post shows what InfluxData and the community is building to provide a modern and flexible monitoring toolkit based on an open-source set of projects.
During the last decade, everything has changed: containers, virtual machines, cloud computing. In addition, everything moves faster, and we need and environment capable to support this speed. Our applications need to grow, in a way that help us maintain them over time. To do that, we need to understand how our applications behave and be ready to fail and to improve. We have the tools and technology to do that and just need to put it all together to understand how applications are behaving and how infrastructure is growing, and ultimately, to understand system failures or errors in order to improve performance.
Monitoring Logs
We have long been reading logs and have some tools that help us understand how our applications behave. And we do that because:
- We need to trust somebody. We don't know how our application behaves just by looking at the screen. We need to understand how our users are using our application and how many errors there are. There are a lot of metrics to track. And all of them come together to build trust in our systems.
- We want to predict the future. We want to base those predictions on the metrics and behaviors we identify, to understand whether we are growing, how much we are growing, and how much faster we can grow in the future. With all this information, we can design a plan and maybe predict some bad events (and also because we are not John Rambo, who definitely knows what to do in any kind of situation!).
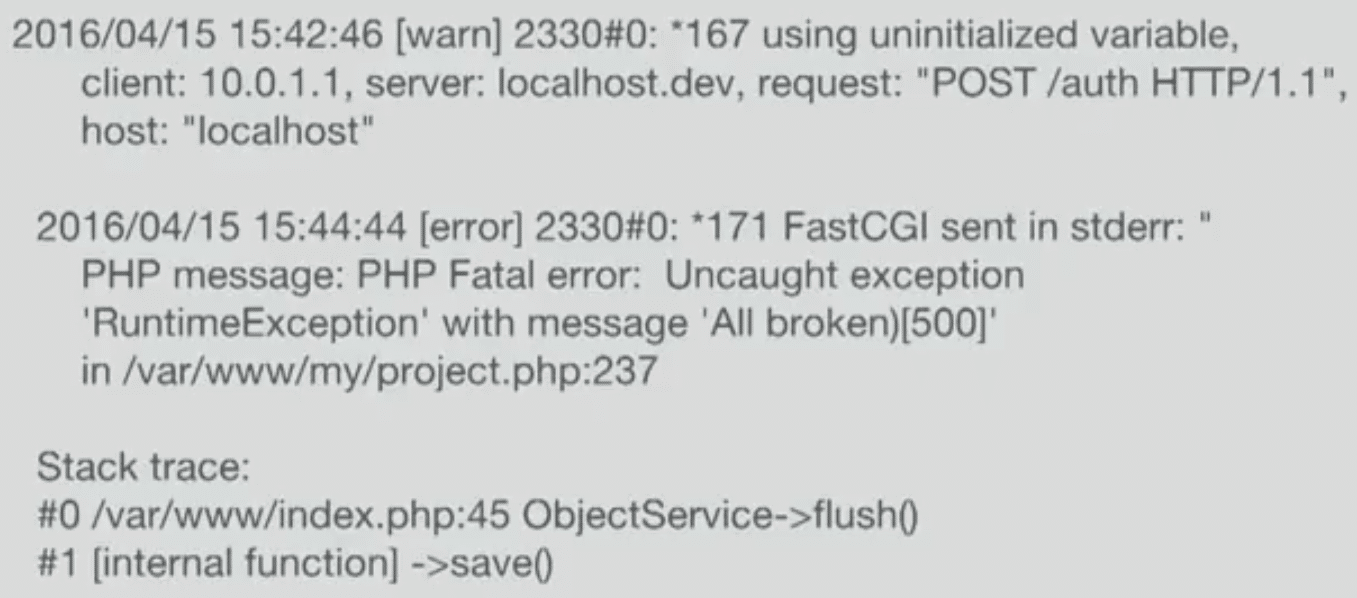 <figcaption> Example of a log</figcaption>
System monitoring teams use a really powerful command called a “tail” to read logs. That’s how our applications usually speak. When it comes to logs, there is a base or normal state. If our logs are streaming in this normal state, then all is fine. If they stream too fast or too slow, then something is wrong, and corrective action is needed.
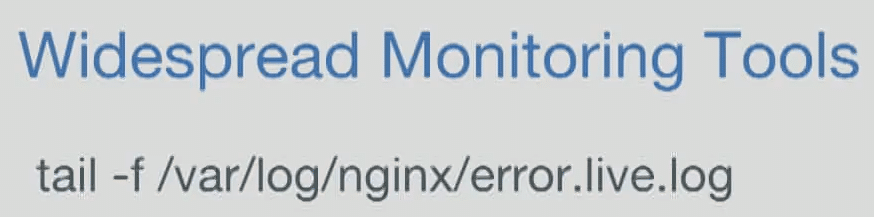
This isn’t the smartest way to understand how your application speaks, but it’s the most common way that everybody is using to monitor an application. We can definitely do something better now, and this relates to the nature of logs.
Logs are descriptive and contain a lot of information. But they are really expensive to store in a database. They are not easy to index because they are usually in plain-text format. This means that your engine needs to work hard to understand connections with other logs or to allow you to search them for what you are seeking. If you have a lot of logs or are using logs for anything to happen in your application, you need to have a good system behind you. It’s difficult, but it’s definitely not impossible.
There are a lot of tools and services that help put a log together and figure out what’s happening, such as Logstash, Kibana, Elasticsearch, NewRelic, CloudWatch, Graphite and others. Some of them are offered as-a-service, some are open source projects, and some are both. The point is, there are a lot of choices.
Choosing Log Monitoring Tools
Choosing the right tools always depends on what you are doing. There are use cases where you need logs for forensics or archival. And since logs contain detailed information about what’s happening, you will be able to use them for those use cases. When you are faced with an error, you will be able to ascertain what kind of error it is. Logs are more often than not, used to obtain this kind of information.
However, there are other cases where you just need to know how your application is behavingif it’s growing or shrinking in size or how the errors are distributed in time. You really don’t need to know why or what’s happening at the rootyou just need to know that there is a behavioral change. Time series, on the other hand, are also used in your day to day to help you understand how your systems are performing. They are not as detailed as logs as they speak another language. For example, CPU, Memory usage are time series.
You can’t just use time series and not use logs because there are some problems that you need to solve with proper logs. And I am not here to debate the benefits of logs over time series or vice versa, since it is likely that you will need both and you will extract value from both.. Not only will you use both, but in fact, logs are a form of time series data. If you take your log and reduce it through a time series and a value then we can do some math on top of them, and logs become easier to index.
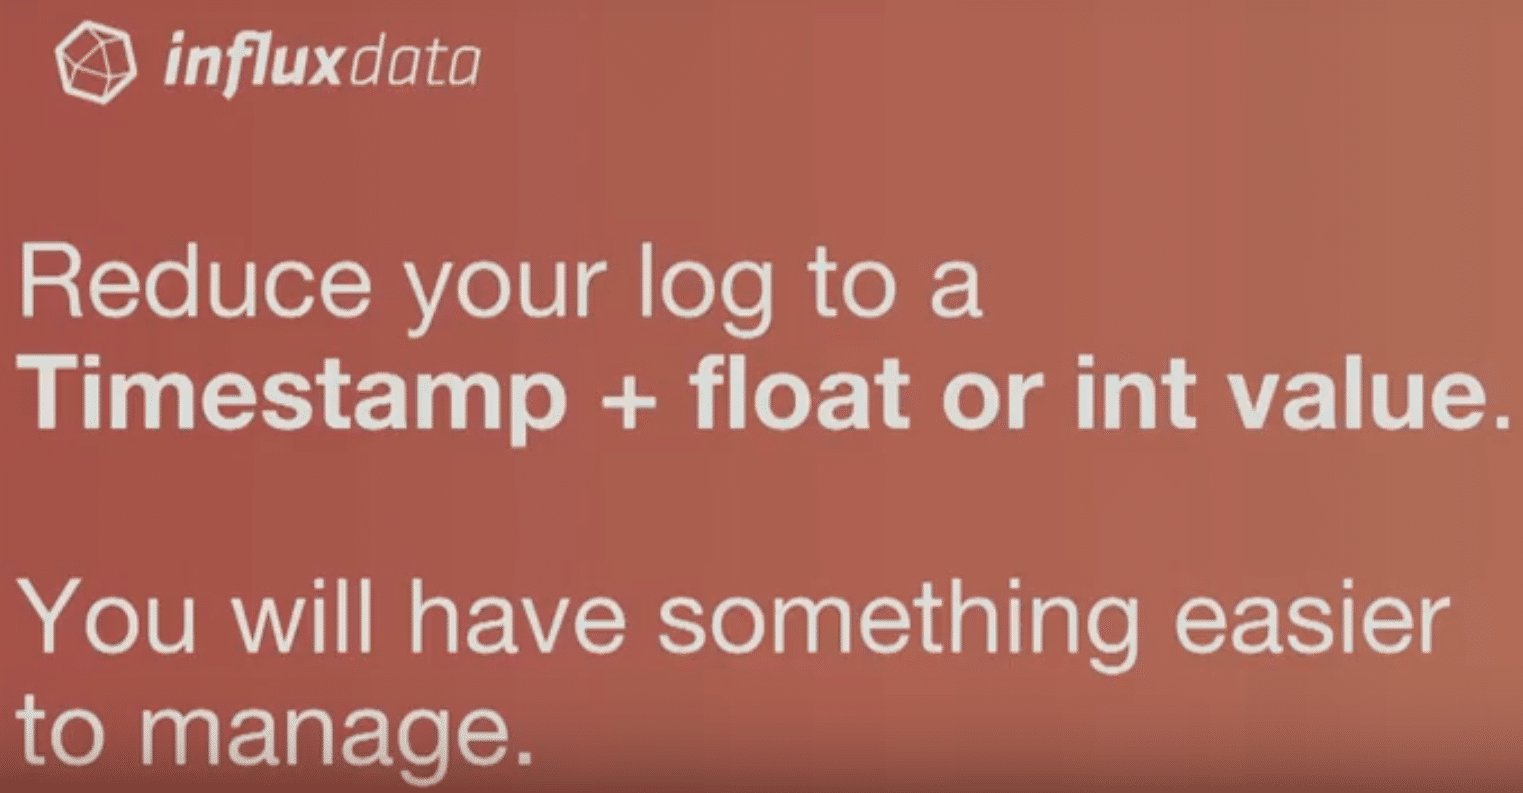
You are in practice translating your logs into a time series. If you think about how many logins there are in your application, how many errors you are having, or how many transactions you are doing if you are a financial company, those are all time series because it’s a value, one login, at some point in time. It’s a distribution in time. That’s what time series means. That’s how logs can be translated. This is not an integer or a value. It’s a proper log just from a different point of view.
To simplify, you can reduce your log in just a value and you have a point in time that you can aggregate, compare and so on. If you think about your application for about 10 minutes you can get a lot of time series.
Bonus point: all the resource usage that you can get from a server are time series. And you can visualize them with application stats to understand how a spike in error rate escalates your memory usage.
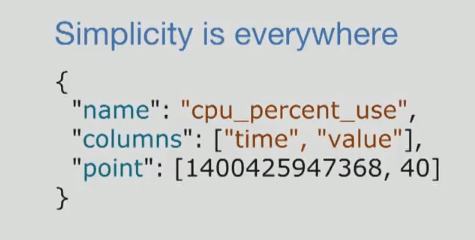
The below quote holds true: it’s very easy to do something complicated.
As developers, we know that everything that we did five years ago now seems so complicated. Our goal now is to make things simple. When you have something simple, it’s easier to explain to someone else and to maintain. That’s what I’m trying to do with time series: Have just a simple value and time where the value is a number. With this kind of model, you can do some math, aggregate them, create a graph, and you have a less expensive way to extract information from your application. However, InfluxDB compared with traditional and general purpose tools like Cassandra, MySQL, MongoDB, is better suited to handle this kind of data because it provides features dedicated to solve this particular use case like continuous query, retention policy other than an optimized set of features like series and compression.
Using InfluxDB for Log Storage
InfluxDB is a Time Series Database. You can use it to take all the information that your applications or servers generate and push them to this database. It’s a Go binary that you can download, that runs in Windows and Mac, is designed to be really easy to install and start. InfluxDB uses InfluxQL to speak. It means that you can query this database with something that looks similar to something you are already familiar withSQL. You don’t need to learn another language. Here’s a quick summary of reasons to choose InfluxDB.
- Easy to get started with
- Familiar query syntax
- No external dependencies
- Open source
- Horizontally scalable
- Member of a cohesive Time Series Platform
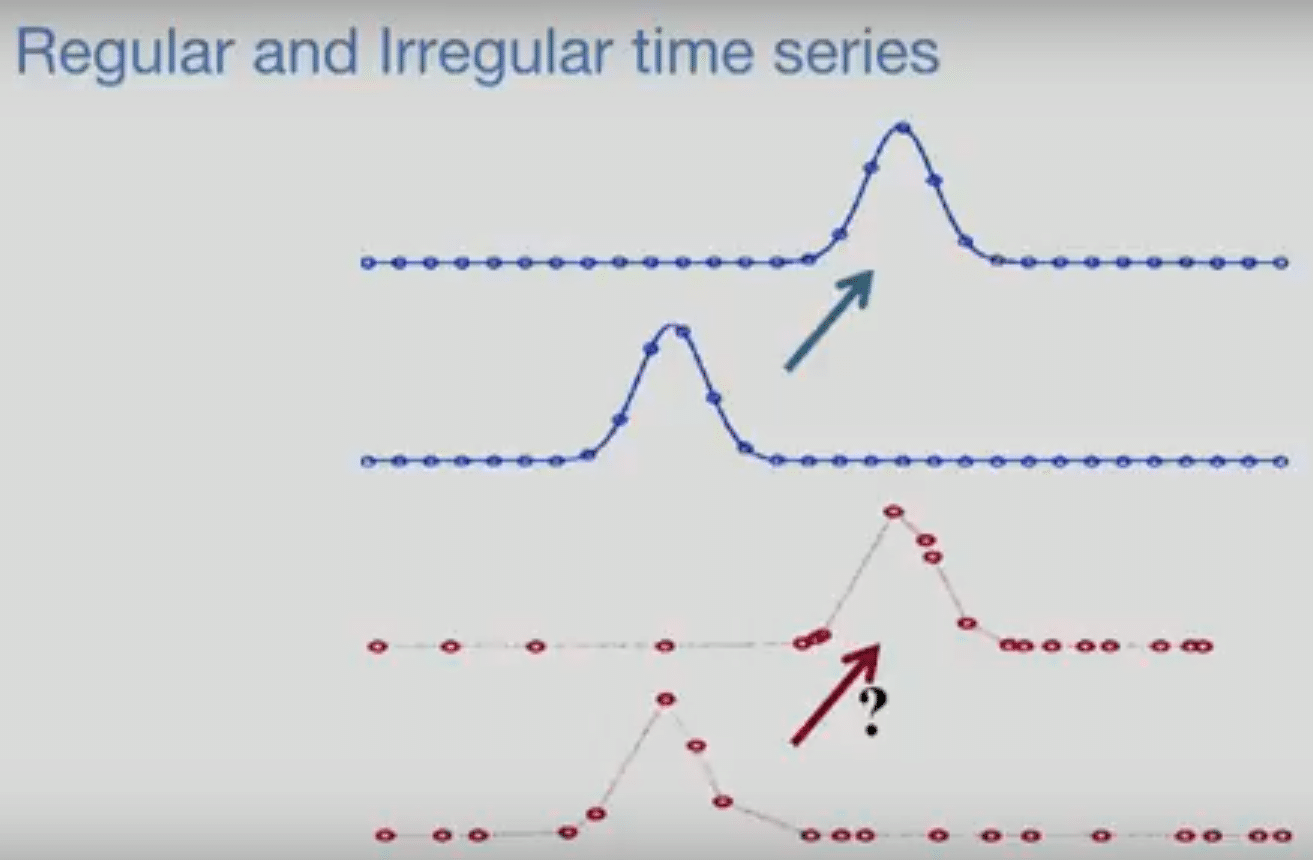
InfluxDB has a large user base and a large community. Used in combination with the other InfluxData platform components discussed below, it creates a full-stack monitoring system. InfluxDB supports irregular time series (events occurring at irregular time intervals) and regular time series (metrics occurring at regular time intervals), as shown below.
At InfluxData, we have a set of benchmarks to show why you need to pick a proper Time Series Database and not simply your favorite kind of database. The difference in write performance between InfluxDB and comparable databases is pretty big. Benchmarks are usually kind of opinionated, but we try to make them as objective as possible through independent testing. See our benchmarks comparing InfluxDB to Elasticsearch, MongoDB, Cassandra, and OpenTSDB.
Spinning Up A Modern Monitoring System
InfluxData has a full stack open-source set of projects that you can useTelegraf, InfluxDB, Chronograf, and Kapacitor. These are collectively called the TICK Stack.
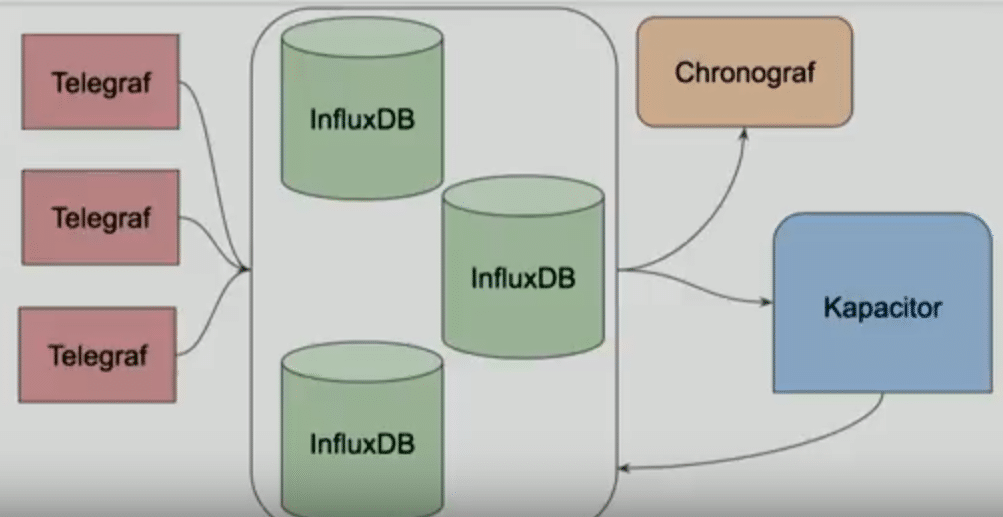 <figcaption> Complete stack to build your monitoring or event system</figcaption>
- Telegraf is a metrics collection agent. It's also a Go binary that you can download and start. It's really easy. And you install one Telegraf in every server and can configure them to take information from each. Telegraf is plugin-based, with both input and output plugins. If you have a monitoring system already in place and you are looking to have a strong collector, you can use Telegraf.
- InfluxDB is our storage engine. All the metrics that come from Telegraf are sent into InfluxDB.
- Chronograf is a dashboard to manage and see all the data. From Chronograf, you can also manage InfluxDB and Kapacitor. If you choose not to use Chronograf, there are other projects implementing the InfluxDB output, including Grafana.
- Kapacitor, the TICK Stack's native data processing engine, can be configured to listen to metrics and take proactive action on what is happening. It can process both stream and batch data from InfluxDB. You can send Kapacitor alerts to compatible incident management integrations. For example, Kapacitor can send a message to PagerDuty, and you can be called during the night if something is wrong, or it can send a message on Slack.
Starting InfluxDB and starting to play with the entire TICK Stack is really simple. You can just run some binaries or run some Docker containers. And you have a monitoring system up and running that you can use. But the real goal for a monitoring system is to tell you when your infrastructure or application is down. If your monitoring system goes down with your servers, this means that it’s not working. So you need to trust your monitoring system. You need to have it separated so far from your application, from your infrastructure, that you are 100% sure that it stays alive when your application and servers are down. It’s not a simple goal. You need to know that, and it’s not just a set of Docker-run commands.
 <figcaption> Managing a monitoring system is not for everyone</figcaption>
