How to Use the SHOW STATS Command and the _internal Database to Monitor InfluxDB
By
Philip O'Toole
updated December 14, 2025
Product
Navigate to:
InfluxDB supports statistics and diagnostics meta queries which allows developers and system administrators to make better use of their InfluxDB system, diagnose problems, and troubleshoot issues.
This post outlines some of statistics and diagnostics currently gathered by InfluxDB, and some advice on how to work with this information.
Who watches the watchers?
A common use of InfluxDB is the monitoring and analysis of IT infrastructure. And to run a successful InfluxDB system, the database itself must be monitored. The command SHOW STATS allows you to do just that. SHOW STATS returns information about the various components of the system, for the node receiving the query. Each module exporting statistics exports a Measurement named after the module, and various series are associated with the Measurement. (The fact that it is a Measurement is important, as will be seen shortly.)
Let’s take a look at the runtime statistics, which capture details about the Go runtime.
> show stats

name: runtime
-------------
Alloc   Frees   HeapAlloc       HeapIdle        HeapInUse       HeapObjects     HeapReleased    HeapSys Lookups Mallocs NumGC   NumGoroutine    PauseTotalNs    Sys             TotalAlloc
4056352 15134   4056352         1712128         4874240         7001            0               6586368 71      22135   4       51              1573952         10918136        13093576
In this case SHOW STATS gives you an overview of memory usage by the InfluxDB system, within the Go runtime. Many Go developers will recognize the importance of these numbers.
Another key statistic is the httpd module:
name: httpd
tags: bind=:8086
query_req       query_resp_bytes        req
---------       ----------------        ---
2               418                     2
This output shows the number of queries received (query_req), by this node, since the system started – 2 in this example – and the number of bytes returned to the client, 418 in this case (this system just started!).
Most inputs, such as Graphite and openTSDB, also have detailed statistics available. This can be particularly useful when working with these systems. We get plenty of questions about performance of these inputs, so this statistical information can be really useful.
Here are example statistics for the Graphite input:
name: graphite
tags: bind=:2003, proto=tcp
batches_tx      bytes_rx        connections_active      connections_handled     points_rx       points_tx
----------      --------        ------------------      -------------------     ---------       ---------
62              1658490         6                       6                       69006           62000
This shows the number of points received by the Graphite service on port 2003 (points_rx), for the TCP protocol. It also shows the number of points sent to the database (points_tx). If you notice points_rx is greater than points_tx. This shows that the Graphite input is buffering points internally, as it batches writes into the database for maximum throughput.
These are just a few quick examples of what SHOW STATS can do. Keep in mind that depending on what services are enabled, and what code paths execute within the database, you may see statistics from other components.
The internal database
All this statistical information is very useful, but is reset when the system restarts. What if we want to analyze the performance of our system over time? Of course, InfluxDB is a time series database, built especially for storing this kind of data. So the system periodically writes all statistical data to a special database called _internal, which allows you to use the full power of InfluxQL to analyze the system itself.
Some examples may help.
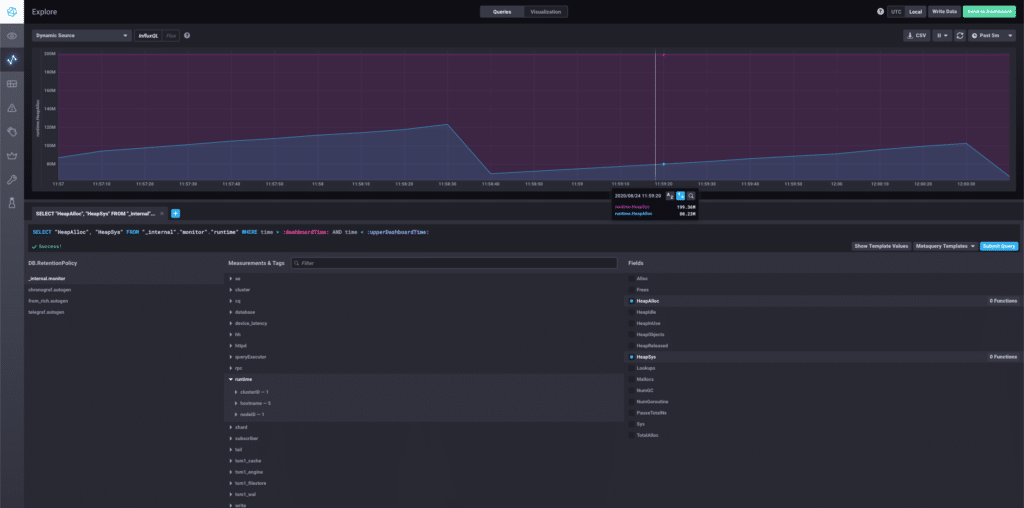
If you have questions about how InfluxDB is using the Go heap, it’s easy to see how usage changes over time. For example using the influx CLI, issue the following queries to see Go heap usage every 10 seconds.
> USE _internal
Using database _internal
> SHOW MEASUREMENTS
name: measurements
------------------
name
graphite
httpd
runtime
shard
write

> SELECT HeapAlloc FROM runtime LIMIT 5
name: runtime
-------------
time                            HeapAlloc
2015-09-18T18:40:04.199587653Z  548536
2015-09-18T18:40:14.199761008Z  3895536
2015-09-18T18:40:24.199791989Z  2057504
2015-09-18T18:40:34.19971719Z   2111680
2015-09-18T18:40:44.199490569Z  2169848
Even better, when coupled with a tool like Chronograf, you can visualize all this data.
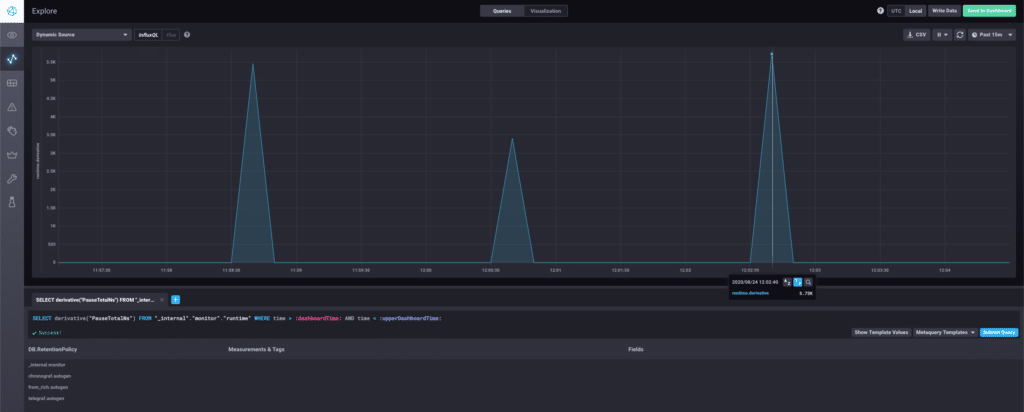
The next example of a query, also visualized using Chronograf, shows a derivative query of the total garbage collection (GC) pause time of the Go runtime. Since this graph shows rate-of-change, the spikes in the graph show when a GC pause took place.
Cluster-level statistics
Because every node in your cluster writes these statistics to the _internal database, queries against _internal return data for the whole cluster, which can be very useful. However, all data is tagged with the hostname and node ID, so analysis of a specific node is always possible. Shown below is points_rx for the Graphite service on just the node with hostname malthus.
> SHOW TAG VALUES WITH key=hostname
name: hostnameTagValues
---------------------
hostname
malthus
> SELECT points_rx FROM graphite WHERE hostname='malthus' LIMIT 5
name: graphite
--------------
time                            points_rx
2015-09-18T18:40:54.199425753Z  141001
2015-09-18T18:41:04.19947468Z   315608
2015-09-18T18:41:14.1993757Z    476001
2015-09-18T18:41:24.199438213Z  641001
2015-09-18T18:41:34.199454694Z  802001
But remember, the commands SHOW STATS and SHOW DIAGNOSTICS only ever return data for the node on which the query executes.
Expvar support
All statistics data are available in standard expvar format, if you wish to use external tools to monitor InfluxDB. This information is available at the endpoint /debug/vars.
Diagnostics
Diagnostic information is treated a little differently within the InfluxDB system. It’s mostly information about the system that is not necessarily numerical in format. It is important to note that diagnostic information is not stored in the _internal database.
Example data is the build version of your InfluxDB and its uptime. This information is particularly useful to InfluxDB Support, so be sure to include the output of this query anytime you file a Support ticket or GitHub issue.
Example output is shown below.
> SHOW DIAGNOSTICS
name: system
------------
PID     currentTime                     started                         uptime
7299    2015-09-18T20:32:22.219545782Z  2015-09-18T19:54:04.069260449Z  38m18.150285438s


name: build
-----------
Branch  Commit                                   Version
master  d81618c57fae135d9b1c1a8fb3403722ceb29354 0.9.4


name: runtime
-------------
GOARCH  GOMAXPROCS      GOOS    version
amd64   8               linux   go1.5


name: network
-------------
hostname
malthus
More to come
As always, we encourage open-source developers to add statistics and diagnostics to any code they contribute, if it makes sense. We hope you find this information useful, as you work with InfluxDB. If you have any questions or concerns, come join us in our Community Slack.
