How We Made InfluxDB Cloud and Flux Faster
By
Molly Norris Walker
updated December 14, 2025
Use Cases
Product
Developer
Navigate to:
Performance has been a top user concern and an area of investment for InfluxDB Cloud since launching a year ago.
The theme of our recent performance push is aggregations; we took a vertical slice from backend platform to front-end user interface to improve aggregations across the full stack.
We’ve recently crossed key performance thresholds and wanted to share them with our early adopters: both the explorers and paying customers who embraced InfluxDB’s latest incarnation as a cloud-native database as a service. Flux is our new query language that allows us to define a fresh frontier for time series database run times.
We have learned so much from you already, and hopefully, you’ll see many of the things you cared about optimized in this latest batch of aggregation performance improvements.
Key performance thresholds reached:
- Response times for common Flux aggregation queries are subsecond for standard time series workloads, and just a few seconds for the largest workloads we see on the platform. This represents a reduction in query duration of up 2 to 60 times depending on the complexity of your data.
- Viewing an organization's usage is 25 times faster, and average load times for the Usage page are now subsecond.
- InfluxDB Cloud dashboards are now twice as fast (yay for de-duplicating queries!). Many aspects of the dashboard experience have sped up considerably, including opening dashboards, configuring cells, changing time ranges, and rendering visualizations.
- Optimizations have made previously unrealizable visualizations possible, such as viewing graphs with raw data between 20,000 and 300,000 series. Smaller graphs plotting less than 20,000 series are 45% faster as well.
Absolute operating performance is only part of a “measure of speed”; time to value is also a contributor to whether or not users perceive a platform as fast.
This is why you can now get to query results faster in two additional ways:
1. Building optimized queries by default
We’ve introduced a bunch of automatic optimizations in the Query Builder. This means you won’t waste time over-fetching data and then iterating down to a manageable size.
We take the time range whether it’s one hour or one month and automatically select a time window that will return displayable results based on available pixels. To populate the time window, the Query Builder also applies an autoaggregation such as mean, median, or last that matches your type of data. This means the Data Explorer prevents you from building a query that crashes the user interface; you can always switch to the Script Editor to write those browser-destroying queries ;).
Let’s explore an example of autoaggregations in the Query Builder. Let’s say I have a device streaming data every second, and I want to look at a month’s worth of data. The Query Builder automatically applies a mean aggregation and a time window of one hour. In other words, you can now get a high-level picture of how the device was behaving across the month with the data windowed into manageable one-hour blocks with an average value. No thinking necessary on your part.
IoT devices are frequently subject to data loss from connectivity issues. The Query Builder now also smooths the data by creating empty time windows so that if a device loses connectivity, and no values are present, it does not make the data’s overall shape artificially spikey. We need to increasingly solve for sparse data as more IoT application developers flock to InfluxDB Cloud.
Being able to quickly undo the ?automagic? we apply by default is also key. And so, all of these autoaggregations can be removed or reapplied with 1-click.
Taking it a step further, we often wanted to view the min, max, and mean at once. So we made it easy to add multiple aggregations together and apply them to a single time series by default. To represent this, we’ve introduced a band chart visualization that shows a shaded range between min and max values with the mean or median coursing through it.
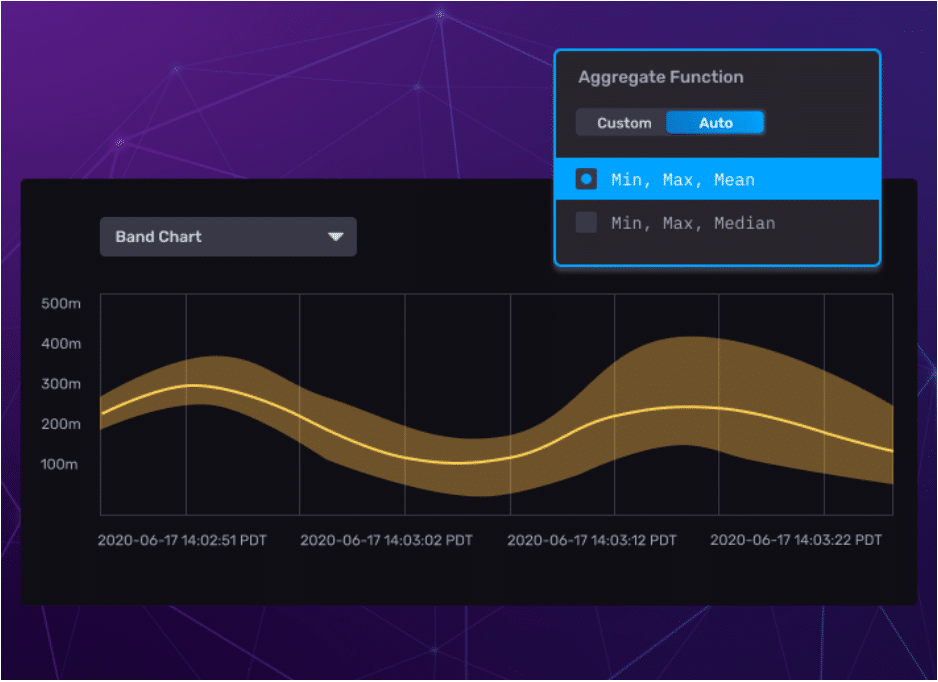 <figcaption> A shaded range to express min and max values around the aggregated values by mean or median</figcaption>
2. Returning query aggregation results faster (and letting you bail out if you think it's taking too long)
Why are Flux aggregations faster? The answer is mostly thanks to data locality breakthroughs.
We now perform the aggregation where the data is stored instead of moving all the data to perform the aggregation. We used to run many of the queries in the query tier, which makes sense, but we now examine the query and see what can be run in the storage tier prior to dragging the data set across the network.
Here’s a list of the aggregations functions we optimized:
- First
- Last
- Count
- Sum
- Min
- Max
- Mean
With the exception of Mean, the functions can be used in any permutations of the following code:
|> range
 |> filter
 |> group
 |> aggregateWindow(fn: first/last/count/sum/min/max)
While we hope your response times are snappier, we also built a new escape hatch. You can now pause queries by clicking a Cancel button that appears after one second without smashing the browser back button and losing everything.
The role of competition as a performance improvement driver
There are real trade-offs between feature work and continuous performance improvement. For our cloud-native service, we’re as committed to fully realizing a scalable and highly performant stack as we’ve ever been. We won’t lie. It was a lot easier when InfluxDB was the only solution defining this emergent time series database category. Today, we’re competing more on performance than we ever have before, and ultimately, that’s a fantastic driver for us to do our best work even as the landscape gets more complex and crowded. Having more players allows us to retest that we’re the best solution for time series use cases against real alternatives.
Many of the performance issues we encounter aren’t about InfluxDB Cloud itself but rather how related technologies interplay on the platform. This means our team is optimizing not just every detail of the platform, but also striving to learn all the nuanced best practices of dozens of integration points that we need to stay true to our open source values.
We’re grateful that our competitors and loyal fans are pushing us so hard. “Good” may be good enough for some, but most of us want more than that. We’ll continue performance engineering while we also release new, category-defining big bets such as inventing a new programming language (Flux!) or rewriting our popular database from scratch (InfluxDB OSS 2.0!). Our track record shows InfluxData doesn’t do “business as usual” we’ll wager that’s why you like us so much.
