Table of Contents
This summer, I’m interning at InfluxData, and am excited to learn, grow, and contribute to the Internet of Things community. As someone who has always been fascinated by robotics and IoT, InfluxDB caught my eye as the software best positioned for the incoming IoT age. I believe open source encourages learning and nourishes the community, and I value InfluxData’s commitment to it. The team at InfluxData is warm, welcoming, and friendly, while also passionate and dedicated to accomplishing the company’s goals and aspirations. The company holds core values that I believe are critical for learning: teamwork, humility, and embracing failure. Learning is a valuable skill that we never stop practicing, and the company culture really reinforces that willingness to learn from both our success and our failures.
I believe the strength of InfluxData comes from the amazing community we have built around InfluxDB and other IoT technologies, and helping that community grow is a valuable effort. Open source projects help the community create new amazing things, contribute to each other’s work, and learn from each other, and I can’t imagine a better way to develop and advance InfluxDB as a software.
To kick off my internship, I first had to learn the ins and outs of InfluxDB, and I did this through a fun challenge that was introduced at InfluxDays EMEA Virtual Experience 2021 and called The InfluxDays Challenge. The challenge provides an overview of InfluxDB, Telegraf and Flux. To begin, you need some kind of data to put into InfluxDB. One challenge you may have is figuring out what data to use, but the InfluxDB docs provide some sample data here. You also have the option of using Telegraf to write data to InfluxDB through the Telegraf plugins. You can access a list of Telegraf plugins in the InfluxDB Cloud platform.
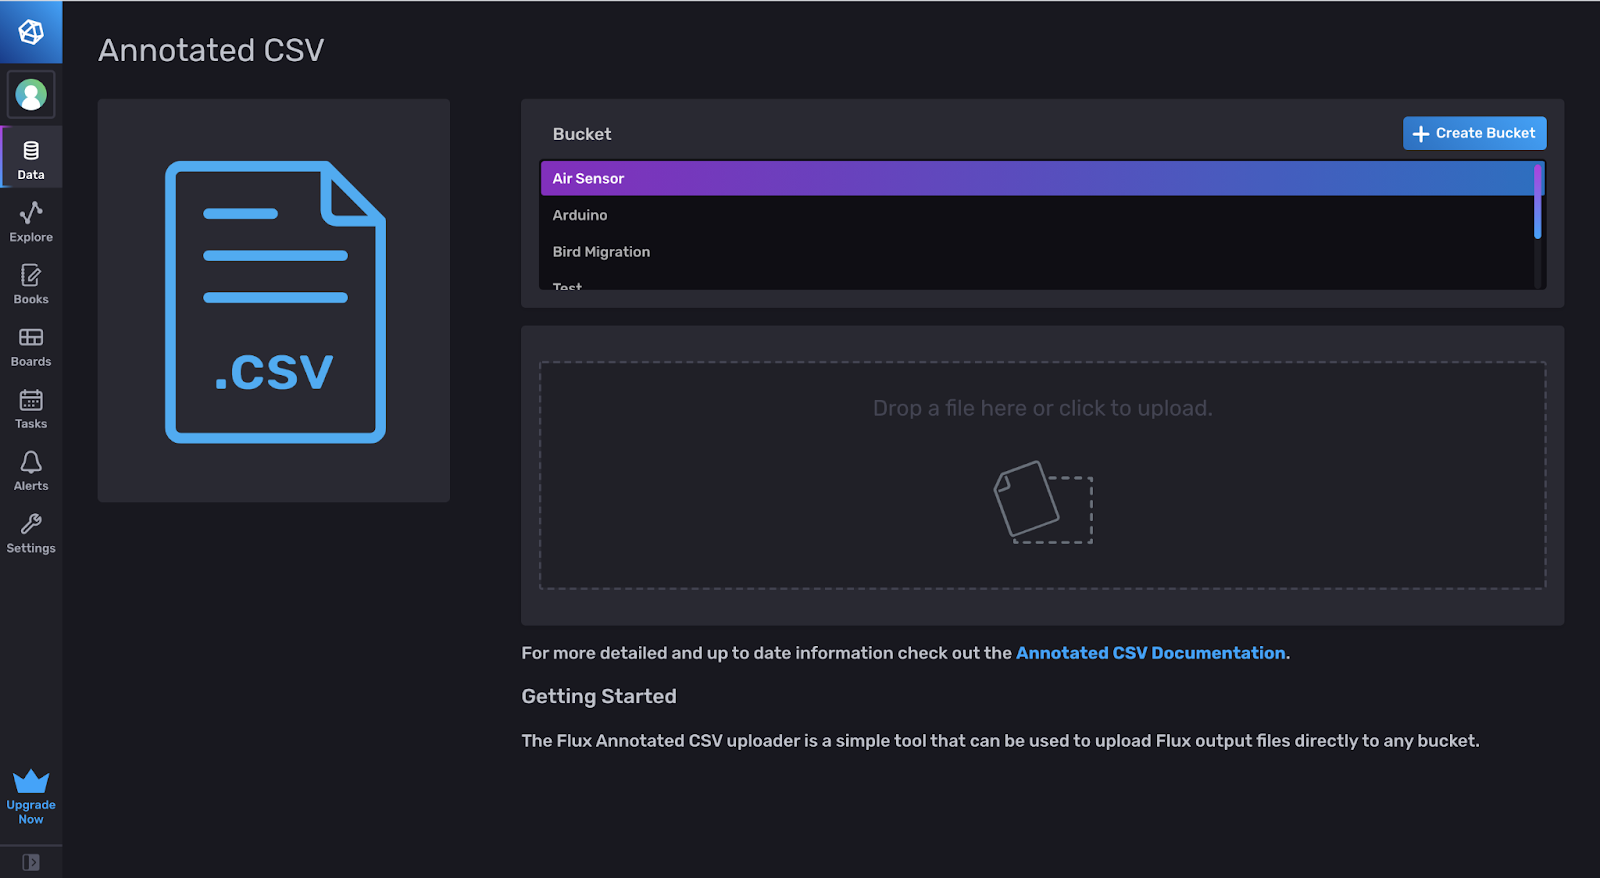
Uploading with an annotated CSV
As an example, we will be using some sample air sensor data from InfluxData. I found that the easiest way to add this data to InfluxDB is through the UI with an annotated CSV, which you can drag-and-drop here:
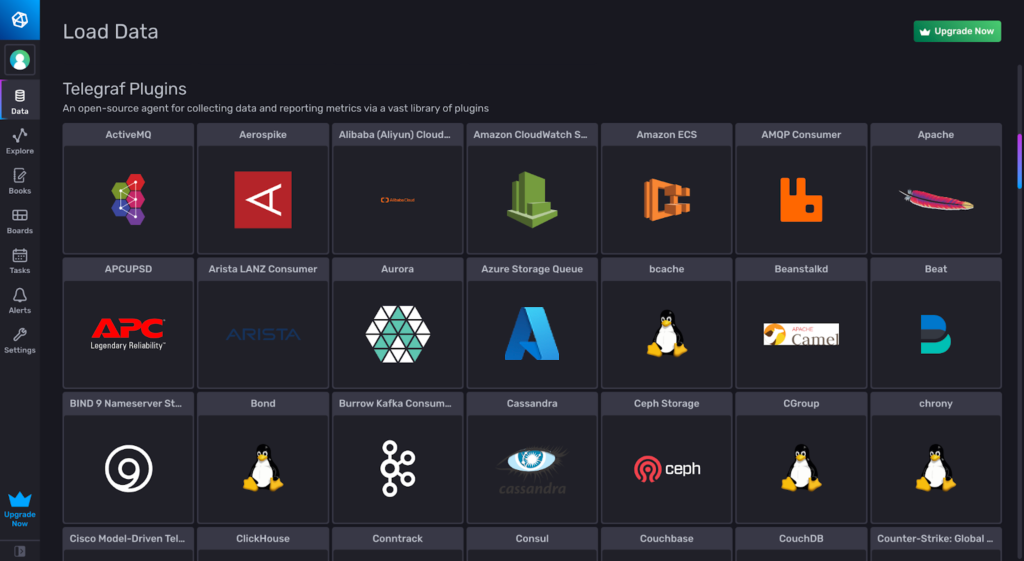
Uploading through Telegraf
InfluxDB Cloud offers a vast library of Telegraf plugins that you can set up from the Data section of the UI. You can scroll through the list and choose a specific plugin, which will generate a Telegraf configuration file that you can run with Telegraf.
Selecting a Telegraf plugin will generate a Telegraf configuration file that you can save as a .conf file. Copy and paste the text into a text editor of your choice, and run the file in your terminal with the command telegraf –config ~/filepath. You will need to specify certain variables, such as your account address, access token, and designated bucket. For some third- party plugins, you will also need to set up an account/configure settings to retrieve data using their API.
In this example, we’ll use the GitHub Telegraf plugin.
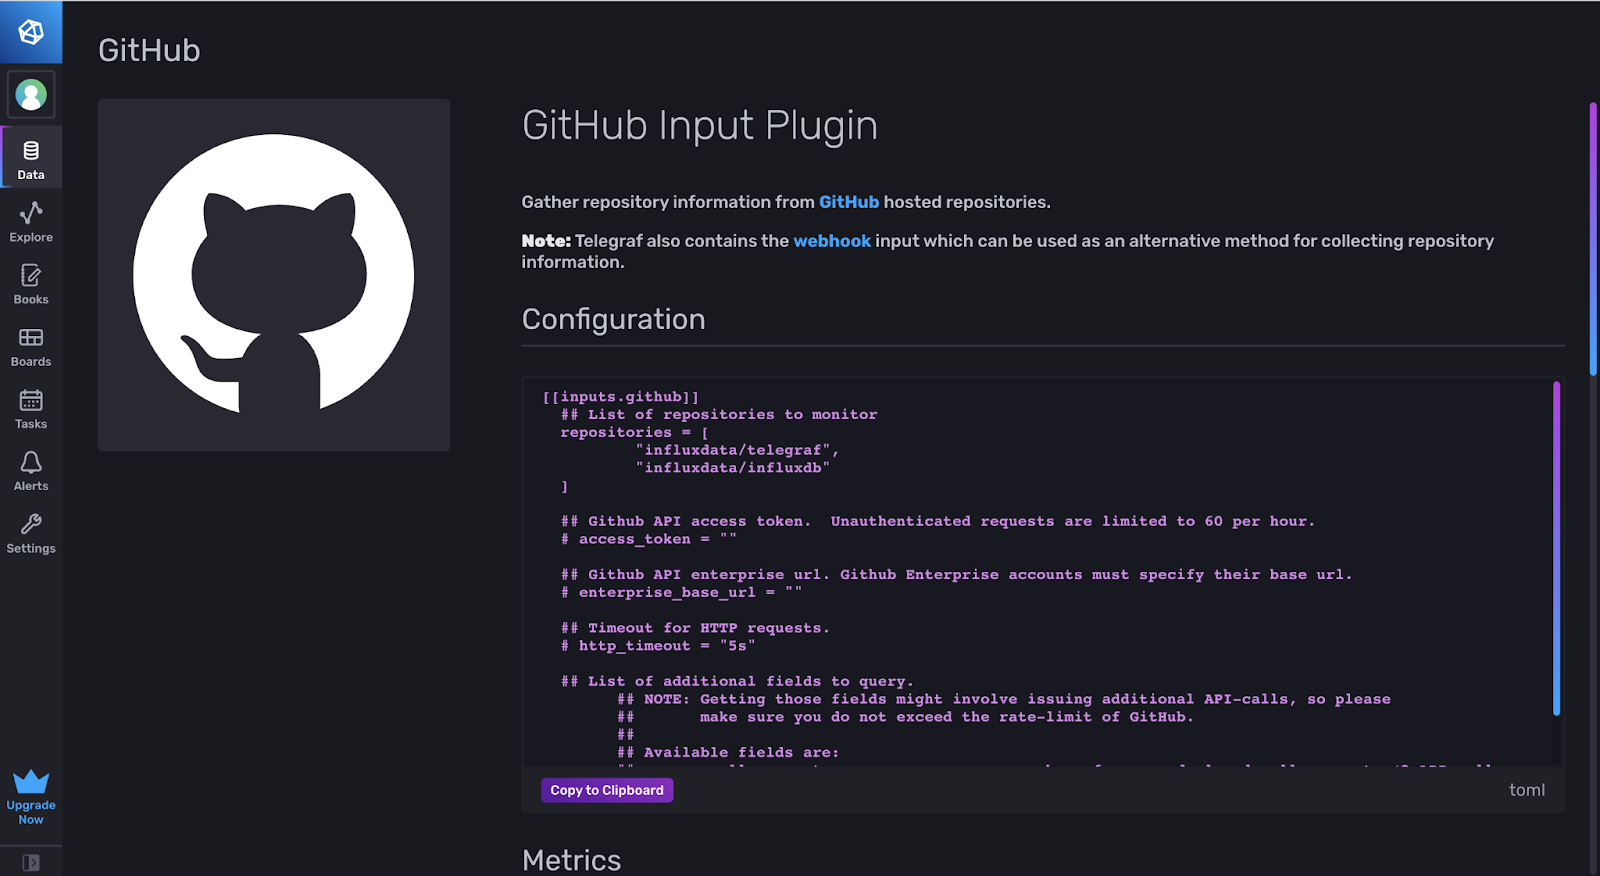
The template defaults to the two repositories influxdata/telegraf and influxdata/influxdb. You will need an access token from the GitHub API that you can find on your profile in the settings. Once you run the telegraf config, Telegraf will fill your InfluxDB Bucket with data. You can now query that bucket using Flux or visualize the data with the built-in Data Explorer.
Getting started with Flux
Learning Flux can be difficult, but the Cloud 2.0 offers a UI framework that makes querying a little easier. It’s best to first experiment with the Data Explorer UI and then see what the Flux code looks like.
Once this data is added, you can set up a query with the Data Explorer, and convert that query into Flux. To do this, choose a bucket and select filters to isolate that data and visualize it on the graph.
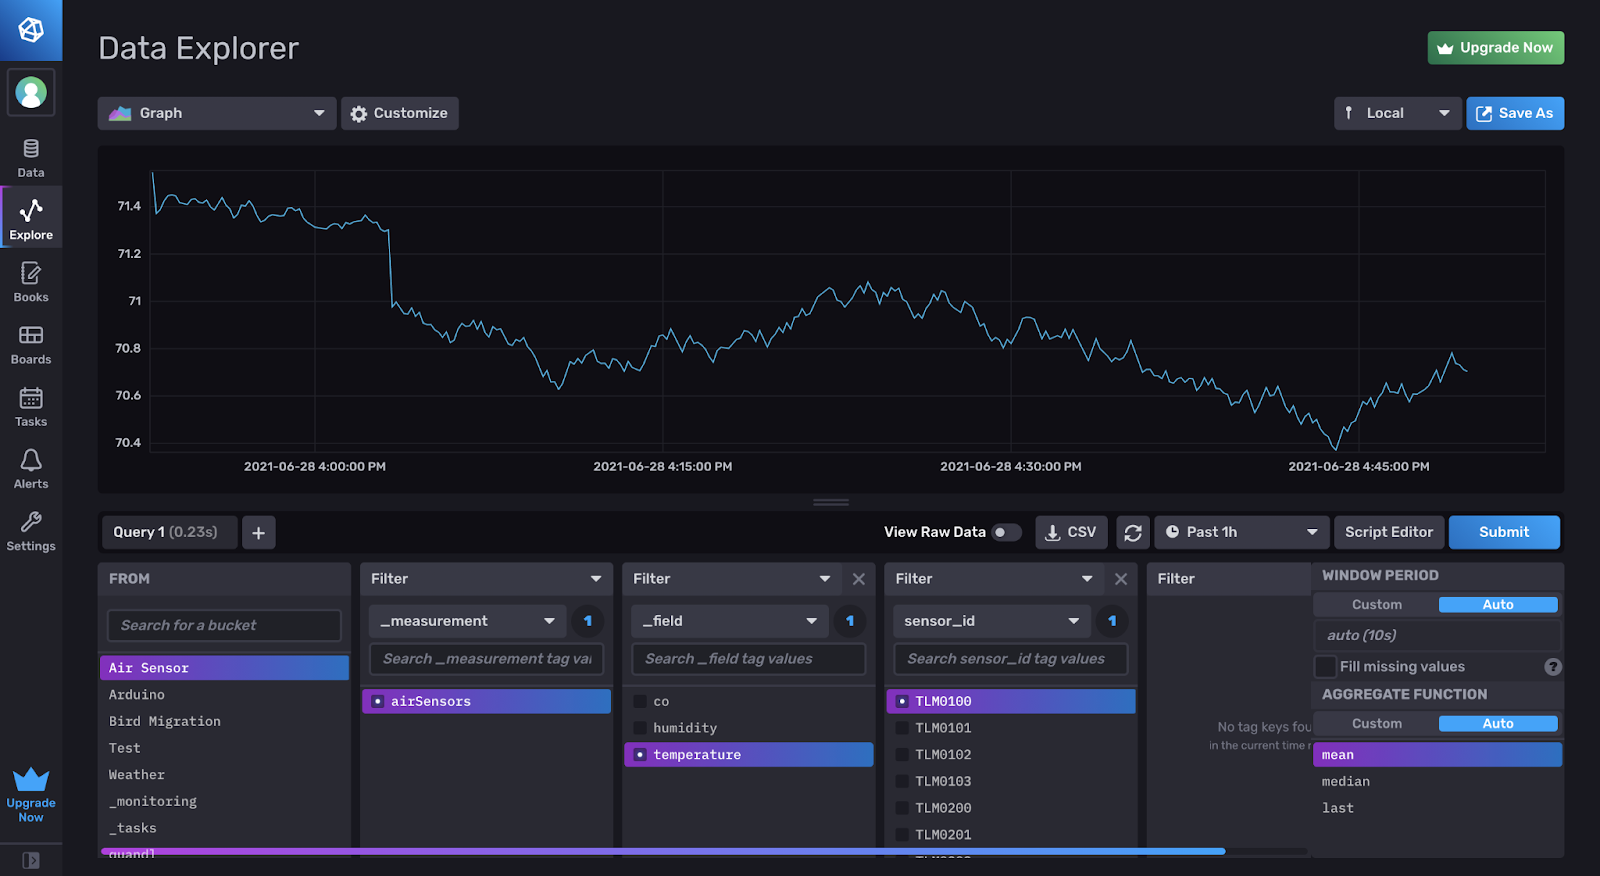
If you click Script Editor, you will see the Flux code for this query.
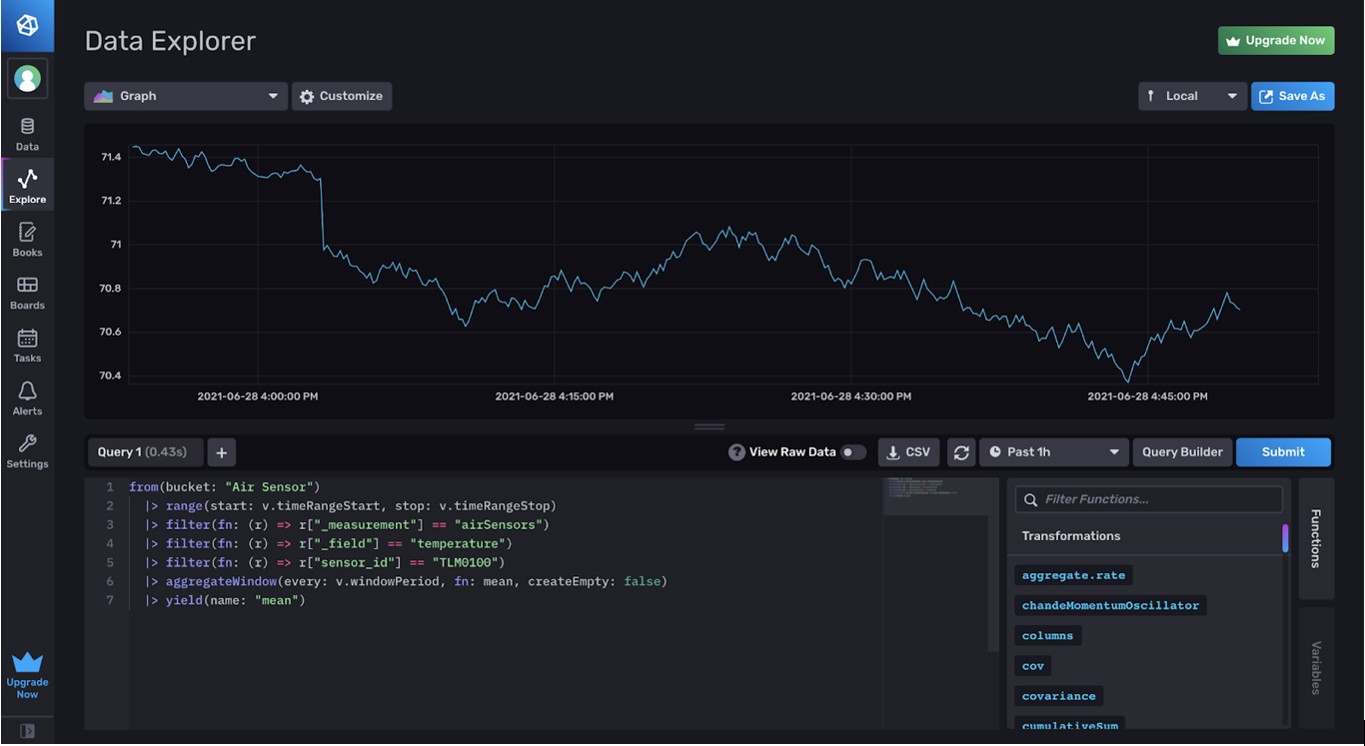
The from() function grabs data from the bucket “Air Sensor”. The variables v.timeRangeStart, v.timeRangeStop, etc. are dashboard variables that you can learn more about here.
The filter functions narrow down the data query to a specific field. In this case, we are filtering the data to grab the temperature from the sensor_id ”TLM0100”. Additionally, the aggregateWindow takes data from a given window period (v.windowPeriod) and averages that data (fn: mean) to make the visual display clearer. It’s basically blocking the data into chunks of averages. The documentation for Flux functions can be found here.
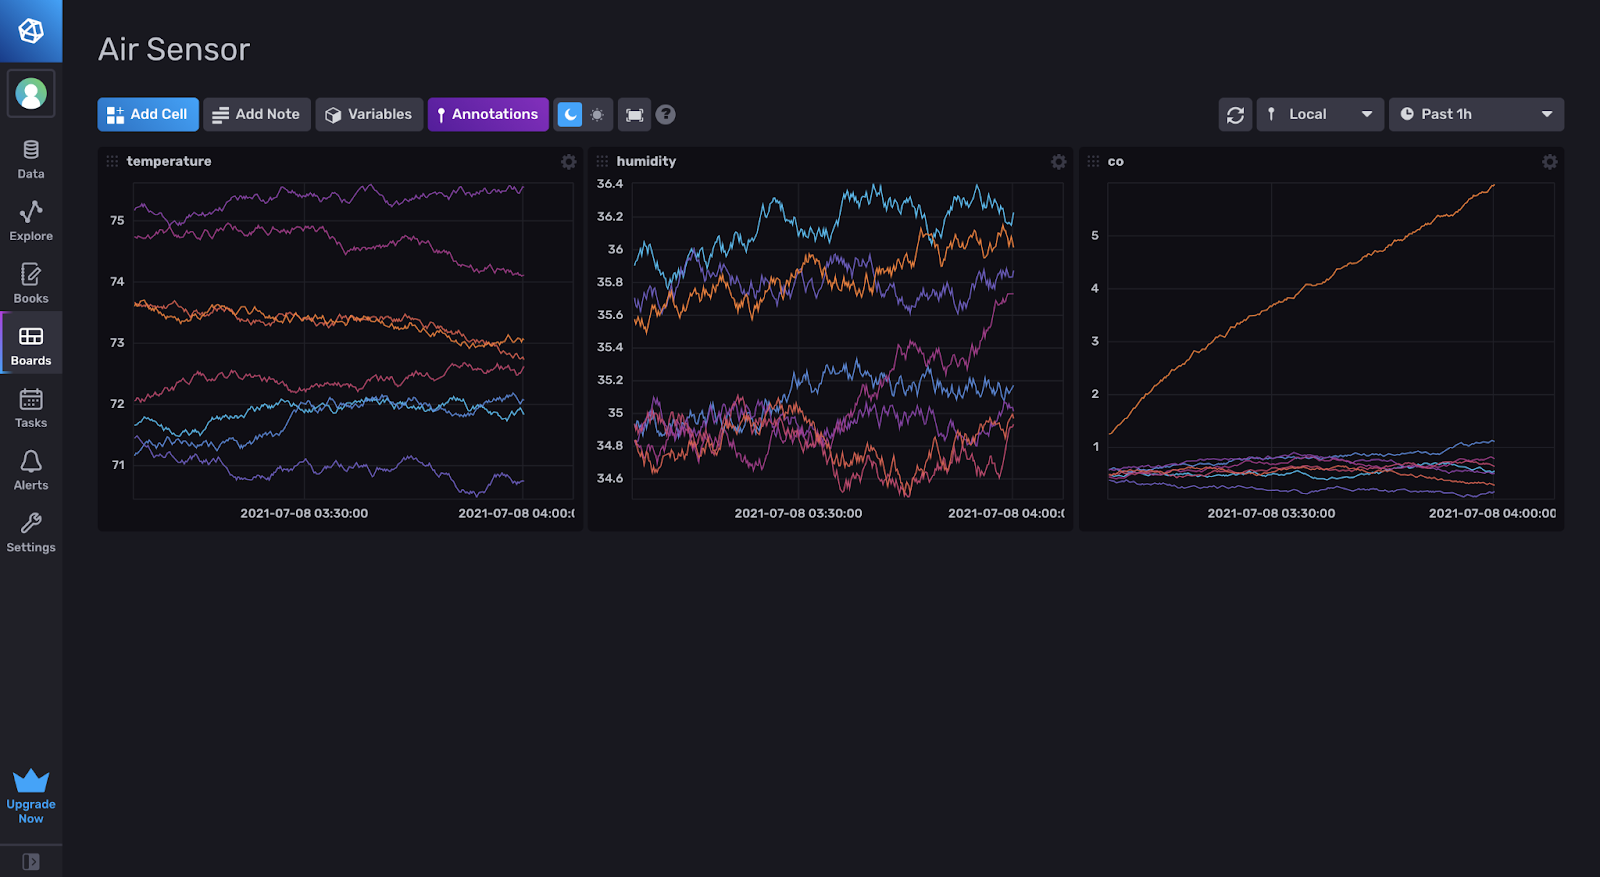
Creating a dashboard
Setting up a dashboard is pretty simple. To add a graph to the dashboard, you can use the Data Explorer and query data with the same UI features. Once you’ve finished querying the data and visualizing it, you can click the green check in the top right, and the query will be added to the dashboard.
Conclusion
InfluxDB offers many simple and easy ways to upload, visualize and filter data. Learning how to use the platform with sample data makes it much easier to plan out future projects with real data and utilize InfluxDB to its fullest potential. Hopefully this challenge walkthrough helped!
