InfluxDB Cloud and Telegraf for the Home Lab
By
Josh Powers
updated December 14, 2025
Use Cases
Product
Developer
Navigate to:
Home labs are popular among technology enthusiasts. Often they are unmonitored and even the smallest home lab can benefit from monitoring. This post will show how getting started with an InfluxDB Cloud account and Telegraf can make this super easy!
InfluxDB is an open source time series database. As such, InfluxDB is well-suited for operations monitoring, application metrics, IoT sensor data, and real-time analytics. Telegraf is a plugin-driven agent for collecting, processing, aggregating, and writing metrics and events. Using Telegraf to send metrics to InfluxDB is the perfect match.
InfluxDB Cloud is InfluxData’s cloud-based solution that allows anyone to experiment with both InfluxDB and Telegraf quickly, easily, and most of all, for free!
InfluxDB Cloud
Getting started with a free account is fast and easy. While the free plan has some limitations on the speed of reads and writes, as well as the 30 days of storage, it is a perfect way to get started and see how InfluxDB Cloud can work for you!
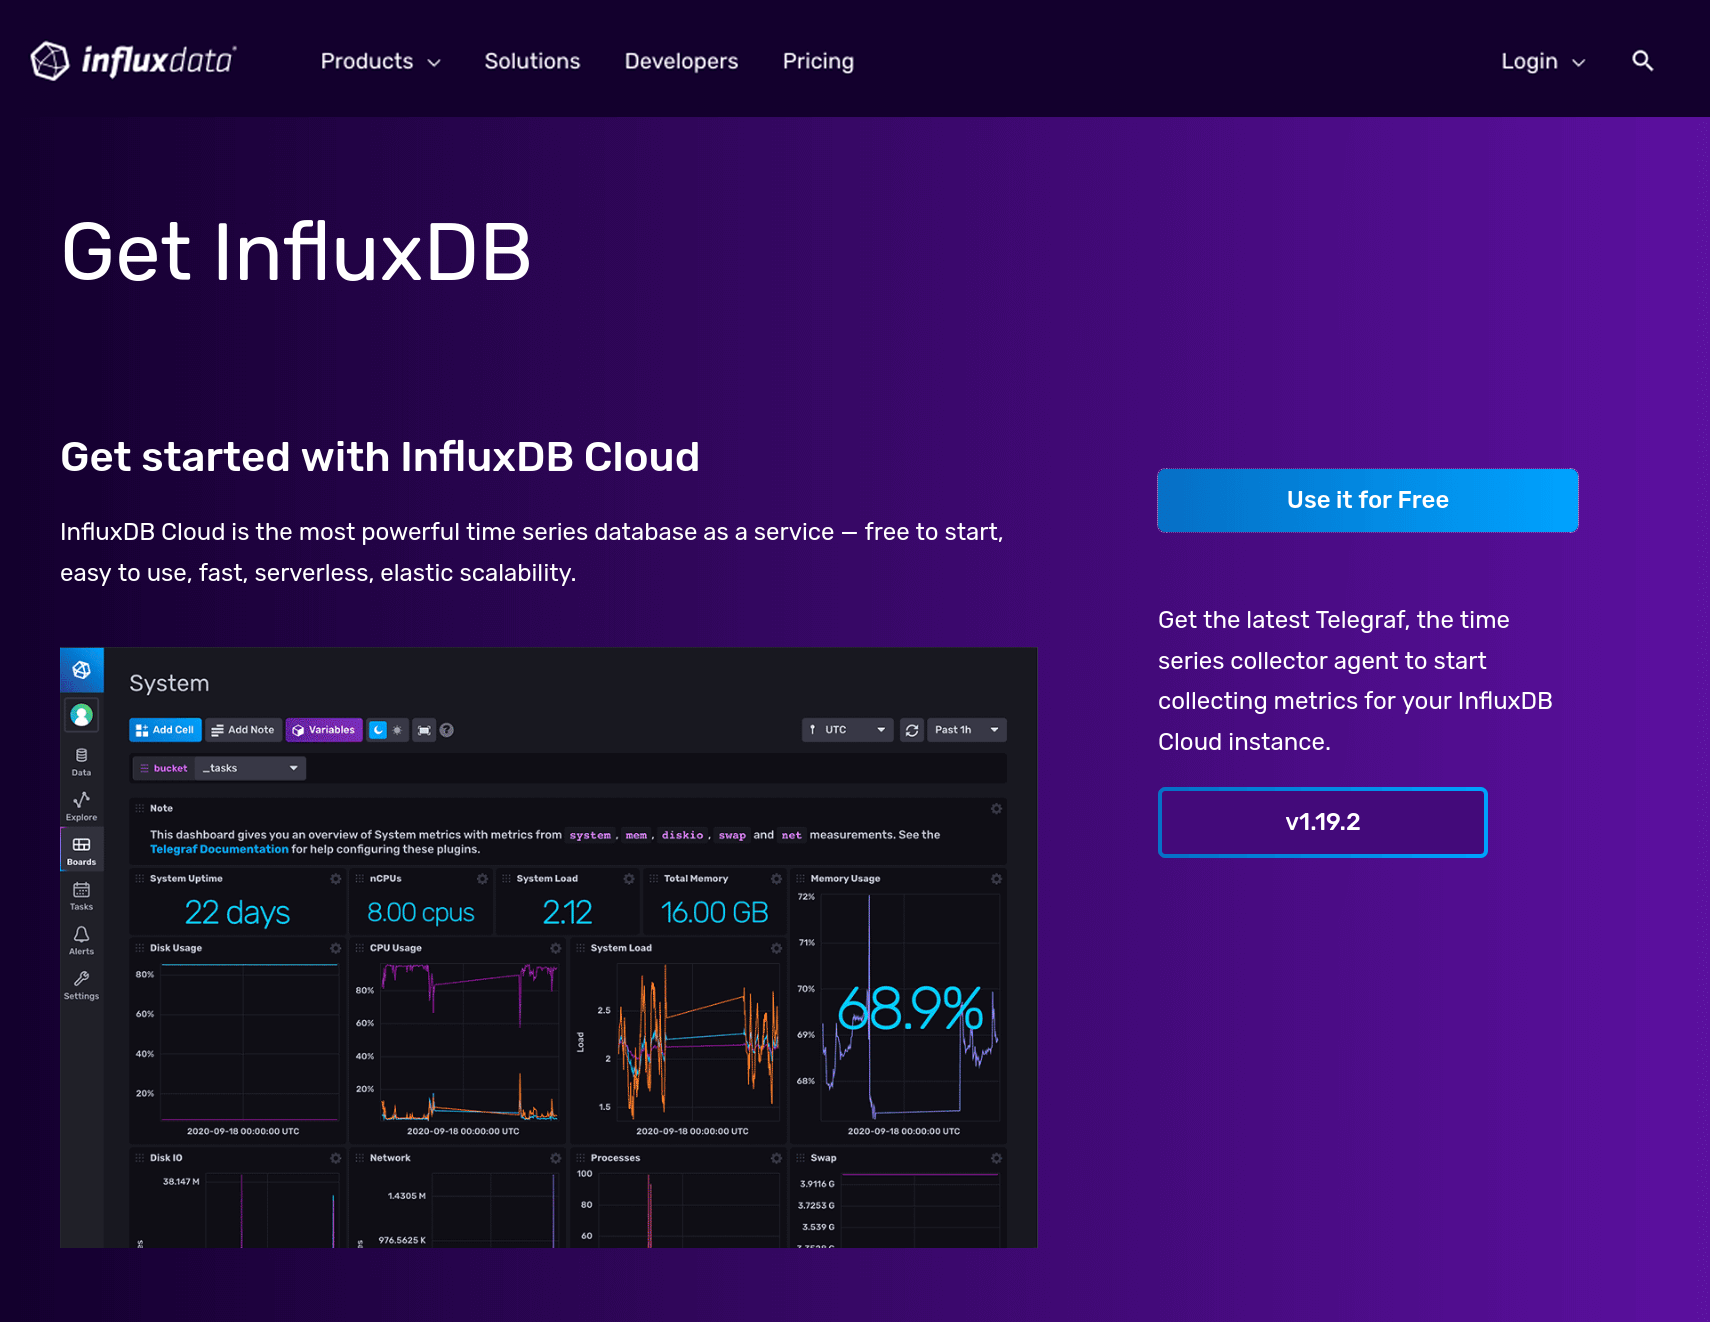
To get started, sign up for InfluxDB Cloud and click “Use It for Free”:
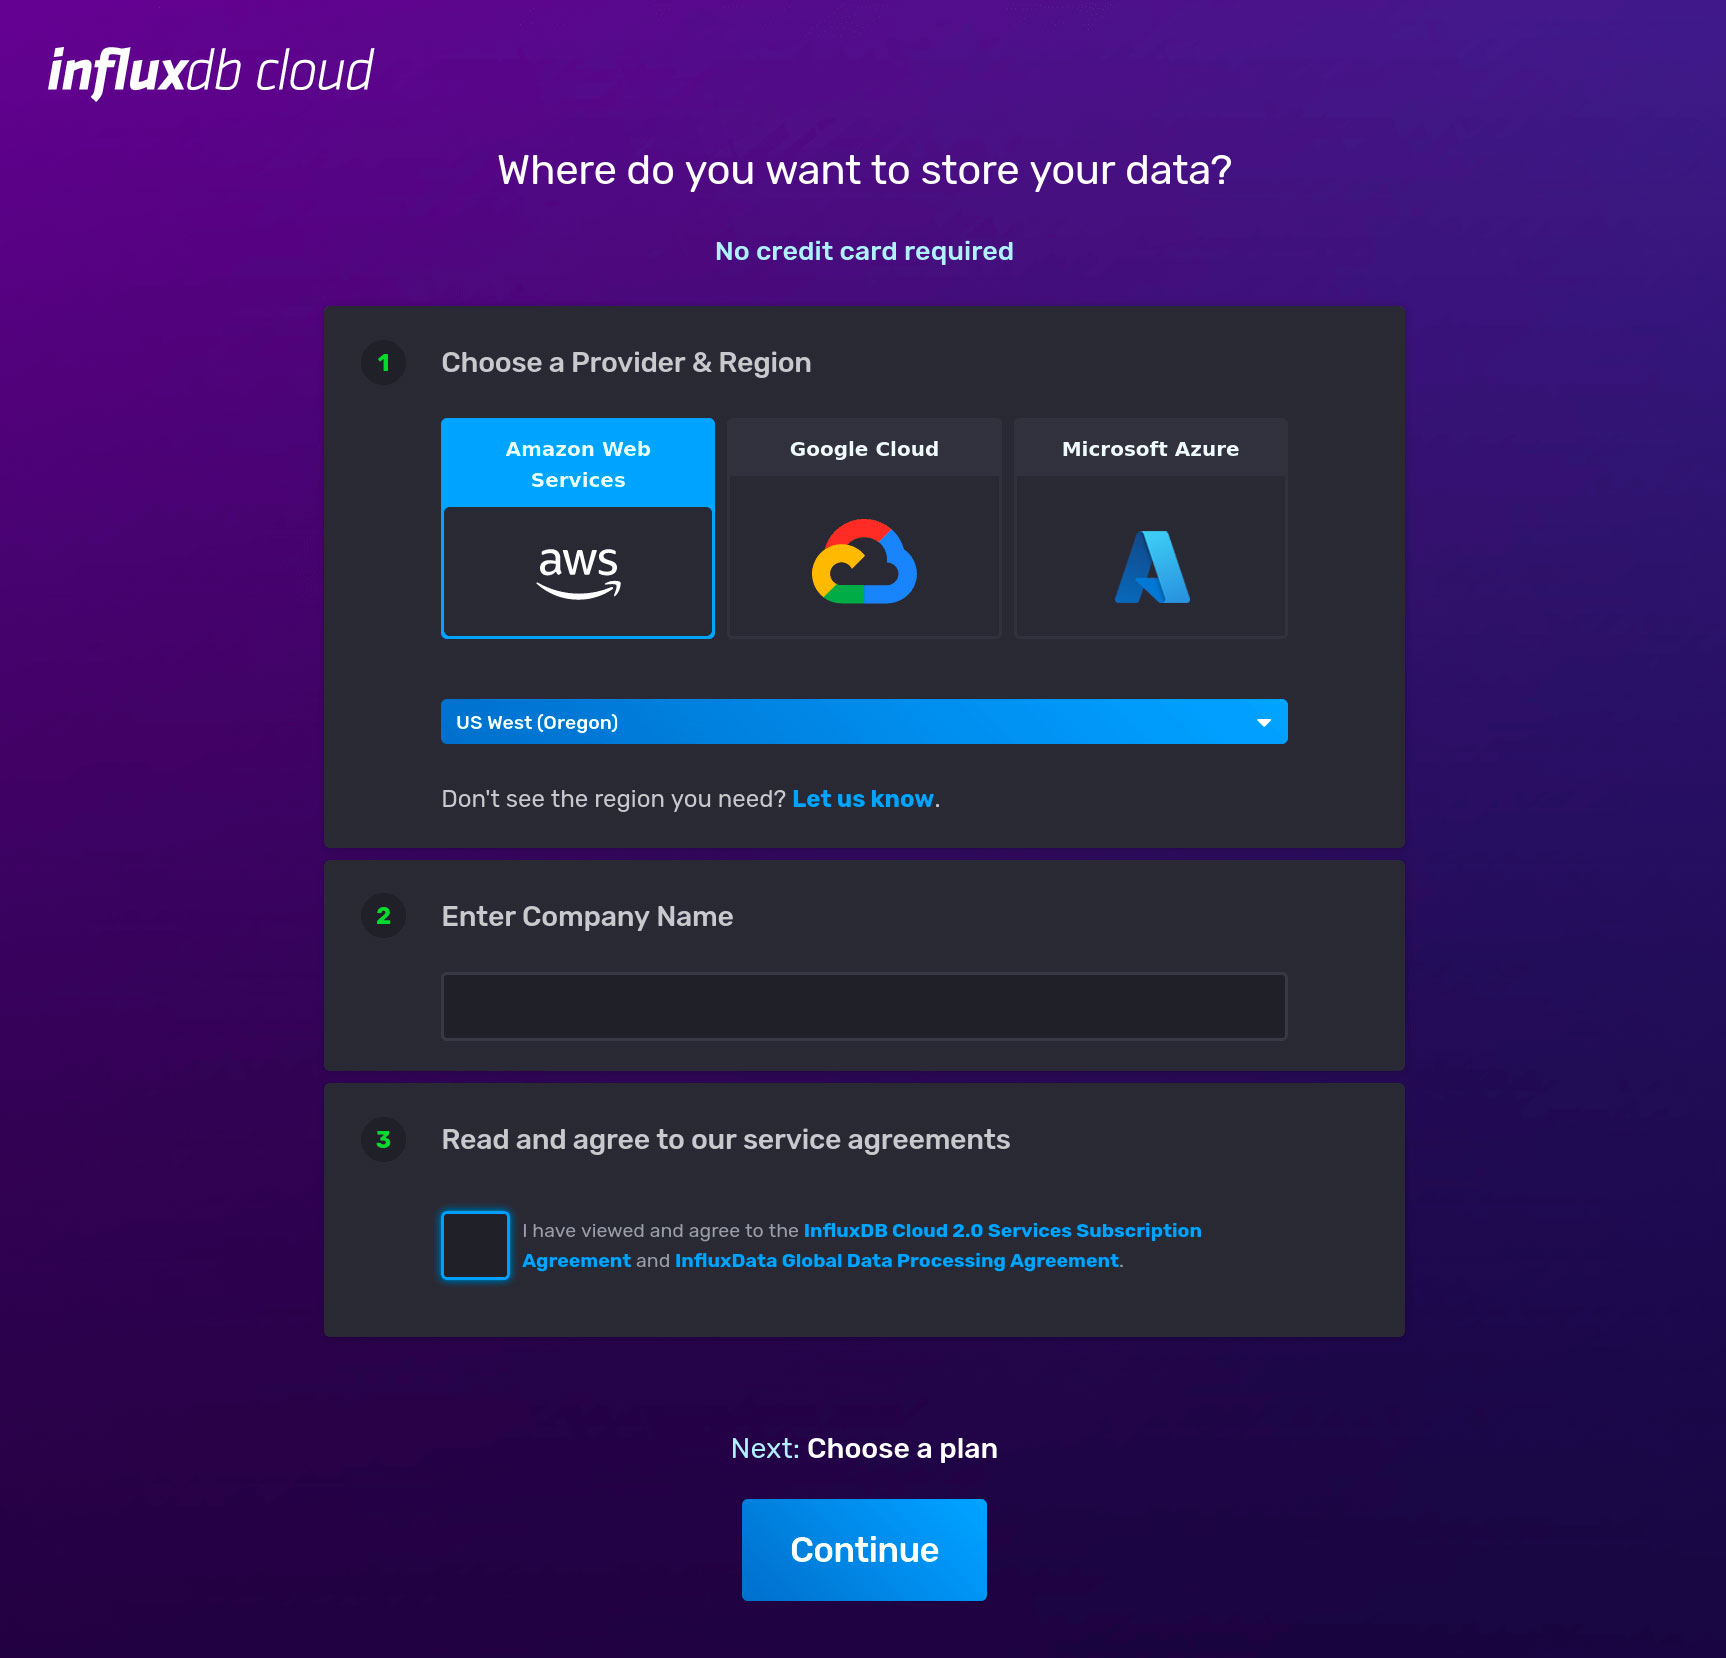
Users can create an account with only an email address and password, no credit card is required! After verifying the email address used for signup, users can continue the signup process and select where they want to store their data from one of the major cloud providers. It is best to choose a cloud provider with a nearby region to ensure data gets there quickly:
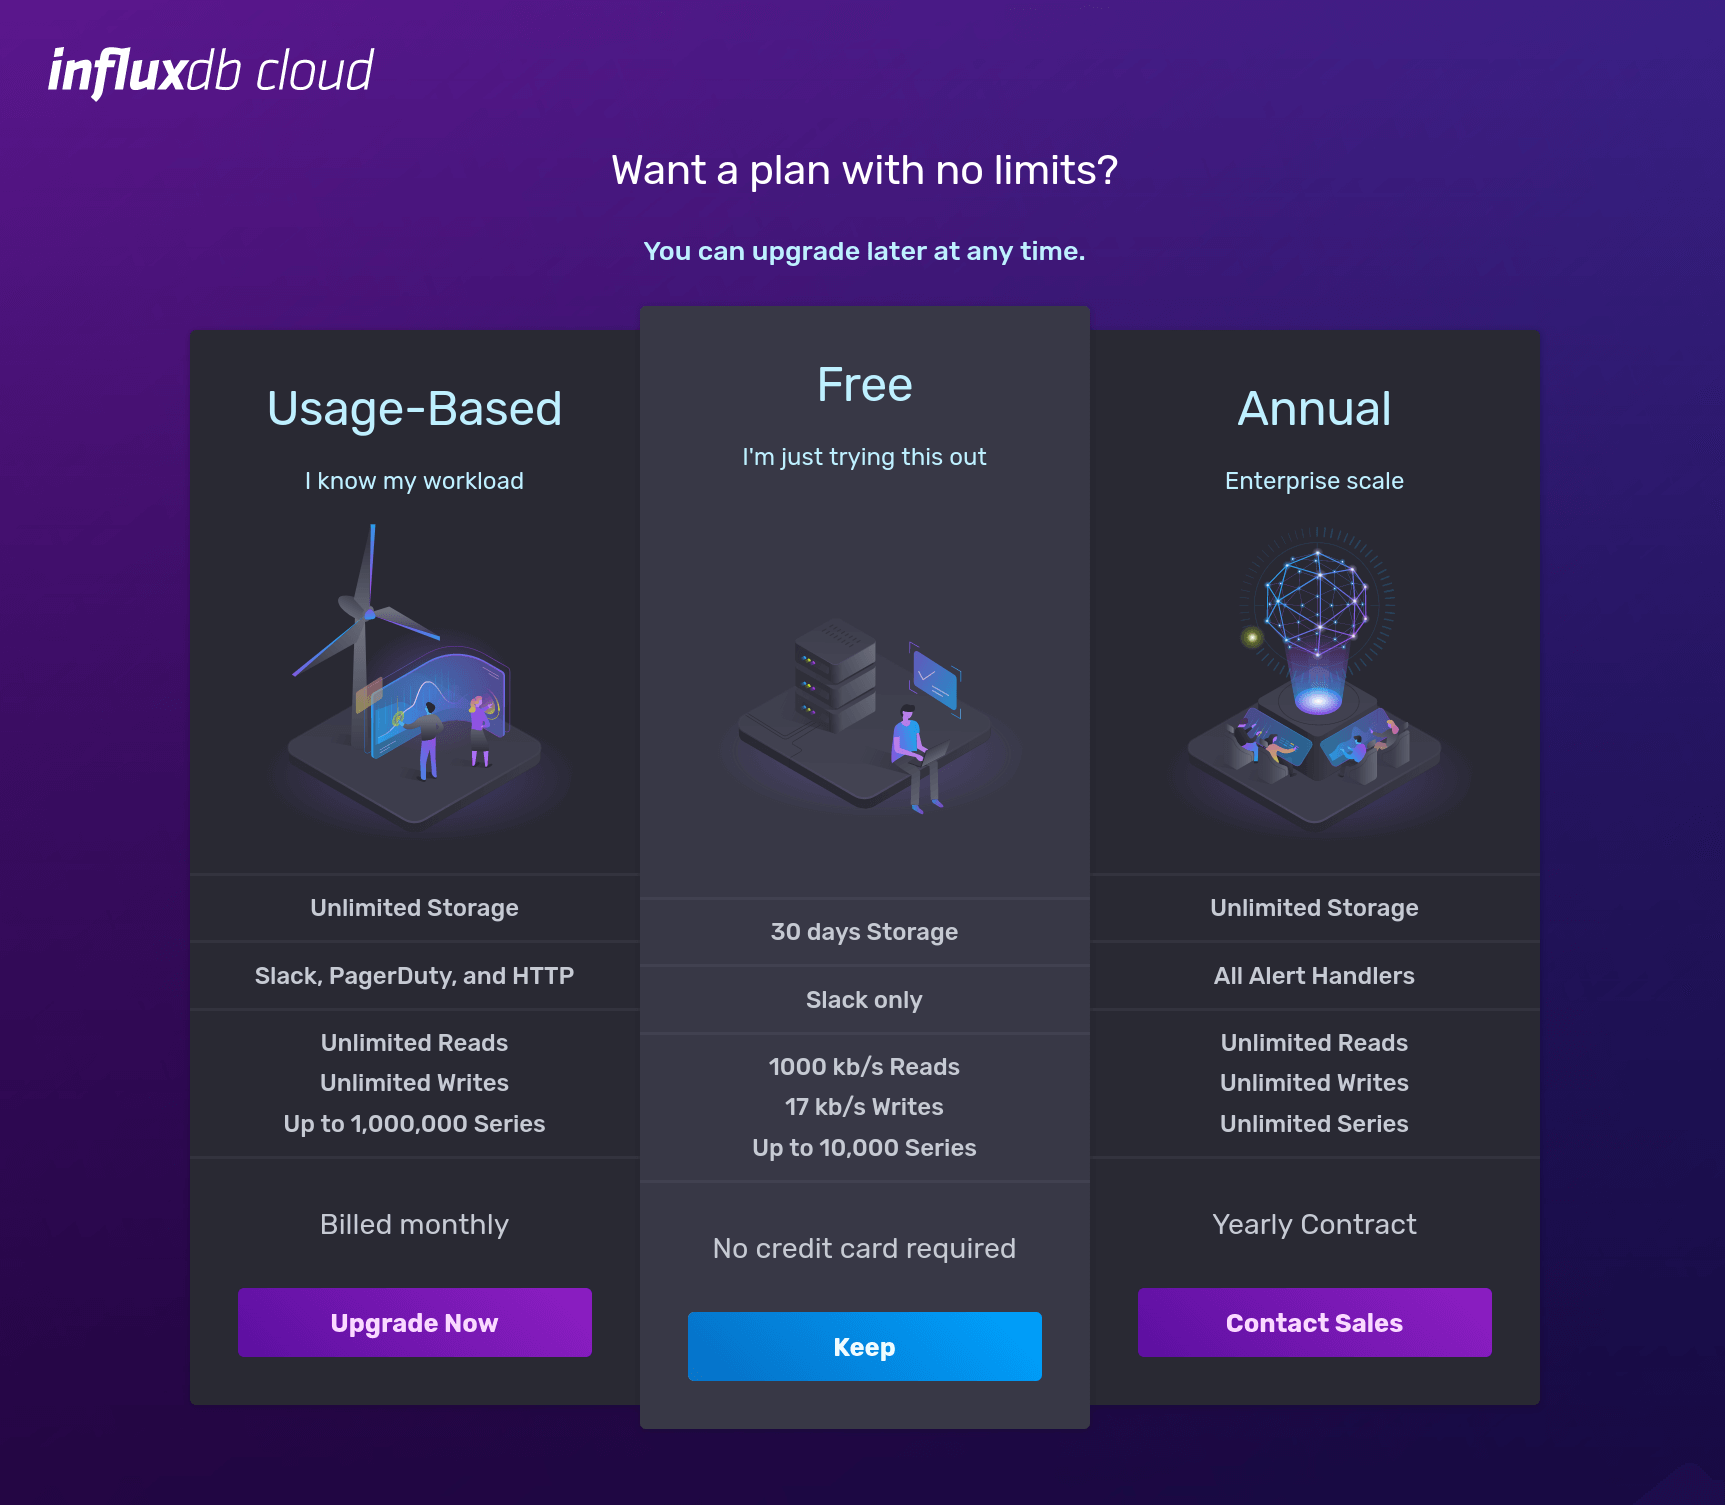
The final step is to select a plan. The free tier is a great way to try this out and, as it says, does not require a credit card. The 30-day storage limitation means that data older than 30 days are expired, and as such, only the last 30 days of metrics will be visible.
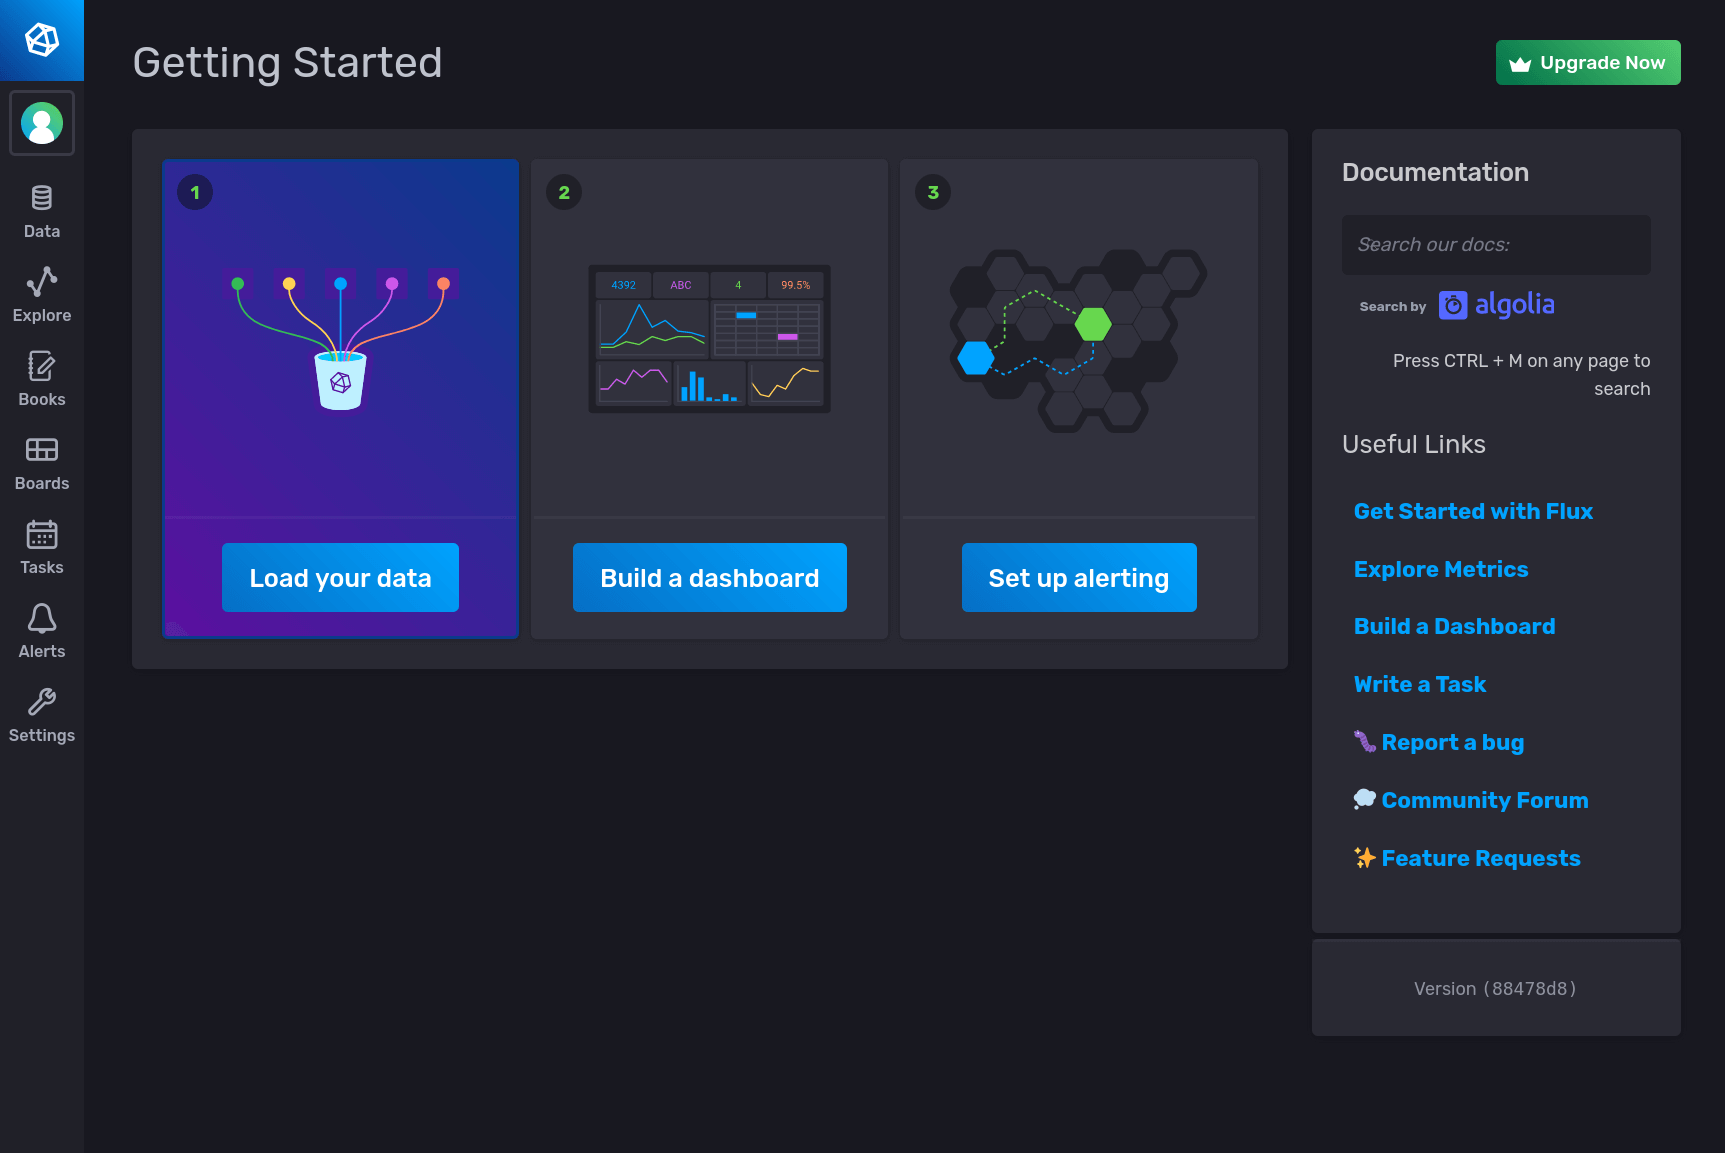
And with that, InfluxDB Cloud is up and ready for usage! The following screen is the main page that will get loaded each time a user comes to InfluxDB Cloud:
Telegraf
The InfluxDB Cloud interface has a special section to help users get started with Telegraf. The user will select what plugins to use for monitoring, and InfluxDB Cloud will automatically create the user’s bucket, access token, and Telegraf configuration. InfluxDB will show the user the exact configuration and command to run to make this process super easy to get started.
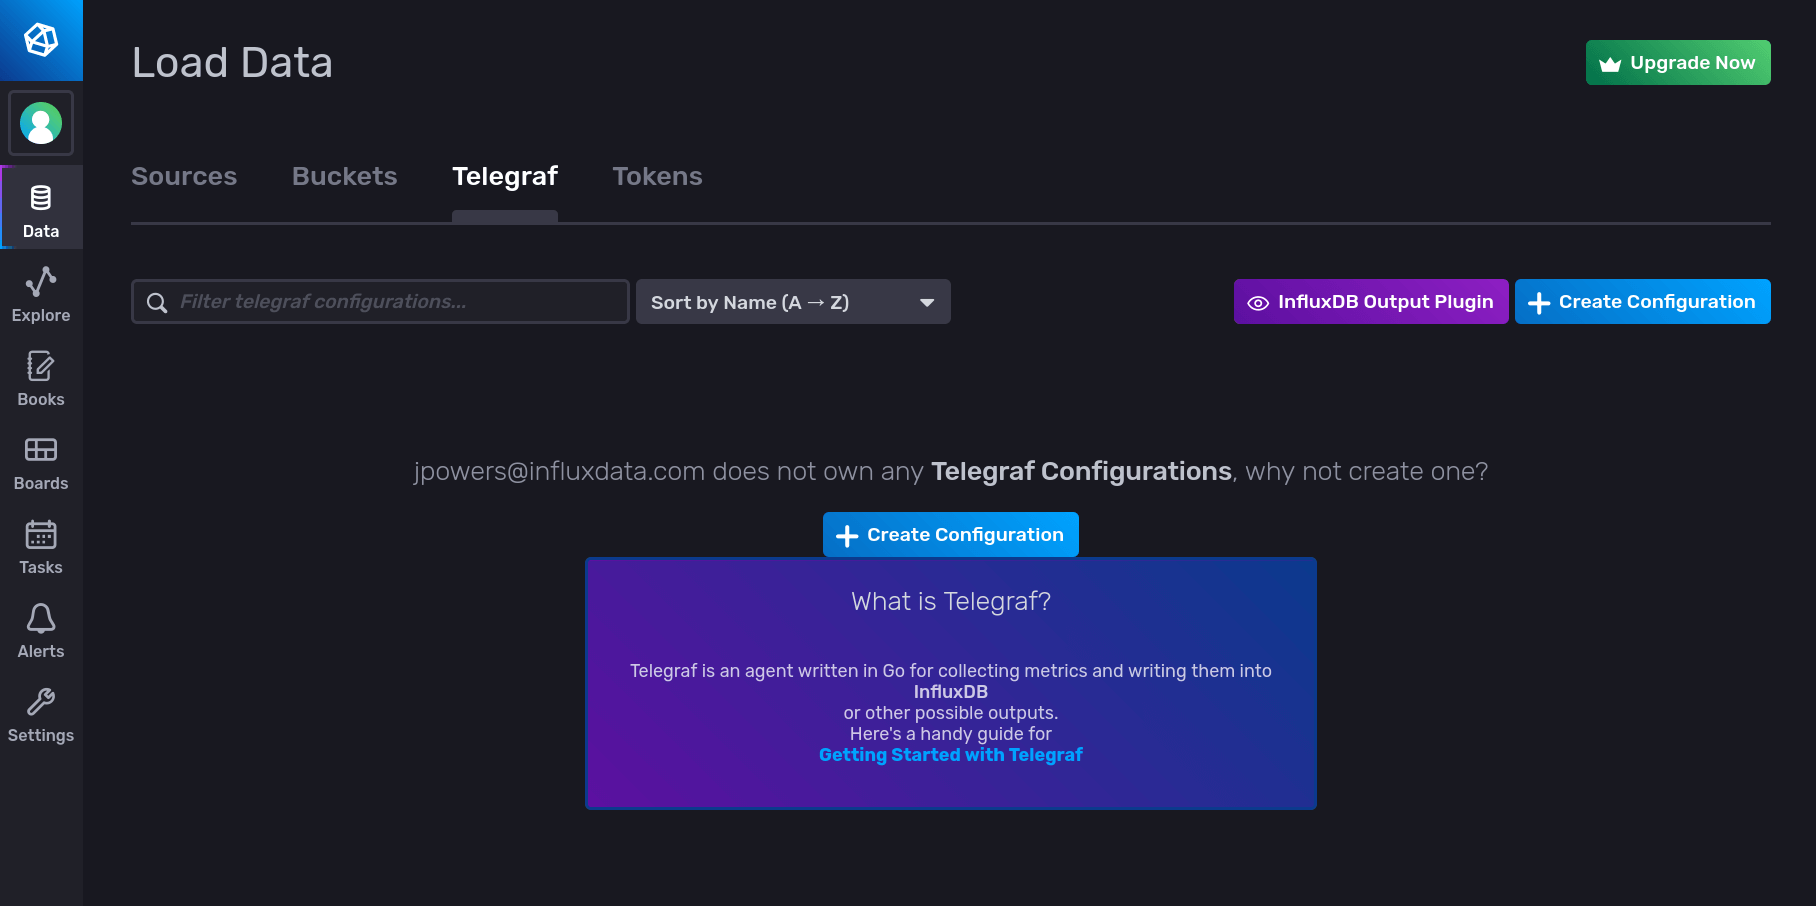
To get started with Telegraf, click on Data and navigate to the Telegraf tab:
By clicking on Create Configuration, users can choose what Telegraf plugins they may want to enable. For the home lab, the “System” plugin will monitor CPU, memory, disk, and network metrics of a system:
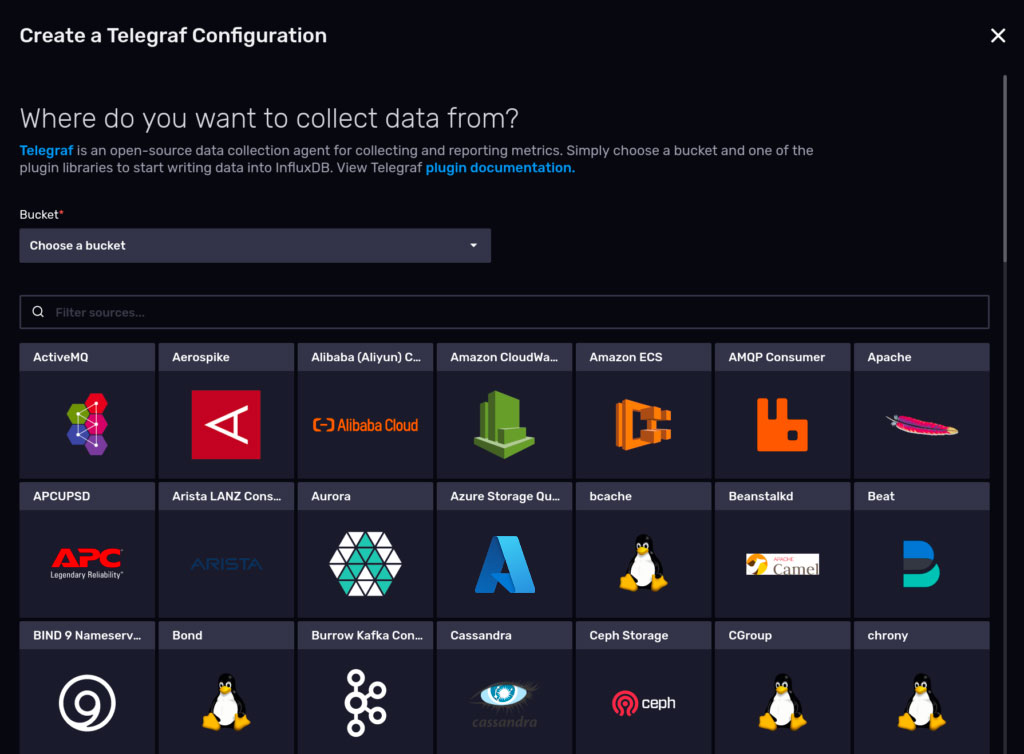
Telegraf has over 200 input plugins, with the ability to collect metrics from containers, clouds, services, and more! Consider looking through the complete list of plugins for ideas where Telegraf can monitor services for other situations.
Finally, the last page will show users where they can download Telegraf from, the secret token to use, and how to start up Telegraf using the custom config. Users should follow these steps on every machine that they want to monitor:
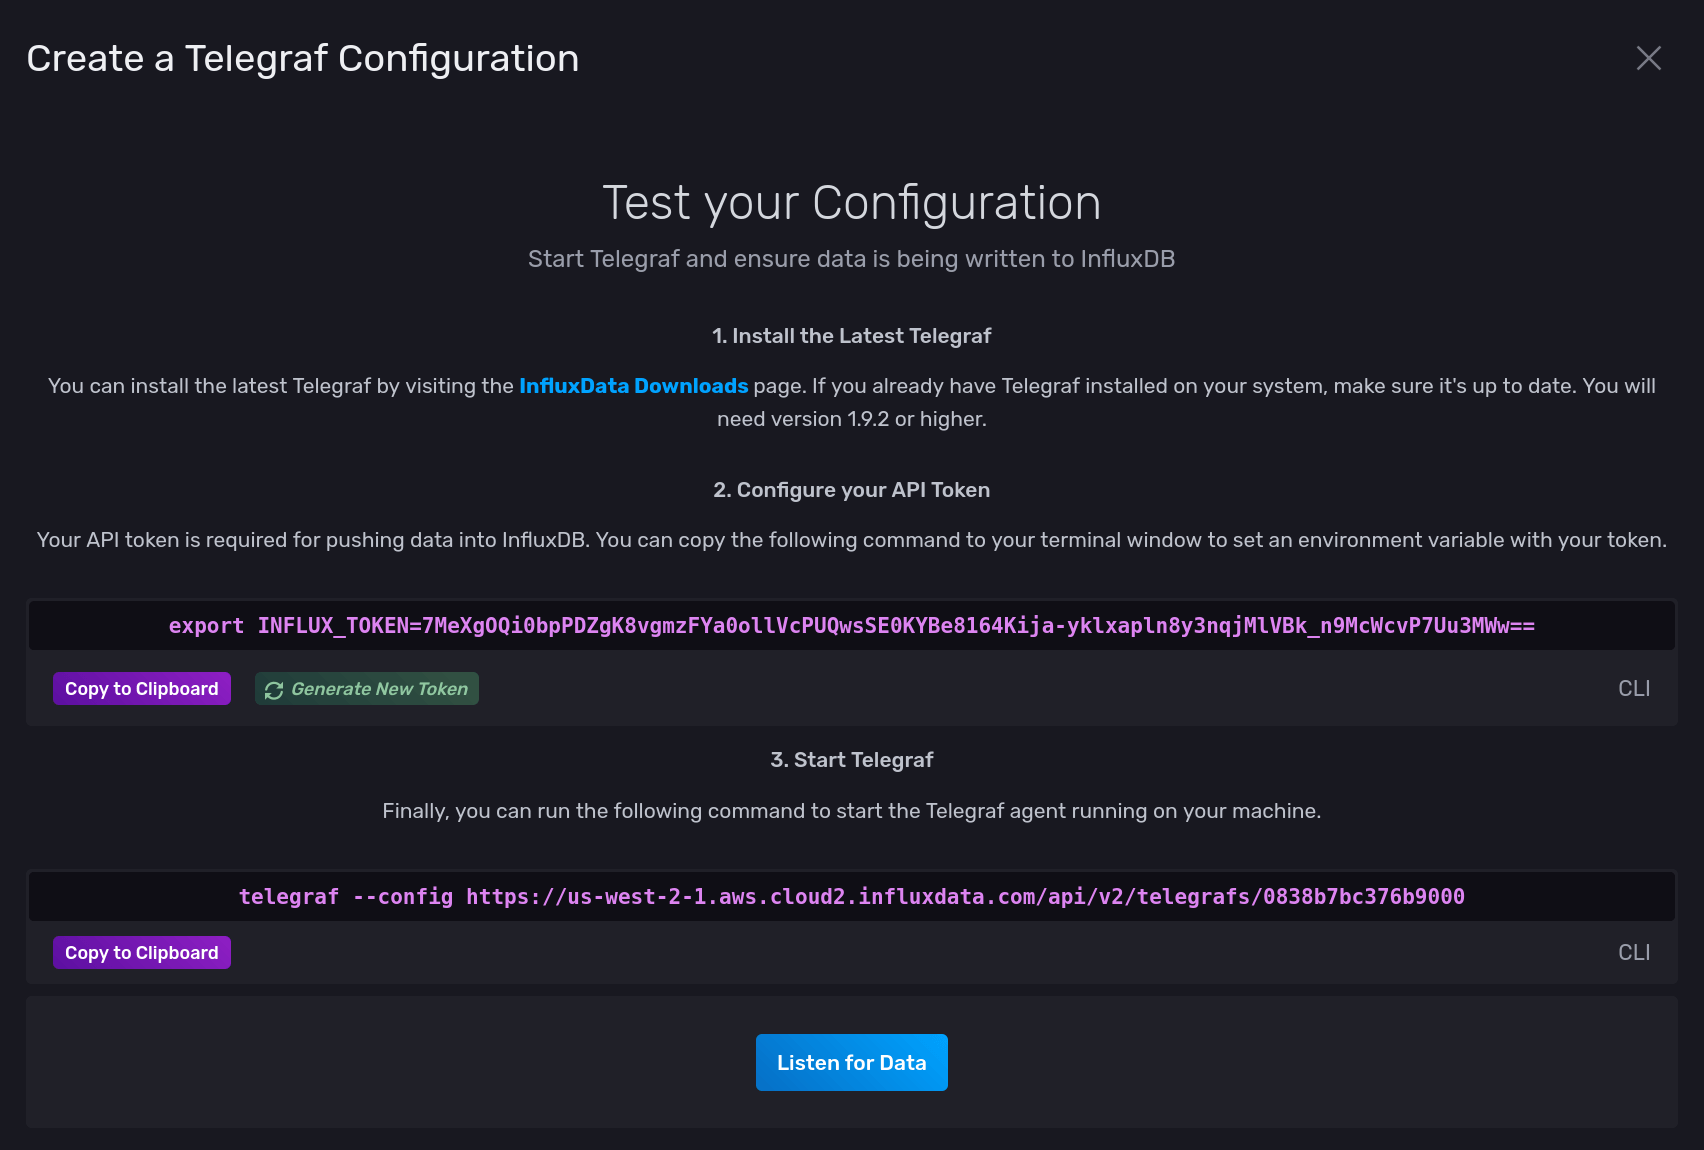
At the bottom is a Listen for Data button. When clicked, InfluxDB Cloud will alert the user if any data comes in over the next minute. The notification will alert users if data is correctly coming into InfluxDB Cloud from Telegraf.
For another example of how easy it is to get started with the InfluxDB Cloud interface and Telegraf, take a look at a previous post using the Aerospike plugin.
Graphs & alerts
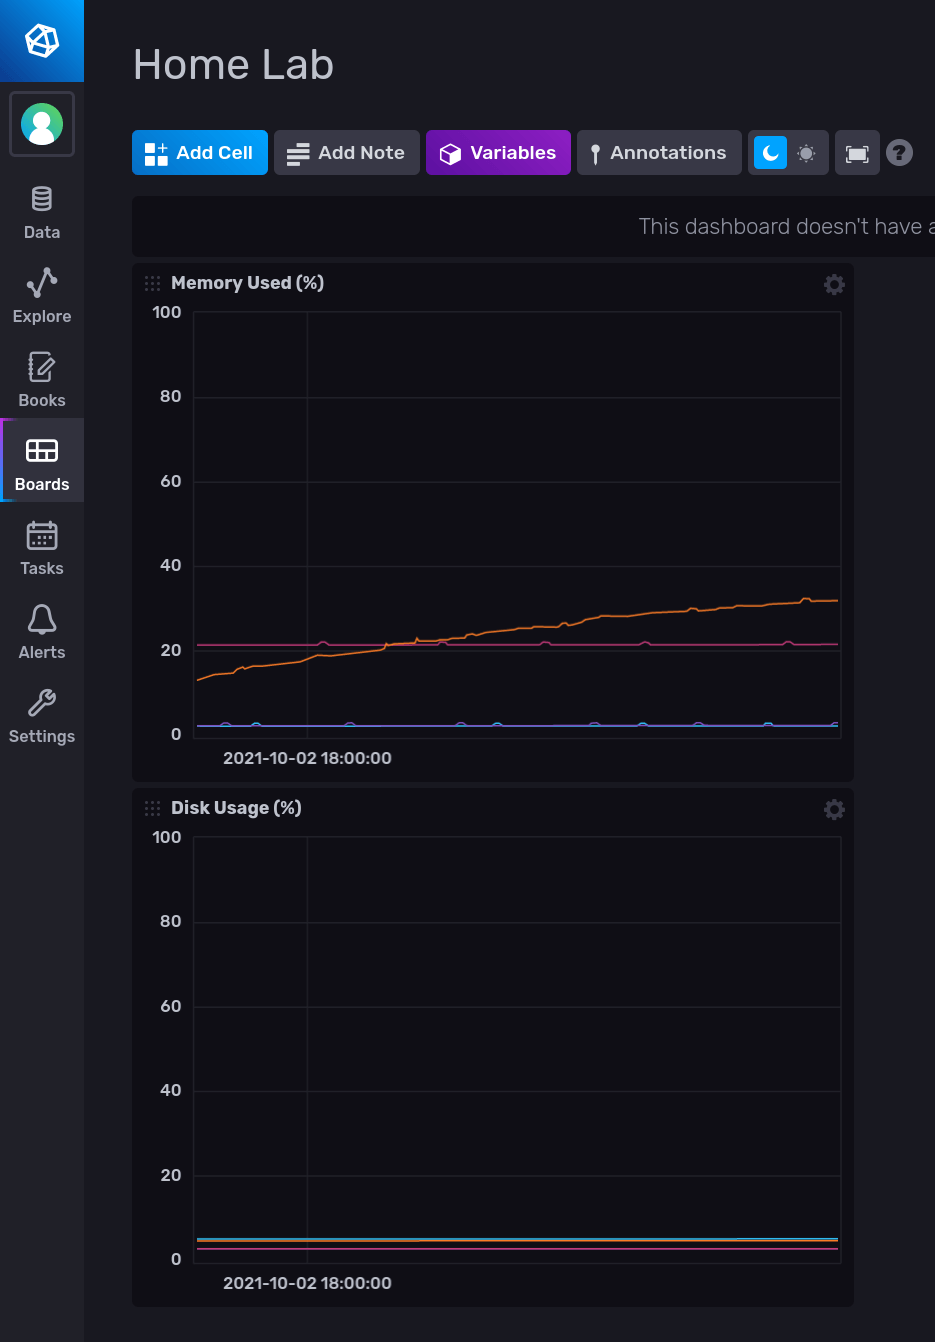
After only a few minutes, users will be able to start graphing data. Users can begin to pick through the data under the “Explore” option on the left-hand side.
As an example, the following two graphs were set up in InfluxDB Cloud, one to track memory usage and the other disk usage:
Additionally, the “Alerts” section is used on the left-hand side to set up events that InfluxDB Cloud can then notify users. For example, a user could set up an alarm if disk usage was over 90%.
Try Telegraf and InfluxDB Cloud
This post has shown how quick and easy it is to assemble valuable and informative metric collection and reporting with Telegraf and InfluxData. The above used a few home lab machines to build this example. However, Telegraf has a vast range of options for collecting metrics. Consider where you might be able to use Telegraf to manage and InfluxDB Cloud to store and monitor, and give it a shot today!
