Using InfluxDB as an IoT Edge Historian
By
Michael Hall
updated December 14, 2025
Product
Use Cases
Developer
Navigate to:
InfluxDB is increasingly being used in IoT solutions to store data from connected devices. Now it can also be used on IoT edge gateways as a data historian to analyze, visualize and eventually transmit aggregated IoT data up to a centralized server. In this article we’re going to look at three simple ways you can connect an instance of InfluxDB on your IoT Edge device to another instance of InfluxDB in the cloud.
Preparing your edge instance of InfluxDB
To begin with, we need a local instance of InfluxDB to use as our edge historian. The simplest way to do this is in your local development to run the official Docker image:
docker run -p 8086:8086 influxdb
Then you will need to complete the setup by going to http://localhost:8086 and following the on-screen instructions. Remember what you use for your Organization during this setup – you’ll need that information later!
Next, navigate to the Load Data -> API Tokens screen, and grab the token string that was generated for you during setup – you’ll need that later too.
Tip: The default token lets you control everything in InfluxDB it’s very powerful. When deploying your solution into production, you’re going to want to create a new, less powerful token that only has permissions to read or write from specific buckets.
Then use these values to setup your Influx CLI, which we will be using extensively in the rest of this article:
influx config create –active –name "edge" –host "http://localhost:8086" –org "your_edge_org" –token "your_edge_token"
Now it’s time to setup a bucket on this instance to store our device data in:
influx bucket create --name "devices" --retention 1h
We’re using a 1 hour retention policy on this bucket. In a real world scenario where you’re gathering a lot of high-frequency sensor data on a relatively low-powered IoT edge device, you’re not going to have a lot of space to store it indefinitely. InfluxDB’s retention policies make it easy to put a limit on that. Don’t worry about losing data though this article will show you how to keep that data around long-term by transmitting it up to your cloud instance.
Faking an IoT device
While the rest of this article will work for any IoT data you are collecting, we’re going to keep the examples simple by using a mock device to generate some artificial sensor data. To do that we’re going to use the new inputs.mock plugin from the Telegraf project. We will generate two fields: temperature and humidity, like you might get from an inexpensive DHT sensor.
First we’ll generate a new Telegraf configuration using just the plugins we need for this article:
telegraf --aggregator-filter none --processor-filter none --input-filter mock --output-filter influxdb_v2 config > telegraf.conf
This will create a new file for you named telegraf.conf with sections for inputs.mock and outputs.influxdb_v2.
You will need to fill these sections in with the following data:
[[outputs.influxdb_v2]]
  urls = ["http://127.0.0.1:8086"]
  token = "your_edge_token"
  organization = "your_edge_org"
  bucket = "devices"
And
[[inputs.mock]]
  ## Set the metric name to use for reporting
  metric_name = "dht"

[[inputs.mock.stock]]
  name = "temperature"
  price = 20.0
  volatility = 0.05

[[inputs.mock.stock]]
  name = "humidity"
  price = 50.0
  volatility = 0.05

[inputs.mock.tags]
  "device_id" = "001"
The first section tells Telegraf how to connect to your edge instance to write data to it. Use the organization name and token string you captured during the setup of your edge instance.
The second section defines our mock device with temperature and humidity fields, and device_id tag. Here I’m using the inputs.mock.stock type to generate a field with a value that changes randomly but gradually over time, as temperature and humidity would. There are other generator types that you can use to more accurately simulate other forms of data.
Tip: You can use multiple inputs.mock sections to simulate multiple devices at the same time, giving them each a different device_id tag value.
We’re also going to change the default Telegraf collection interval to one second, because IoT devices don’t typically wait 10 seconds between records, so scroll up to the agent section and change the interval to 1s like this:
[agent]
  ## Default data collection interval for all inputs
  interval = "1s"
Now you can start Telegraf using this configuration and let it start sending data to your edge instance while we get your cloud instance ready:
telegraf –config ./telegraf.conf
Preparing your cloud instance of InfluxDB
Your cloud instance is going to be where you aggregate data from multiple edge devices at once. It doesn’t have to be “in the cloud” specifically, it can be running in your private data center or anywhere else, the key thing is that it’s somewhere all of your edge devices can talk to it. If you don’t already have such an instance available, you can sign up for a free account on the InfluxDB Cloud platform. Everything in this article will run within the free tier, so it won’t cost you anything to follow along.
Just like with our edge instance, you will need to gather the host, organization name, and access token from your cloud instance. Then we’ll use them to create a second configuration in the CLI, so you can switch back and forth between your edge instance and your cloud instance:
influx config create –active –name "cloud" –host "your_cloud_host" –org "your_cloud_org" –token "your_cloud_token"
Tip: You can see both of your configurations by running influx config list, and switch between them using influx config edge or influx config cloud respectively.
Then we’re going to create a bucket to store data coming in from our edge devices:
influx bucket create --name "edge_devices" --retention 30d
Unlike our devices bucket on our edge instance, here we will use a 30 day retention policy, because our cloud instance has room for that (and it fits within the free tier use limits for InfluxDB Cloud).
Store cloud authentication in your edge host
This step is optional, but highly recommended. You’ll need to use your cloud credentials in Flux tasks to connect to your cloud instance from your edge instance, but keeping those credentials in plain text in your scripts is poor security.
So instead we’re going to make use of InfluxDB’s built-in secret store to put those in a write-only space that we can reference from our scripts, using the following commands:
influx config edge
influx secret update --key cloud_host  --value "your_cloud_host"
influx secret update --key cloud_org   --value "your_cloud_org"
influx secret update --key cloud_token --value "your_cloud_token"
Basic Store and Forward
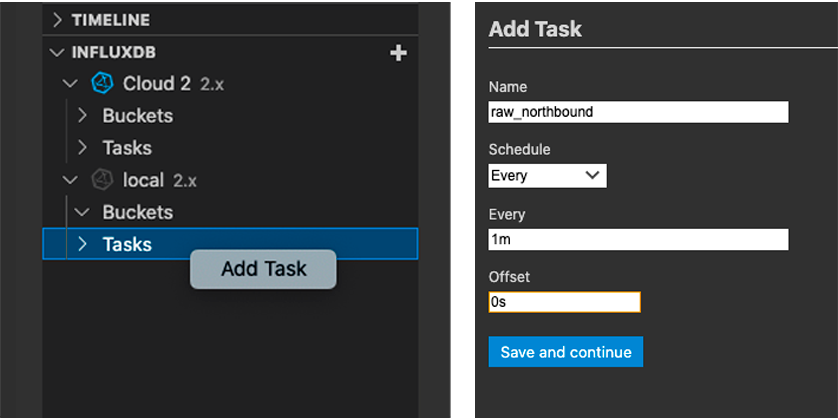
The simplest setup is to take all of the data from your edge instance, and forward it as-is up to your cloud instance. To do that, create a new Task on your edge instance, set to run every minute.
You can do this from the UI at http://localhost:8086 or using the VisualStudio Code plugin for Flux, which is the way I did it:
The we’ll use the following Flux script for the task:
import "influxdata/influxdb/tasks"
import "influxdata/influxdb/secrets"

option task = {name: "northbound", every: 1m, offset: 0s}

cloud_host = secrets.get(key: "cloud_host")
cloud_org = secrets.get(key: "cloud_org")
cloud_token = secrets.get(key: "cloud_token")

from(bucket: "devices")
|> range(start: tasks.lastSuccess(orTime: -1h))
|> set(key: "edge_id", value: "001")
|> to(host: cloud_host, org: cloud_org, token: cloud_token, bucket: "edge_devices")
Let’s walk through this step by step:
import "influxdata/influxdb/tasks"
import "influxdata/influxdb/secrets"
The import lines bring some key functionality into our Task’s script. The first line gives us a tasks package that we will use to find the last time this task ran successfully. The second line gives us a secrets object which will give us access to the cloud credentials we saved to the InfluxDB secret store previously.
option task = {name: "northbound", every: 1m, offset: 0s}
This line was automatically included for us when we created this new task, using the values we entered in the VSCode form. This is how InfluxDB Tasks store these values.
cloud_host = secrets.get(key: "cloud_host")
cloud_org = secrets.get(key: "cloud_org")
cloud_token = secrets.get(key: "cloud_token")
The next three lines retrieve our saved secrets, and place them in Flux variables. We will pass these variables to our Flux to() function so that it can connect to our cloud instance.
from(bucket: "devices")
|> range(start: tasks.lastSuccess(orTime: -1h))
The first part of our query specifies what data to fetch from our local edge instance. We’re reading data from the devices bucket that we configured Telegraf to write to. Here we’re using the tasks package we imported earlier to find the last time that this task ran, this will let us only fetch new data that hasn’t already been sent to the cloud, saving us some bandwidth. It also makes this task more robust because if it fails for whatever reason (such as a connectivity issue between your edge and cloud) the next run will include all the data from the previous one.
The orTime parameter provides a default time, which will be used the first time the task is run.
|> set(key: "edge_id", value: "001")
This next line adds a bit of extra information to our data. In a typical edge IoT scenario you’re going to have more than one edge location, and each location is going to have multiple devices. We’re already collecting a device_id from Telegraf, but there’s nothing in that data that says what edge location it was being collected from. Once we have data from multiple locations being mixed together in the cloud it would be difficult to distinguish between them. So here we’re going to inject an edge_id into the datastream before sending it, to identify our edge location.
|> to(host: cloud_host, org: cloud_org, token: cloud_token, bucket: "edge_devices")
Finally we’re ready to send the data up to the cloud! This last step only takes a single function call, the built in to() function, which can write your query data to a local bucket or, in this case, ro a remote bucket by passing in the authentication credentials for our remote InfluxDB instance.
That’s it! Save your task and from now on all of your local data will be copied up into your cloud instance, every minute, automatically!
Downsampling before Forwarding
While the task we just wrote is simple and works well, it’s still going to be sending a lot of data up to your cloud. In a real world scenario you’re going to have dozens, if not hundreds, of devices on each edge, and some of them will be producing data multiple times per second, or even microsecond! Even with our mock device we’re producing a new value every second. That’s a lot of very detailed data that you most likely don’t need for the high level use cases you’ll be running in the cloud, it’s just going to take up extra bandwidth to transfer and extra space to store.
Instead, what if we could reduce the volume of data before we send it, even if that means losing some of the granularity? This process is known as downsampling or materialized views, and is extremely common when moving data up to higher and higher levels. It’s also extremely easy to do with Flux, right inside our task! Here’s what it looks like:
import "influxdata/influxdb/tasks"
import "influxdata/influxdb/secrets"

option task = {name: "northbound", every: 1m, offset: 0s}

cloud_host = secrets.get(key: "cloud_host")
cloud_org = secrets.get(key: "cloud_org")
cloud_token = secrets.get(key: "cloud_token")

from(bucket: "devices")
|> range(start: tasks.lastSuccess(orTime: -1h))
|> aggregateWindow(every: 5m, fn: mean, createEmpty: false)
|> set(key: "edge_id", value: "001")
|> to(host: cloud_host, org: cloud_org, token: cloud_token, bucket: "edge_devices")
As you can see, we only needed to add a single line to our Flux code:
|> aggregateWindow(every: 5m, fn: mean, createEmpty: false)
This line takes the data we’re reading from our bucket, and calculates the average (mean) value of each field over a rolling 5 minute window, reducing 300 individual measurements into just one. Then that dowsampled data is sent to our cloud instance just like before.
Flux provides a number of built-in aggregation functions beyond mean, you can instead calculate the min, max, integral, standard deviation, and much more! You can also define your own aggregation function if you want something more complex, like a swinging door compression algorithm, it’s entirely up to you.
Adapting for high resiliency at the Edge
By now we have a task that is both efficient in what data it is sending to the cloud, and resilient to short connectivity problems. But what if those connectivity problems persist for more than an hour? That may not be a concern for a smart building or factory, but if your edge is a wind turbine or oil rig it’s a real possibility. Because our devices bucket that gathers raw data only has a 1 hour retention policy, any outage longer than that will result in lost data. We can extend that retention, but then storage space becomes a concern as you’re having to save more and more of that high volume data.
The solution to this problem is to store our smaller downsampled data on the edge for a longer period of time. To do that, we first need a new bucket:
influx config edge
influx bucket create --name northbound --retention 1d
For our new bucket, which we called northbound, we’re using a 1 day retention policy, instead of just one hour. That will allow our edge instance to be disconnected for a full 24 hours before we start to lose data.
The next step is to split our task into two. First, create a new task named aggregate_local, and set it to run every minute. This task will perform the downsampling of data from the devices bucket, and store that in the northbound bucket.
import "influxdata/influxdb/tasks"

option task = {name: "aggregate_local", every: 1m, offset: 0s}

from(bucket: "devices")
|> range(start: tasks.lastSuccess(orTime: -1h))
|> aggregateWindow(every: 5m, fn: mean, createEmpty: false)
|> set(key: "edge_id", value: "001")
|> to(bucket: "northbound")
This task no longer needs to import influxdata/influxdb/secrets, or fetch credentials from the secret store, because it’s writing our downsampled data to a local bucket. In this task we’re performing both the downsampling with aggregateWindow, and injecting our edge_id with the set function, so that the data being written to northbound is exactly what we want being sent to the cloud.
The second task will then read data from the northbound bucket and send it, without modification, to our cloud instance. Create this task with the name sync_northbound and set it to run every 5 minutes.
import "influxdata/influxdb/tasks"
import "influxdata/influxdb/secrets"

option task = {name: "sync_northbound", every: 5m, offset: 0s}

cloud_host = secrets.get(key: "cloud_host")
cloud_org = secrets.get(key: "cloud_org")
cloud_token = secrets.get(key: "cloud_token")

from(bucket: "northbound")
|> range(start: tasks.lastSuccess(orTime: -1h))
|> to(host: cloud_host, org: cloud_org, token: cloud_token, bucket: "edge_devices")
Here we once again use the secret store to retrieve our credentials, but our query doesn’t need the aggregateWindow or set calls, because we’ve already performed those steps before writing data to the northbound bucket.
Conclusion
Now we have InfluxDB running at the edge, collecting data from connected devices (mock ones in this case), storing that data temporarily and the edge while also transmitting it up to another InfluxDB instance running in the cloud. We went through multiple iterations of task scripts to make this process more efficient with downsampling, and more robust to connectivity issues by extending local retention. All of this was accomplished using only InfluxDB and just a handful of lines of Flux script.
But this is only a small taste of what you can do! Once you start tailoring this setup to your own specific needs you can enhance your Flux scripts with smarter downsampling algorithms, enhance your device data with meta-data from SQL servers, trigger alerts based on thresholds or loss of data from devices, and so much more.
