InfluxDB Templates: Easily Share Your Monitoring Expertise
By
Al Sargent
updated December 14, 2025
Product
Use Cases
Developer
Navigate to:
If you’re the resident expert in your company on a particular technology, you probably get asked a lot of questions about it: how to set it up, how to maintain it, how to monitor it. While it’s great to be recognized as the expert, all these requests for help can steal time away from your day job.
Thankfully, we’ve got something that will help: InfluxDB Templates. InfluxDB Templates let you quickly encapsulate and share everything required for InfluxDB to monitor a piece of technology into a single text file in simple YAML format, which can easily be sent via email or Slack, or posted to a code repository like GitHub. InfluxDB Templates define the following:
- Telegraf configuration files
- InfluxDB dashboards
- InfluxDB alerts
- InfluxDB buckets, labels, and variables
Your coworkers can then import that YAML file into their InfluxDB instance with one terminal command, so they can start monitoring in minutes. For example, here’s a Jenkins dashboard that can be imported from this YAML file:

Why use InfluxDB Templates
InfluxDB Templates let you share your practices for monitoring a piece of technology with many coworkers at once, rather than having to individually configure their instances. Because InfluxDB Templates can be imported with one command, they save you hours of tedious, error-prone copying and pasting of configuration information.
You can also share your templates publicly on our public community templates repo on GitHub. By sharing with the community, you get more people reviewing your template, and more feedback to improve it further.
Building your own templates
First, have a look at these templates that have already been built:
For each one of these, check out their .yml file. To quickly understand the structure of these, I find it helpful to search for “kind:”.
For instance, in our Jenkins YAML file, you’ll see the following sections:
| kind: Label | When you import this template, all the new configuration elements will have the tag "jenkins" |
| kind: Bucket | Defines the bucket that your Jenkins data will go into |
| kind: Variable | Defines some variables, such as Jenkins job names and hostnames. |
| kind: Dashboard | Defines your dashboards, both their visual attributes and their underlying Flux code |
| kind: Telegraf | Defines the Telegraf configuration file, in the usual format |
Once you’ve done that, check out the following guides on how to:
We also have a webinar recording on how to build your own templates.
When you build your own template, you’ll want to use our influx pkg command. You can get this when you download InfluxDB 2.0 OSS. You’ll want to run influx pkg export to export your template, and then influx pkg to import a template.
Templates tips
Here are some tips I’ve found helpful when building templates:
Tip #1:
When you build your templates, be sure to optimize your Flux queries per these guidelines. You can also avoid unnecessary cardinality growth using these tools.
Tip #2:
On line charts, consider plotting both median and max (if higher is worse) or minimum (if lower is worse). This can be done using two Flux queries in a dashboard cell, one that aggregates by max (or min) and one that aggregates by median, similar to the examples below. Use the Flux aggregateWindow() function to do this. Another nice side effect of using aggregateWindow() is that it will make your queries run faster, since you’re only sending as much data as required to render a chart, and no more.
Here’s an example of how to do this; it’s for the http_reponse Telegraf plugin, but the pattern will be similar for other Telegraf plugins.
# This plots the max of a time series
from(bucket: "http-response")
  |> range(start: -60m)
  |> filter(fn: (r) => r._measurement == "http_response")
  |> filter(fn: (r) => r._field == "response_time")
  |> group(columns: [""], mode:"by")
  |> aggregateWindow(every: 60s, fn: max)
  |> yield(name: "max")

# This plots the median of a time series
from(bucket: "http-response")
  |> range(start: -60m)
  |> filter(fn: (r) => r._measurement == "http_response")
  |> filter(fn: (r) => r._field == "response_time")
  |> group(columns: [""], mode:"by")
  |> aggregateWindow(every: 60s, fn: median)
  |> yield(name: "median")

# This plots the minimum of a time series
from(bucket: "http-response")
  |> range(start: -60m)
  |> filter(fn: (r) => r._measurement == "http_response")
  |> filter(fn: (r) => r._field == "response_time")
  |> group(columns: [""], mode:"by")
  |> aggregateWindow(every: 60s, fn: min)
  |> yield(name: "min")
Tip #3:
Use Slack as your InfluxDB notification endpoint. The Slack reporting endpoint comes with every edition of InfluxDB, including the free Cloud tier and open source. We’ve already set up a Slack channel on our Influx Community Slack instance.
To use it, add https://hooks.slack.com/services/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 as your incoming webhook URL, as follows:

Once your alerts start firing, go to influxcommunity.slack.com, register if needed, and go to the #notifications-testing channel to see your alerts. You should see something like the following:

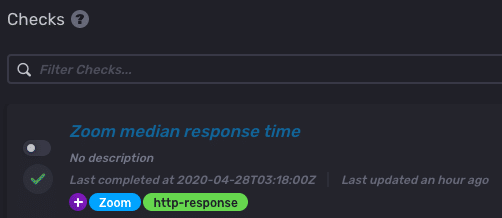
Your exact text will vary depending on what you’ve specified, of course. Just be sure to turn off your checks once you’re done testing, as shown below, so that you don’t make #notifications-testing unusable for others.
Moving beyond the how-to, let’s talk about how InfluxDB Templates fit with larger trends that your organization might be implementing.
InfluxDB Templates and GitOps
Broadly speaking, GitOps is the practice of putting as much of your operations configuration into a code repository like GitHub, BitBucket, or GitLab. It’s essentially taking a practice for developers (code repos) and extending it to operations (config repos).
GitOps makes it easy to track who changed what, and when. This, in turn, makes it easier to find the root cause of any monitoring problems. Because InfluxDB Templates are simply YAML text files, they can be checked into a repo, enabling you to see what’s changed over time, and for others in your organization or open-source community to contribute via pull requests.
InfluxDB Templates and DevOps
In a DevOps culture, there’s an active effort towards driving shared understanding between developers and operations teams, and a shared responsibility for the software they build and run. InfluxDB Templates allow developers to comprehensively define how to monitor a piece of technology they’re intimately familiar with, and share that with the operations teams that need to run that technology in production.
For example, out of the dozens of metrics that MySQL emits, perhaps a developer has learned that only several are really worth tracking, and has built sophisticated alerting checks that define when those metrics indicate something’s wrong. With InfluxDB Templates, that know-how is easy to share across the organization. This saves time for experts in a particular technology, who are continually being asked to help set up monitoring.
InfluxDB Templates and observability
Observability is about keeping watch over all components of complex, dynamic systems, everything from infrastructure to backend microservices to user-facing applications. Because they work for anything that can be monitored by Telegraf, InfluxDB Templates allow you to extend observability across your entire organization. This in turns helps everyone in your organization find and fix problems sooner.
InfluxDB Templates availability
InfluxDB Templates and the influx pkg command are available today for InfluxDB OSS 2.0 and InfluxDB Cloud 2. There is no additional charge for using InfluxDB Templates.
Today we have two dozen templates that are open-source licensed under the Apache 2 license:
- Apache + Postgres
- AWS Cloudwatch
- Counter Strike Global Offensive / CSGO (!)
- Currency Exchange Rates
- Docker
- Endpoint Security State
- Enviro+
- GitHub
- Google Cloud
- HAProxy
- InfluxDB 1.x
- InfluxDB 2.0 OSS (use InfluxDB 2 to monitor itself)
- Jenkins
- Kubernetes
- Linux
- Microsoft SQL Server
- Modbus
- MongoDB
- MySQL / MariaDB
- Network interface
- Nginx + MySQL
- Postgres
- Redis
- Sflow
- Telegraf (use Telegraf to monitor itself)
- Tomcat
- VMware vSphere
- Windows
- X509
- Zookeeper
We expect this list to grow quickly as all of you in the InfluxDB community contribute to our templates repo.
Now, to some of you, the term “templates” might already be familiar. That’s because, for a while, InfluxDB has had dashboard templates. But as the name suggests, these only specify the dashboard layout. They don’t provide an all-in-one definition that includes Telegraf configuration, alerting, buckets, variables, or labels. It’s this complete definition that is new in InfluxDB Templates. Because InfluxDB Templates are broader, they’re much more useful for sharing your monitoring expertise across your organization.
See for yourself
Here’s a demo of how to create an InfluxDB Template:
Once you create that template, here’s how others can use it:
Summary
To recap, InfluxDB Templates let you quickly define your entire monitoring configuration for any technology in one easily-shared, open-source text file that your coworkers can import into InfluxDB with one command. The reasons we’re excited about templates are that they’re:
- Comprehensive: InfluxDB Templates define an entire monitoring configuration: the datasources, the dashboards, and the alerts. This level of detail means your coworkers can get started right away without any time-consuming back-and-forth.
- Developer-oriented: InfluxDB Templates use modern developer tooling you're already familiar with: They're defined in YAML. Distributed via GitHub. Open-source licensed under Apache 2.0. All this makes them easy to work with. This developer orientation helped the Telegraf ecosystem grow to hundreds of plugins, and we're already seeing the same community growth with Templates.
- Faster time to awesome: We've designed Templates to be fast to build and consume. Just tag the resources you want to export, then generate your YAML file with one terminal command. Your coworkers can import that configuration with just one command. Since templates are plain text files, any changes are easy to make.
What next?
Follow the guides above to build your own templates, contribute to our community templates repository, and ask any questions in our ever-helpful InfluxDB community and Slack. Enjoy!
