Introducing the InfluxDB Template UI: Monitoring Made Simple
By
Al Sargent
Product
Use Cases
Developer
Oct 06, 2020
Navigate to:
At InfluxData, we’re obsessed with time to awesome how quickly can you start working productively with time series data? What can we do to make things better?
InfluxDB Templates are a great example of this mindset. Back in April, we announced Templates as a way to package up everything you need to monitor a particular technology Telegraf configurations and InfluxDB Dashboards, Tasks, Alerts, and related artifacts into a single configuration file. This had two benefits:
First, it allowed those of you who are experts with monitoring a particular technology to easily share your expertise with your teammates, and with the world.
Second, it allowed those of you ramping on a new technology to set up your own monitoring in just minutes, so you don’t need to recreate the wheel.
InfluxDB Templates were a big step forward because while InfluxDB has always been more flexible than dedicated monitoring platforms, those platforms come with prebuilt dashboards for various technologies.
With InfluxDB Templates, we’re closing that gap. Since we announced Templates, we now have over 40 Templates for dozens of popular application technologies from AWS to Zookeeper and our community is continually adding more. Each one of these templates shaves hours, if not days, of configuration time spent setting up everything from data acquisition to alerting. That’s a massive accelerator of time to awesome for many of the technologies in your stack.
 <figcaption> Image credit: George Hodan via Needpix.com</figcaption>
Even so, we knew we could do more.
Up until now, to import Templates into your InfluxDB Cloud instance, you needed to use the influx CLI command. But the whole point of any cloud product is to avoid the hassle of installing software.
So we built Template import straight into the InfluxDB Cloud UI.
No software to download. No command line syntax to memorize.
Just copy a link to the Template you want, paste it into the page in your InfluxDB Cloud UI, and you’re done.
Let me show you how.
How to use the InfluxDB Template UI
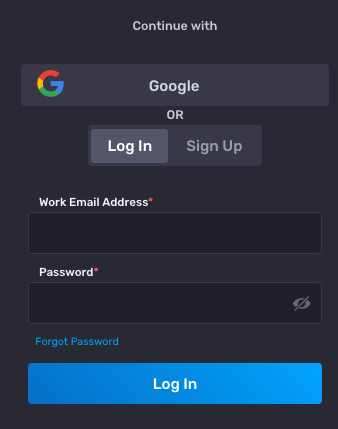
Let’s start at the very beginning. Go to cloud2.influxdata.com and sign in.
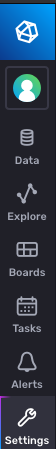
Next, click on Settings on the left side of your browser:
Then click on Templates:
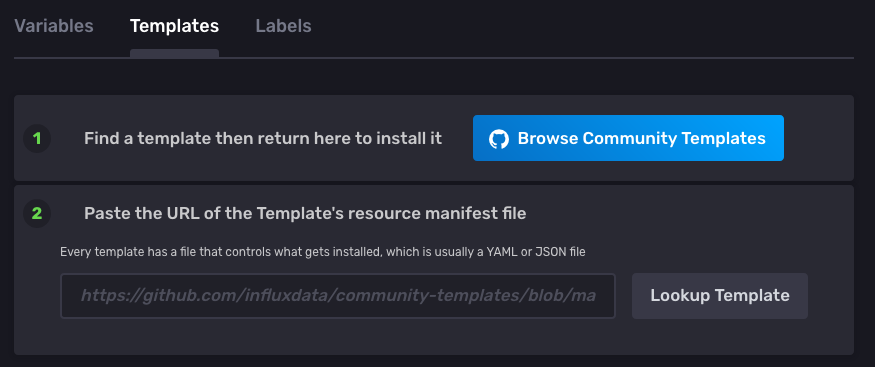
You can probably guess what to do next, given the big blue button: Browse Community Templates.
You’ll get dropped onto our GitHub page listing all our templates. Let’s click on the Network Interface Monitor template:
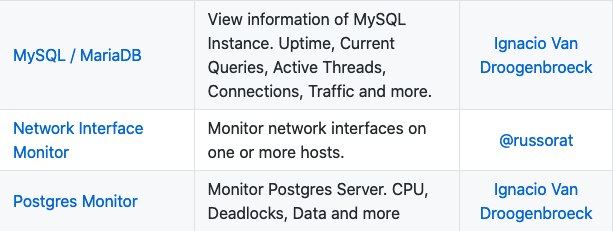
This is a nice template to start with, since it can use actual network monitoring data from your Mac or Linux machine.
Every InfluxDB Template is defined by a YAML, JSON, or Jsonnet file. This particular network monitoring template is defined by a YAML file, network_interface_performance.yml. Click the link:
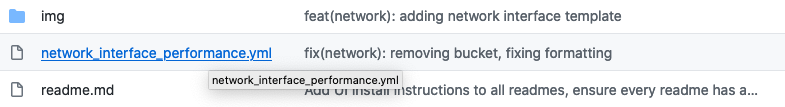
Copy the link from your browser’s address bar:
then switch back to InfluxDB Cloud, and paste in the link:
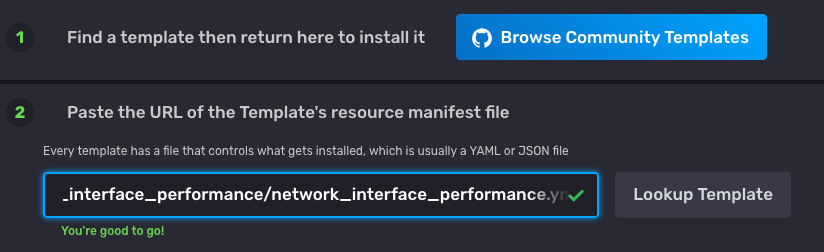
You should see a message stating that you’re good to go.
(Digging into this, I learned that both the URL to the HTML page and the URL to the raw file both work. That’s our engineering team sweating the details so you don’t have to. )
Click on Lookup Template, and you’ll see all the various resources associated with the template:
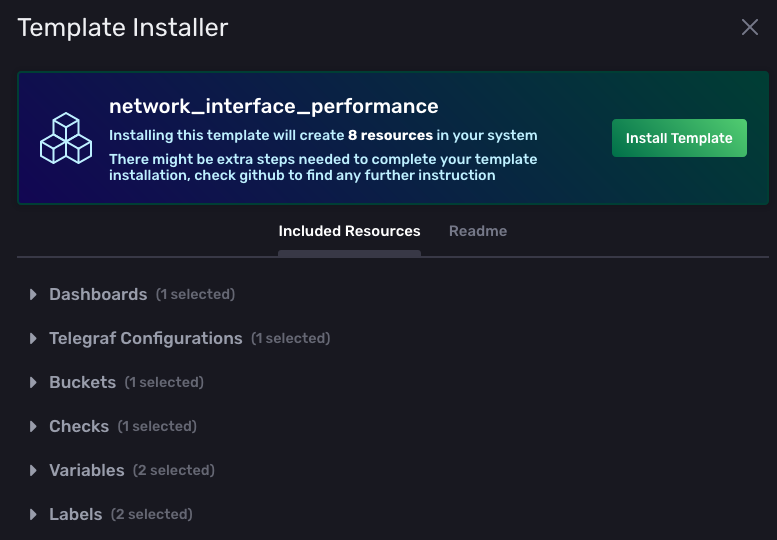
Now hit that big green button and install your template! ????
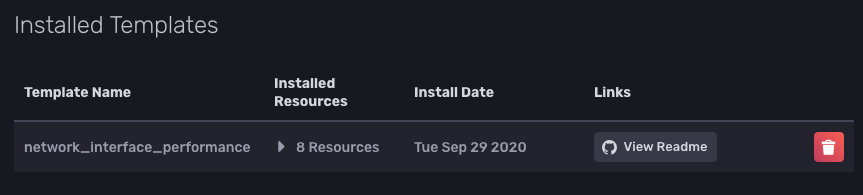
Once you do, you’ll see the template in your installed list:
Set up Telegraf to monitor network performance
At this point, our Dashboard, Check, Bucket, Variables, and Labels are all installed as part of our template. But we need to get Telegraf to start sending data to our InfluxDB Cloud instance.
If you’re not familiar, Telegraf is our open-source, plugin-driven server agent for collecting & reporting metrics. Telegraf has plugins to source a variety of metrics directly from the system it’s running on, pull metrics from third party APIs, or even listen for metrics via StatsD or Kafka consumer services. It also has output plugins to send metrics to a variety of other datastores, services, and message queues, including InfluxDB.
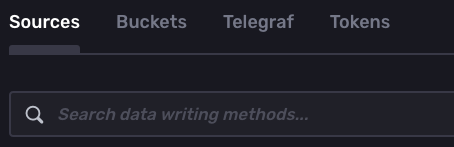
To start the process of setting up Telegraf, click on Data on the left side of your browser window:

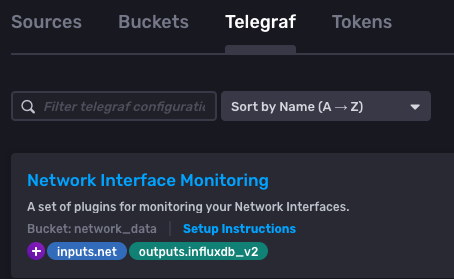
Then click Telegraf:
We’ll see our newly installed Network Interface Monitoring configuration:
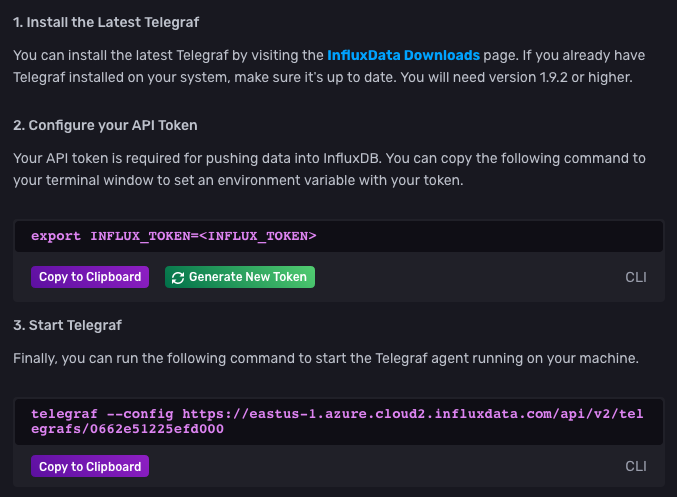
Click on Setup Instructions. You’ll see the following:
Here we need to perform some non-cloudy tasks, installing software Telegraf on your machine. This could be your laptop, an EC2 instance, or whatever server for which you want to track network traffic.
The reason we need to do this local software install is that our machine is (hopefully!) behind a firewall and thus not reachable by InfluxDB Cloud. By installing Telegraf on a local machine, it can send data through our firewall and out to InfluxDB Cloud.
Let’s walk through each of these steps.
First, get Telegraf. If you’re monitoring a Mac, get Homebrew if you don’t have it (trust me, it’s handy), then run brew install telegraf. If you’re monitoring something else, here are instructions for how to install Telegraf on other operating systems.
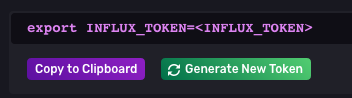
Next, get an InfluxDB API token by clicking Generate New Token:
This token is sort of like a password that Telegraf uses when sending network performance data (or other telemetry) to InfluxDB.
If you’re on Mac or Linux, press Copy to Clipboard:
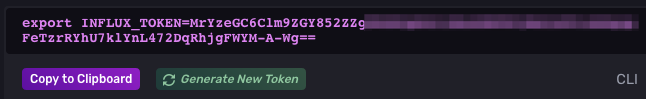
and a token will get generated for you. Then open a terminal window (here’s how on Mac) and paste the command you just copied:
export INFLUX_TOKEN=MrYzeGC6C1m9ZGY852ZZgaKai8t1iQBRk9BlAh8oRkUM2f1RhNgM_UJgsFeTzrRYhU7k1Ynl472DqRhjgFWYM-A-Wg==
(Of course, replace the token value with whatever’s associated with your cloud account.)
You also need to specify two more environment variables, INFLUX_URL and INFLUX_ORG.
The INFLUX_URL environment variable specifies the URL of your InfluxDB Cloud instance. This is necessary since InfluxDB Cloud runs multiple cloud providers AWS, Google, and Microsoft Azure as well as different regions on each. You can find the appropriate URL for your instance on the InfluxDB Cloud URLs page.
For example, if you’re running on our new Azure East US instance, enter this into your terminal window:
export INFLUX_URL="https://eastus-1.azure.cloud2.influxdata.com"
Note that I put quotes around the cloud URL, whereas I didn’t with the token.
Next, set the INFLUX_ORG environment variable. If you created your own InfluxDB Cloud instance, this will be the email you use to sign in. On the other hand, if you got an invite to InfluxDB Cloud, here’s how to find your org name. You’ll type something like:
export INFLUX_ORG="[email protected]"
You can confirm whether it’s set by typing the env command. Pipe it through sort to quickly pick out the variable from a long list:
env | sort
You should see something like this:
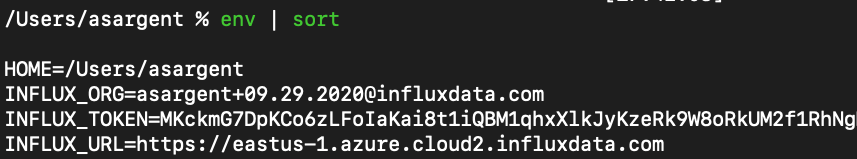
If you’re on Windows, you’ll need to export these variables using a different command syntax. Here’s how to set and view environment variables in PowerShell and how to set and view them in the Windows command prompt.
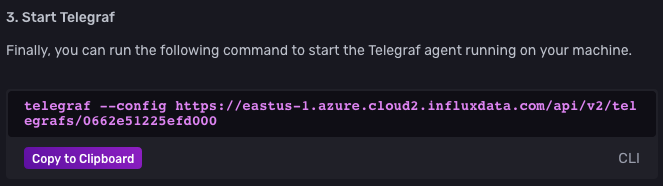
Run Telegraf to monitor network performance
Anyways, once your InfluxDB environment variables are set, switch back to the InfluxDB Cloud UI, and copy your command to start Telegraf:
You should see something like this:
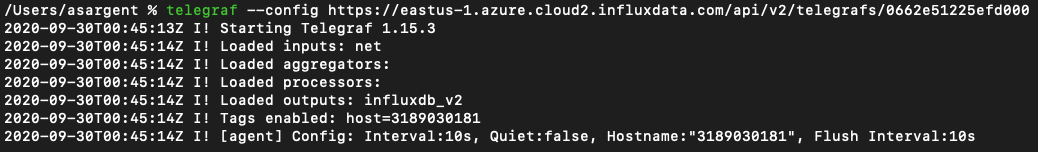
Parsing this output, you see the following has happened:
- Telegraf version 1.15.3 started up.
- One Telegraf input plugin loaded: the Net Input Plugin.
- One Telegraf output plugin loaded, the InfluxDB v2 plugin (this is what you use for InfluxDB Cloud and InfluxDB OSS v2); for InfluxDB OSS v1 and InfluxDB Enterprise, use the InfluxDB output plugin.
- Telegraf is collecting metrics every ten seconds.
View your Template dashboards
Now that Telegraf is sending data to InfluxDB Cloud, let’s see our dashboards in action!
Switch back to InfluxDB Cloud, and click on Boards on the left side. You’ll see the Network Interface Performance dashboard that was imported with our template.
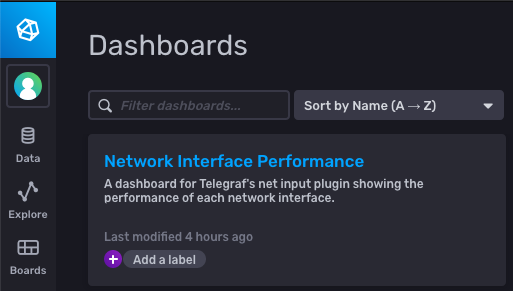
Click Network Interface Performance and you’ll see charts of your network performance:
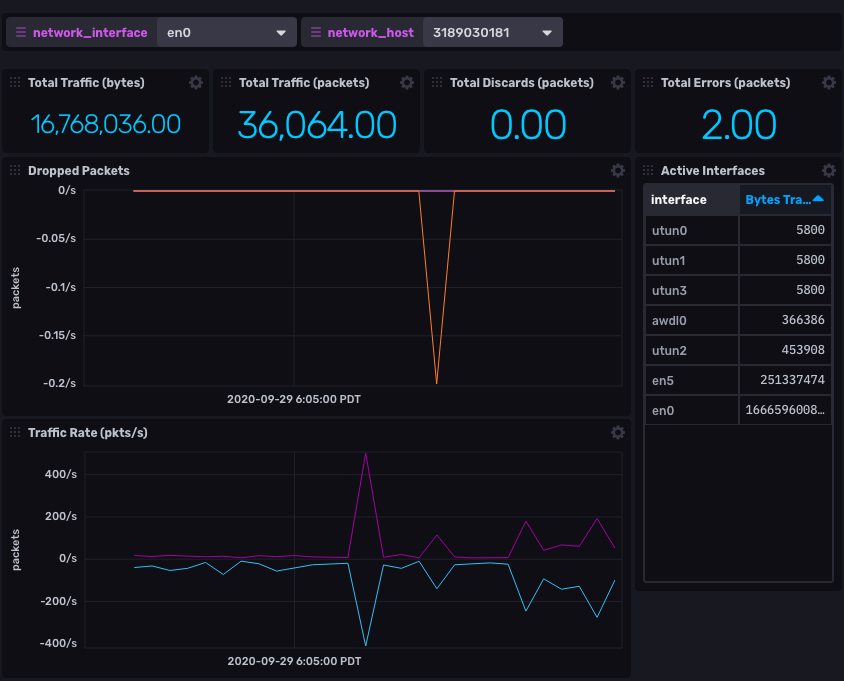
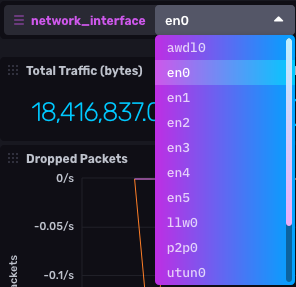
Note that some of your network interfaces might be inactive and show no data. My laptop defaulted to network interface awd10, so it was a simple matter of choosing en0:
Send InfluxDB alerts to Slack
Dashboards are great. But what if we get network errors how will we know?
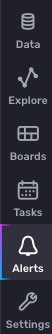
For that, let’s set up alerting to Slack. To do this, click on Alerts:
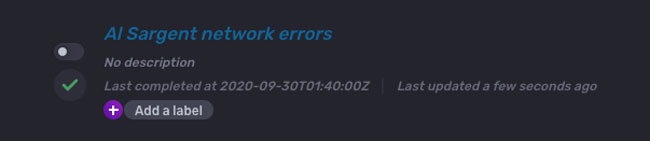
You’ll see that our template included an alert checking for Network Errors:
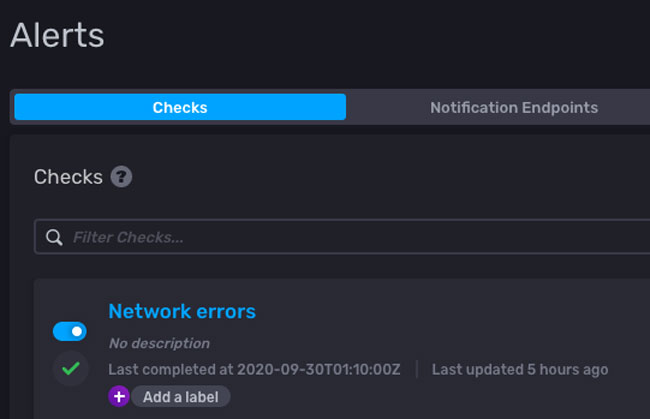
If you click Network errors, you’ll see that this check runs every 10 minutes, and displays a warning message when there have been 10 network errors in that time, and a critical message when there’ve been 20 errors.
But, we need to send these notifications somewhere. Thankfully, the InfluxDB Community Slack has a sandbox you can play with. If you haven’t already done so, get Slack, then join the InfluxDB Community on Slack.
In Slack, head to the channel #notifications-testing, and you’ll see a webhook URL that you should copy:
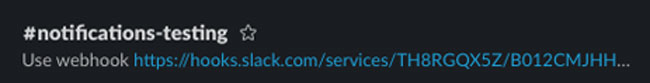
As I write this, the webhook URL is the following:
https://hooks.slack.com/services/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
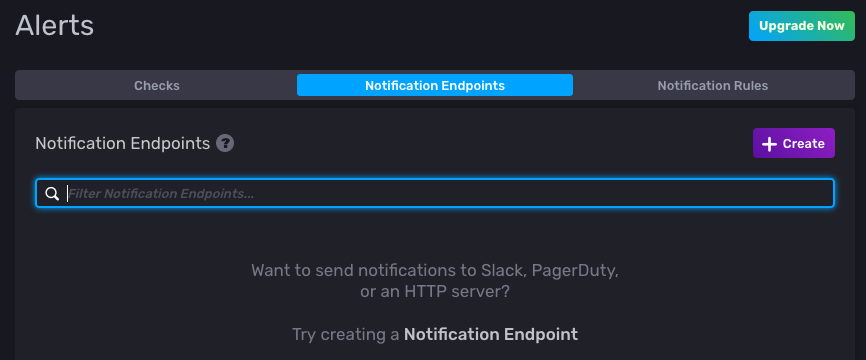
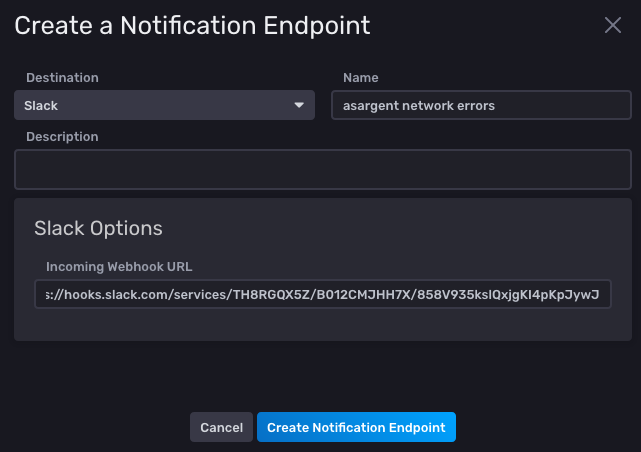
Flip back to InfluxDB Cloud, then click Notification Endpoints, then Create:
In the next screen, name your endpoint and fill in the URL above:
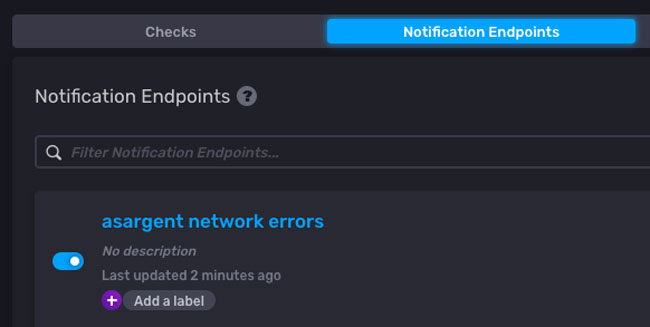
Click Create Notification Endpoint and you’ll see your newly created endpoint:
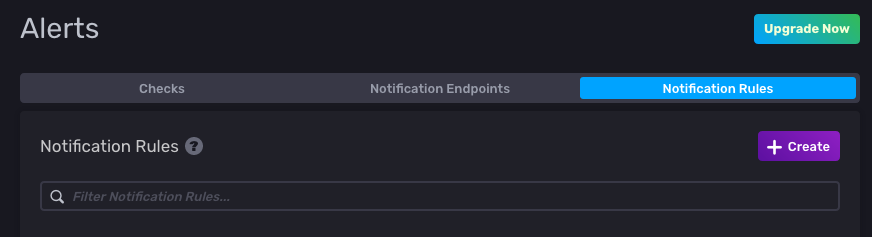
Now switch over to Notification Rules and press Create:
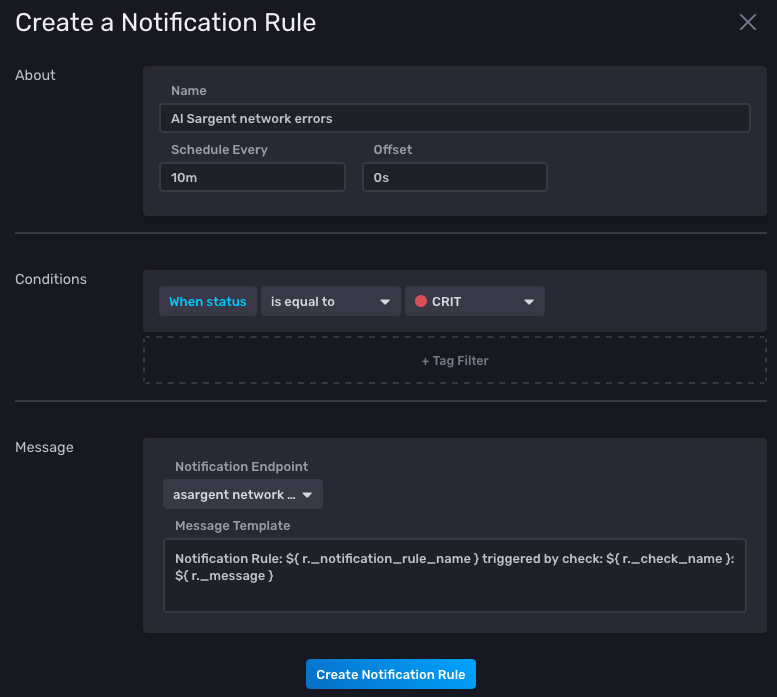
Name your notification rule. To be polite in the sandbox, include your personal name in the notification rule name, like I did below:
Press Create Notification Rule, and you’ll see list of notification rules:
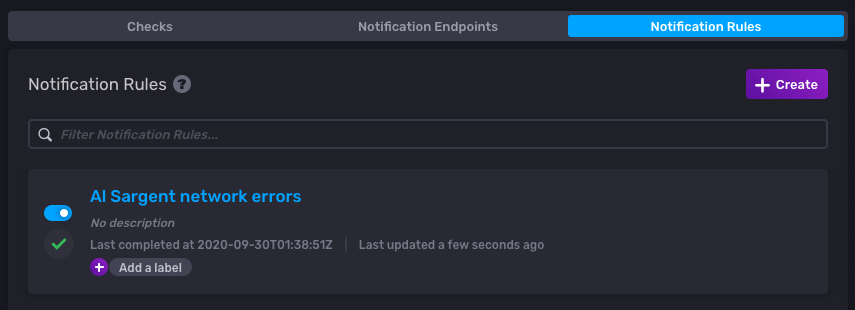
When you have more than 20 network errors in a 10-minute period, a message will get posted to InfluxDB Community Slack’s #notifications-testing channel.
Now this is important when you’re done testing, TURN OFF your notification rule by clicking the toggle button on the left.
Share your expertise with InfluxDB Templates
We’re grateful that we’ve gotten 40 templates in just seven months, including:
- Apache JMeter
- Apache + Postgres
- Apex Legends
- AWS Cloudwatch
- Counter Strike Global Offensive / CSGO
- Currency Exchange Rates
- Docker
- Downsampling
- Endpoint Security State
- Enviro+
- Fortnite
- GitHub
- Google Cloud
- HAProxy
- InfluxDB 1.x
- InfluxDB OSS 2.0
- JBoss Wildfly
- Jenkins
- Kafka
- Kubernetes
- Linux
- Microsoft SQL Server
- MinIO
- Modbus
- MongoDB
- MySQL / MariaDB
- Network Interface
- Nginx + MySQL
- Postgres
- Redis
- Sensu Go
- sFlow
- SNMP
- Speedtest (local Internet connection speed)
- Telegraf (use Telegraf to monitor itself)
- Tomcat
- VMware vSphere
- Windows
- X509
- Zookeeper
But we’d love to get even more templates. So, for anyone who builds an InfluxDB Template that gets committed to our repository, we’re offering InfluxDB Inventor status and a cool, limited-edition Inventor t-shirt even our CEO can’t get one! (Sorry, Evan.)

So, if you’ve created a Telegraf configuration, dashboard, tasks and/or alerts for any technology not listed above, create your own InfluxDB Template and then follow these steps to submit your template.
Conclusion
As mentioned, we continually focus on time to awesome. That’s because we’re inspired by others that have followed a similar path of making technology accessible:
Friendly reminder to startups: customers don't care about how brilliant your technology is. They only care about how simple your solution is. Focus on the latter at all costs.
Aaron Levie (@levie) September 29, 2020
In the time series database market, plenty of vendors focus on speeds and feeds but little else. InfluxDB handles massive amounts of time series data for instance, millions of metrics per second at Wayfair but we realize that the most brilliant time series technology is nothing if you can’t use it. That’s why we’ve invested in making time series data easy to use and will continue to do so. Our new templates UI is just one step in that process.
If you’d like to check out the InfluxDB Template UI for yourself, sign up for a free InfluxDB Cloud account, and feel free to ask any questions in our ever-helpful InfluxDB community and community Slack channel. Enjoy!
