Introducing Flux Editor in Chronograf
By
Russ Savage
updated December 14, 2025
Company
Product
Navigate to:
Fastest time to awesome - this is the internal mantra that we repeat to ourselves at InfluxData to make sure that the products and features we’re building help developers harness the full power of their metrics and events data in as little time as possible.
InfluxQL is the SQL-like language that developers and users have been using to query data from InfluxDB. Of course, ‘like SQL’ and ‘true SQL’ are very different and we’ve certainly heard complaints from the community and customers about this. There are many queries someone familiar with SQL in a traditional relational model can’t write in InfluxQL. InfluxDB is a Time Series Database, and it is designed to meet the specific needs of time series data, namely high ingestion rates and real-time analysis of data. If you’ve ever tried to join data from different measurements, or run complex group bys in an InfluxQL query, you know what I mean.
Because of this, we have seen our users build custom application logic on top of our platform to accomplish these tasks. There’s nothing fast or awesome about that solution. We want to help our users by offloading that additional layer so that they can focus on the insights and business value gleaned from the data, instead of the logic for querying and combining it.
(Re-) Introducing Flux
This is the reason we’ve created Flux. After more than 5 years of working with time series data and appreciating the best that even true SQL has to offer, we believe that SQL itself is the wrong approach for dealing with time series data. Flux is a new language, purpose-built for querying and manipulating time series data. It has been built from the ground up to be incredibly flexible and solve the major shortcomings in InfluxQL. Using Flux, you can do math across multiple measurements in your data, complex joins, and much more.
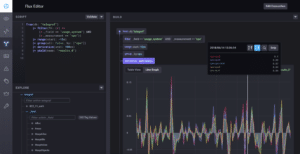
As the user interface to the InfluxData platform, Chronograf has added a new Flux Editor that we believe is the best way to get started with the new query language.
You can begin exploring this now via the nightly build for Chronograf available on the downloads page. The Flux editor is available from the left menu once you log into Chronograf.
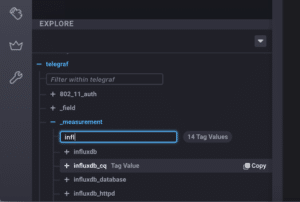
Explore the Shape of Your Data
Flux introduces users to a set of new concepts for how their data is organized. One of the first things users do with Chronograf is to explore the shape of their data. We’ve added a data explorer tool directly in the Flux Editor which allows you to quickly find what you need to build out the perfect query.
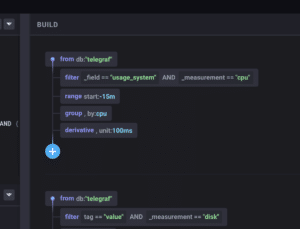
Visualize Your Queries
One of the best ways to spot issues with your queries is to see them parsed visually. You can quickly identify syntax errors, and seeing things broken out visually is tremendously valuable to users that aren’t comfortable with Flux queries just yet. The new editor seamlessly converts your Flux queries into a visual diagram for you to quickly learn how everything fits together. Of course, if you make a mistake, the editor window also notifies you with an alert and points you in the right direction.
Yield All the Things
In Flux, every function accepts and returns a table. That means you can use the yield function to view the results of your query at any point within the transformation. The Flux Editor makes it easy to visualize those results by allowing you to add temporary yields anywhere in your query with just the click of a mouse. This allows you to instantly see intermediate results of your query and lets you quickly make changes if needed as you progress to the final result.
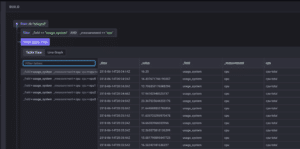
Start with Something Familiar
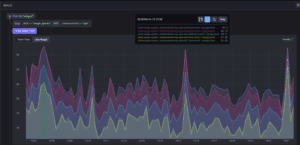
Usually, the first InfluxQL query a user creates is something like a simple query for cpu values over time. This line graph gives users a good base from which to start as they move on to more complex queries. We want to make sure experienced InfluxQL users have a good starting point in Flux as well, so we’ve made it easy to visualize your results as a line graph in the same way you would previously. We’ve also added a tabular view of the results as well to get users comfortable with the CSV format being returned in queries.
Just the Beginning
Flux is an incredibly powerful tool for querying and manipulating time series data stored within InfluxDB, and we want users to be able to leverage that power as quickly as possible. We are dedicated to building the best Flux query experience possible and want your feedback to make that happen. We want to hear from you! What are the things you love or hate about the editor? How could we make your workflow smoother? Let us know by filing bug reports in the Chronograf repo and asking questions on our Community site.
