An Introduction to Apache Superset: An Open Source BI solution
By
Jay Clifford
Product
Use Cases
Getting Started
Dec 28, 2022
Navigate to:
With native SQL support coming to InfluxDB, we can broaden the scope of developer tools used to analyze and visualize our time series data. One of these tools is Apache Superset. So let’s break down the basics of what Superset is, look at its features and benefits, and run a quick demo of Superset in action.
What is Apache Superset?
Apache Superset is an open-source data exploration and visualization platform. Originally started as a hack-a-thon project by Maxime Beauchemin while working at Airbnb, Superset entered the Apache Incubator program in 2017. Apache Superset is similar to enterprise business intelligence solutions, such as Power BI and Tableau, as opposed to other dashboarding software. This is due to its emphasis on data analytics and exploration, so bear this in mind if you are looking for a simple real-time dashboard solution.
Apache Superset is based on a Dataset-Centric methodology, which lies firmly in the middle of a query-centric and semantic-centric architecture.
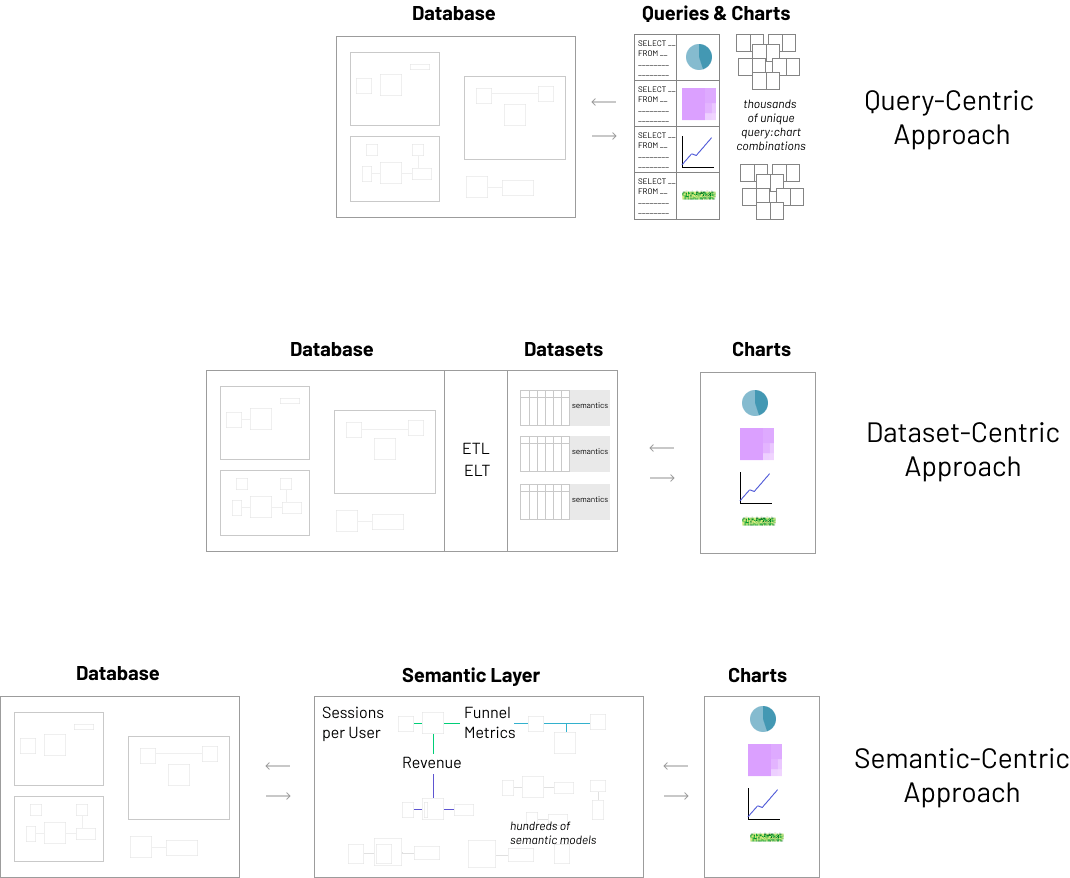
This architecture promotes the use of datasets that are similar to a Pandas Dataframe but with some further enrichment. Essentially, what we end up with is an enriched tabular structure that contains a subset of semantic characteristics:
- Labels and descriptions of the dataset and columns
- Metrics as aggregated SQL expressions (AVG, MAX, COUNT)
- Timezone and time granularity support
- Definitions for which columns can be aggregated and filtered on
This quote from The Case for Dataset-Centric Visualization ties up the dataset approach neatly:
“The dataset metaphor offers a simple and safe “dimensional” playground. In the dataset-centric approach, all charts are built from these datasets that contain a comprehensive collection of relevant dimensions and metrics. This enables users to self-serve within that context. Your team members can typically slice and dice, which entails superpowers like applying arbitrary filters, drilling into dimensional details, drilling through to atomic rows, and choosing the right visualization.”
Apache Superset features and benefits
Now that we have an understanding of what Apache Superset is, let’s take a look at some of its core features and benefits.
Rich visualization library
Apache Superset currently supports 50+ visualization types to experiment with. These cover a variety of data types and use cases. For time series use cases specifically, I would make sure to check out the following visualization types:
- Basic: Time series Bar Chart, Time-series Line Chart, Time-series Scatter Plot
- Intermediate: Histogram, MapBox, Big Number with Trendline, Time-series Table
- Advanced: Calendar Heatmap, Radar Chart, Nightingale Rose Chart
Remember Apache Superset visualizations present a “swiss army knife” of options, so make sure to choose the best visualization to fit your use case. We will explore how and when to use certain visualizations in another blog.
Versatile backend support
Apache Superset supports a large range of databases through SQLAlchemy (plus any required drivers). Support for Apache Superset in the new InfluxDB IOx storage engine is currently in development (specifics will be discussed in a future blog). Apache Superset also provides direct file ingest for formats such as JSON, CSV, Excel, and columnar files.
Customization and deployment
Apache Superset’s cloud-native design makes it scalable. It promotes high availability and deployment support for distributed architectures. Superset also promotes a flexible modular architecture, which lets you choose the right components for your deployment:
- webserver (Gunicorn, Nginx, Apache)
- metadata database engine (MySQL, Postgres, MariaDB, etc)
- message queue (Redis, RabbitMQ, SQS, etc)
- results backend (S3, Redis, Memcached, etc),
- caching layer (Memcached, Redis, etc),
Apache Superset also allows users to create their own custom visualizations via their visualization plugins feature. These plugins can be created in JavaScript or TypeScript.
Apache Superset tutorial
With the new InfluxDB IOx storage engine quickly approaching general release, it won’t be long until you can deploy Apache Superset as part of your solution. In the meantime here is a small taste of what is possible with InfluxDB and Apache Superset:
First of all, we use the integrated SQL Lab to query against InfluxDB:
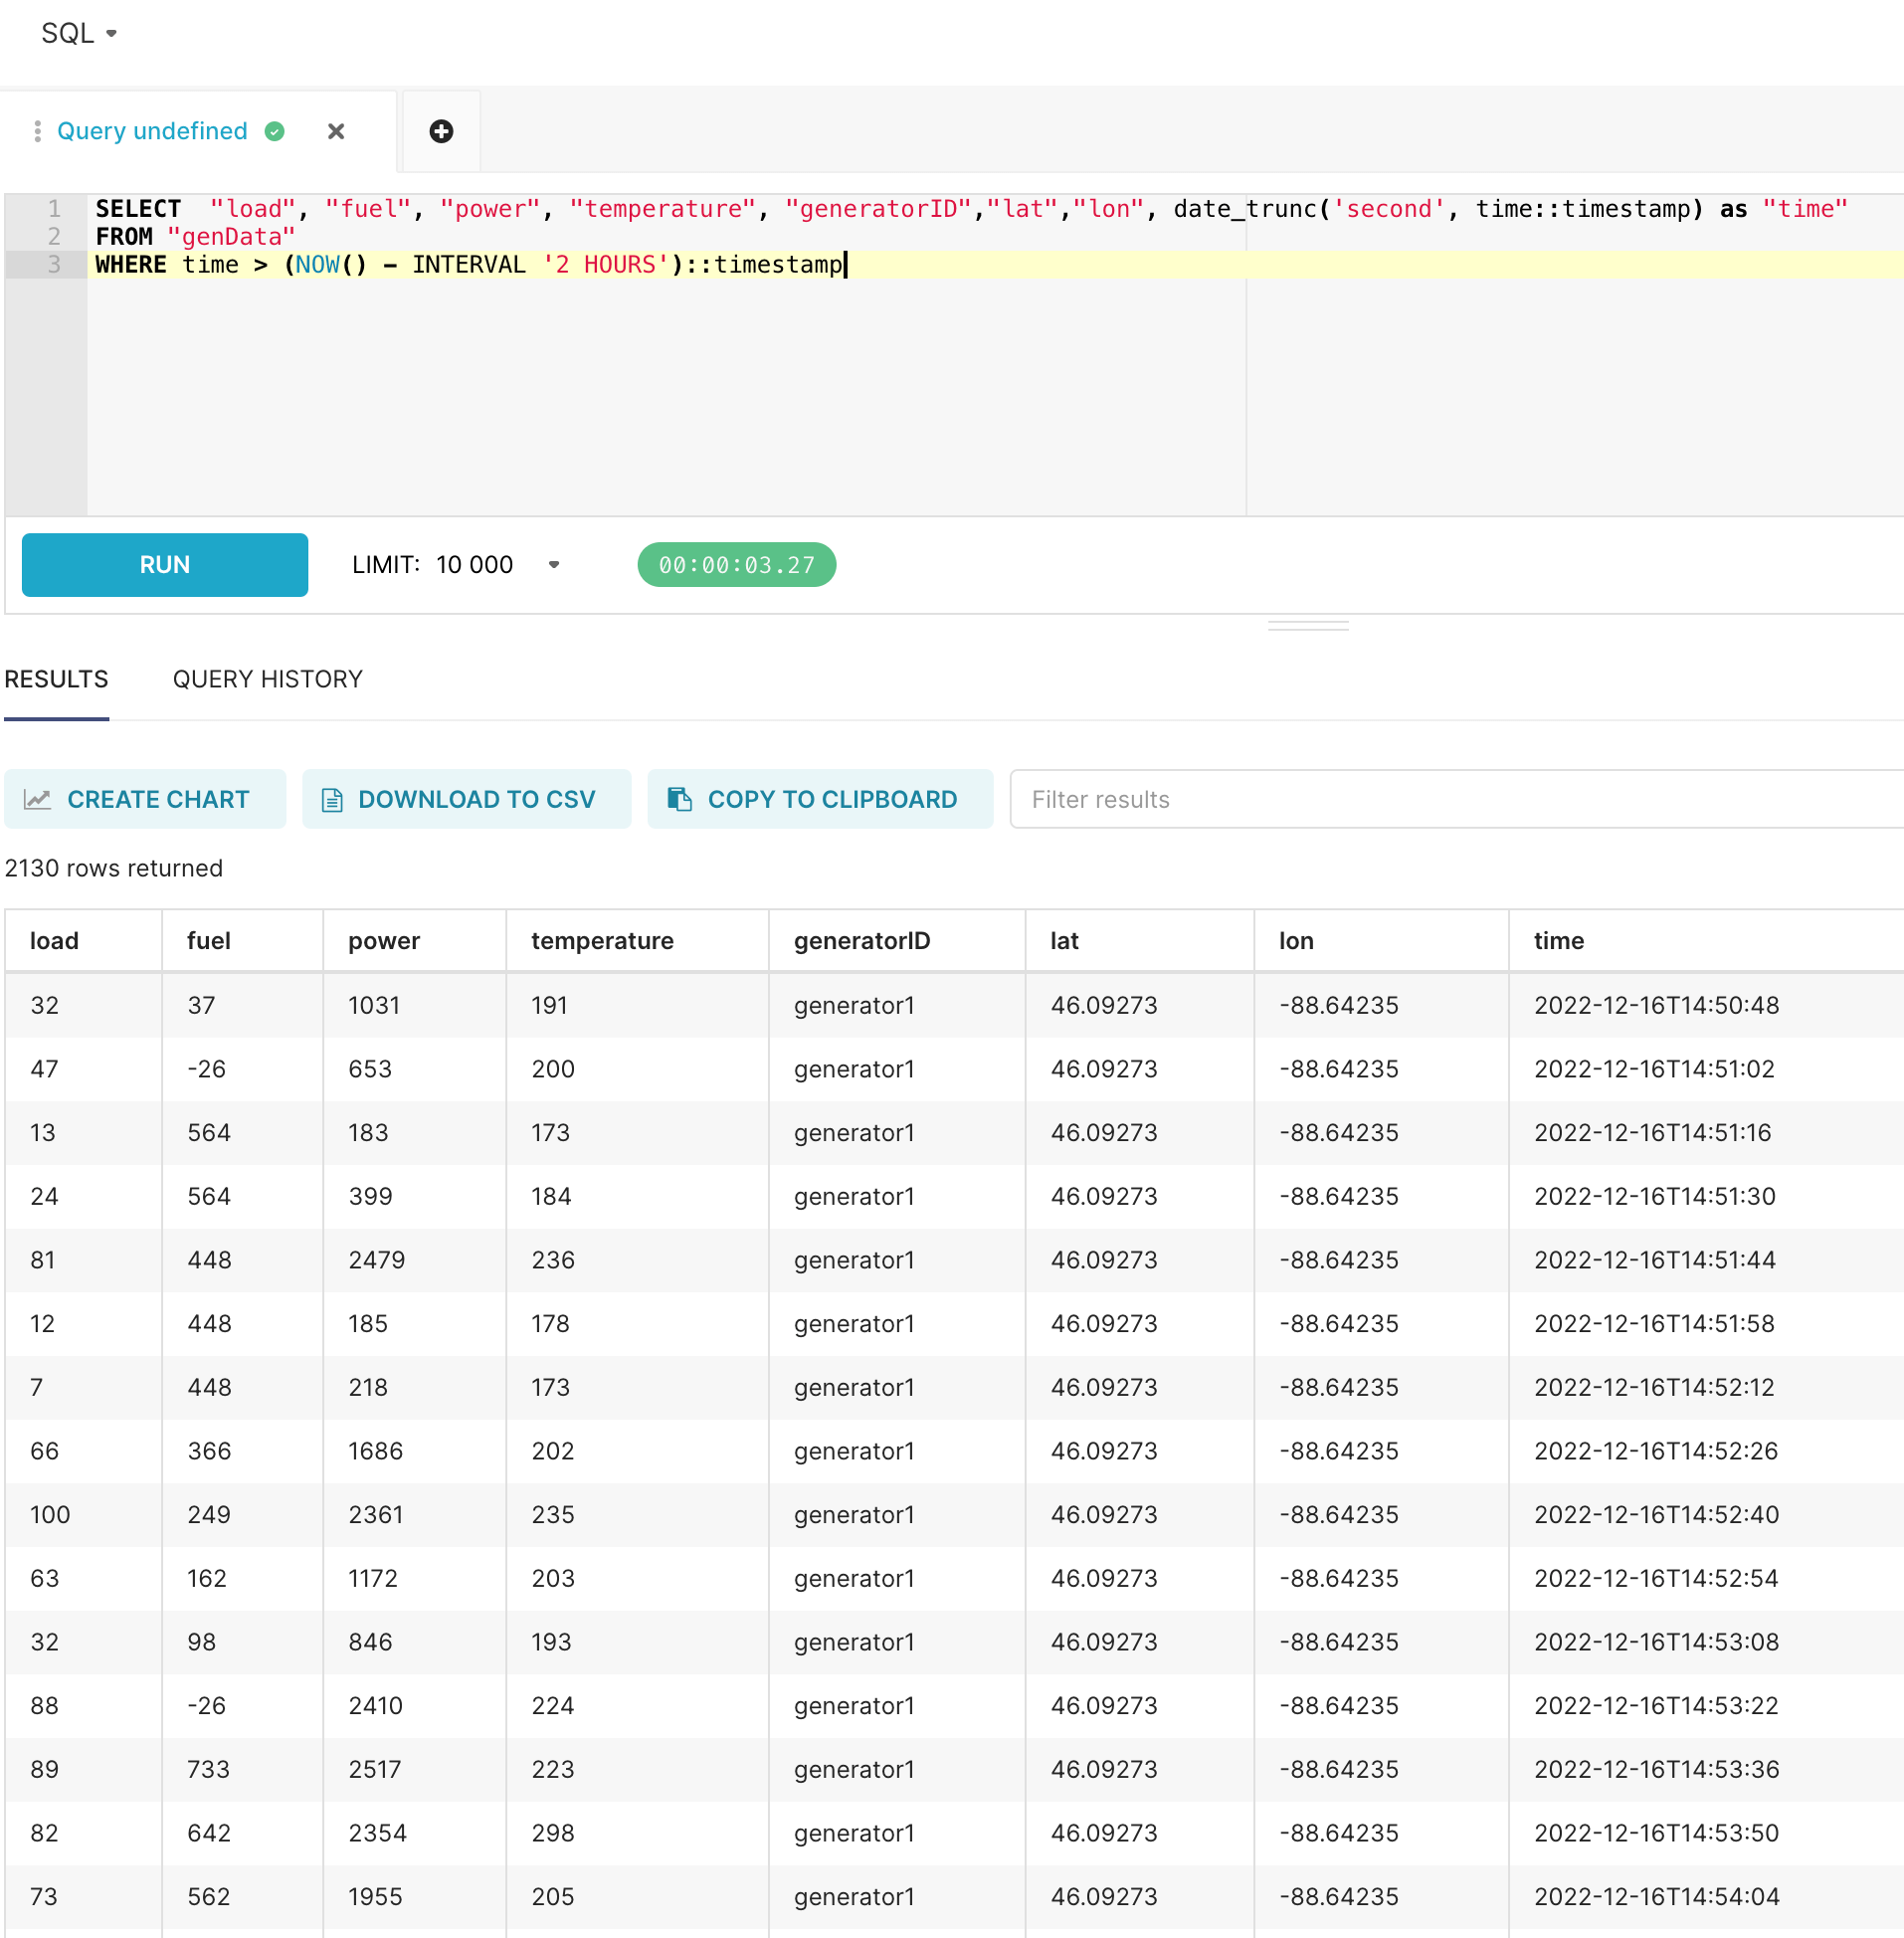
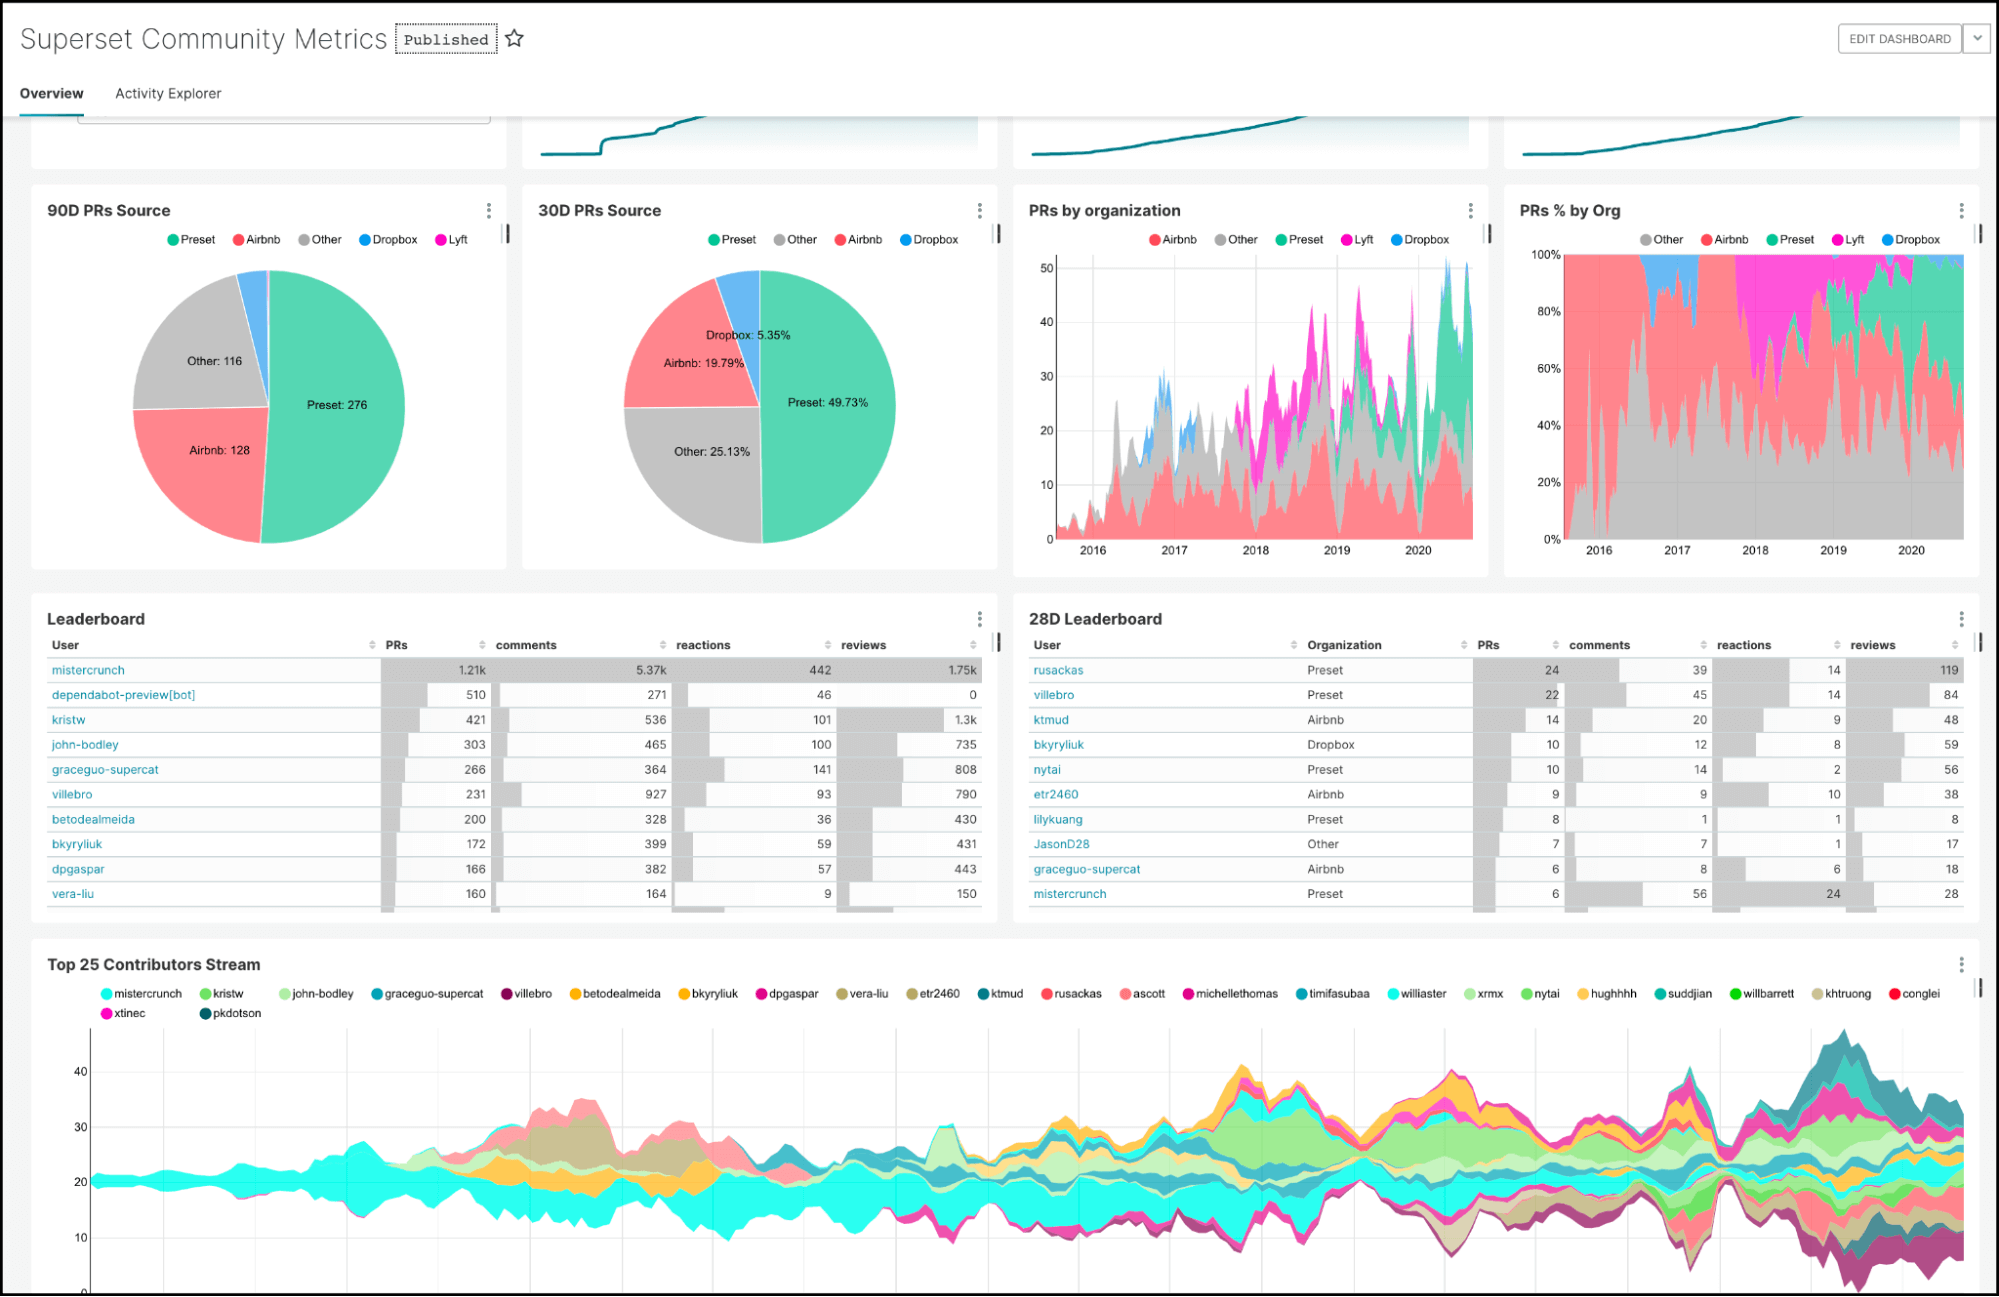
Our dataset is based on an IoT simulator for Emergency Power Generators. We save this as an Apache Superset dataset for further manipulation and visualization.
The graph creator provides a low-code interface for selecting and creating your visualization for your dataset. In this case, to keep it simple I am using the Mixed-Time Series visualization:
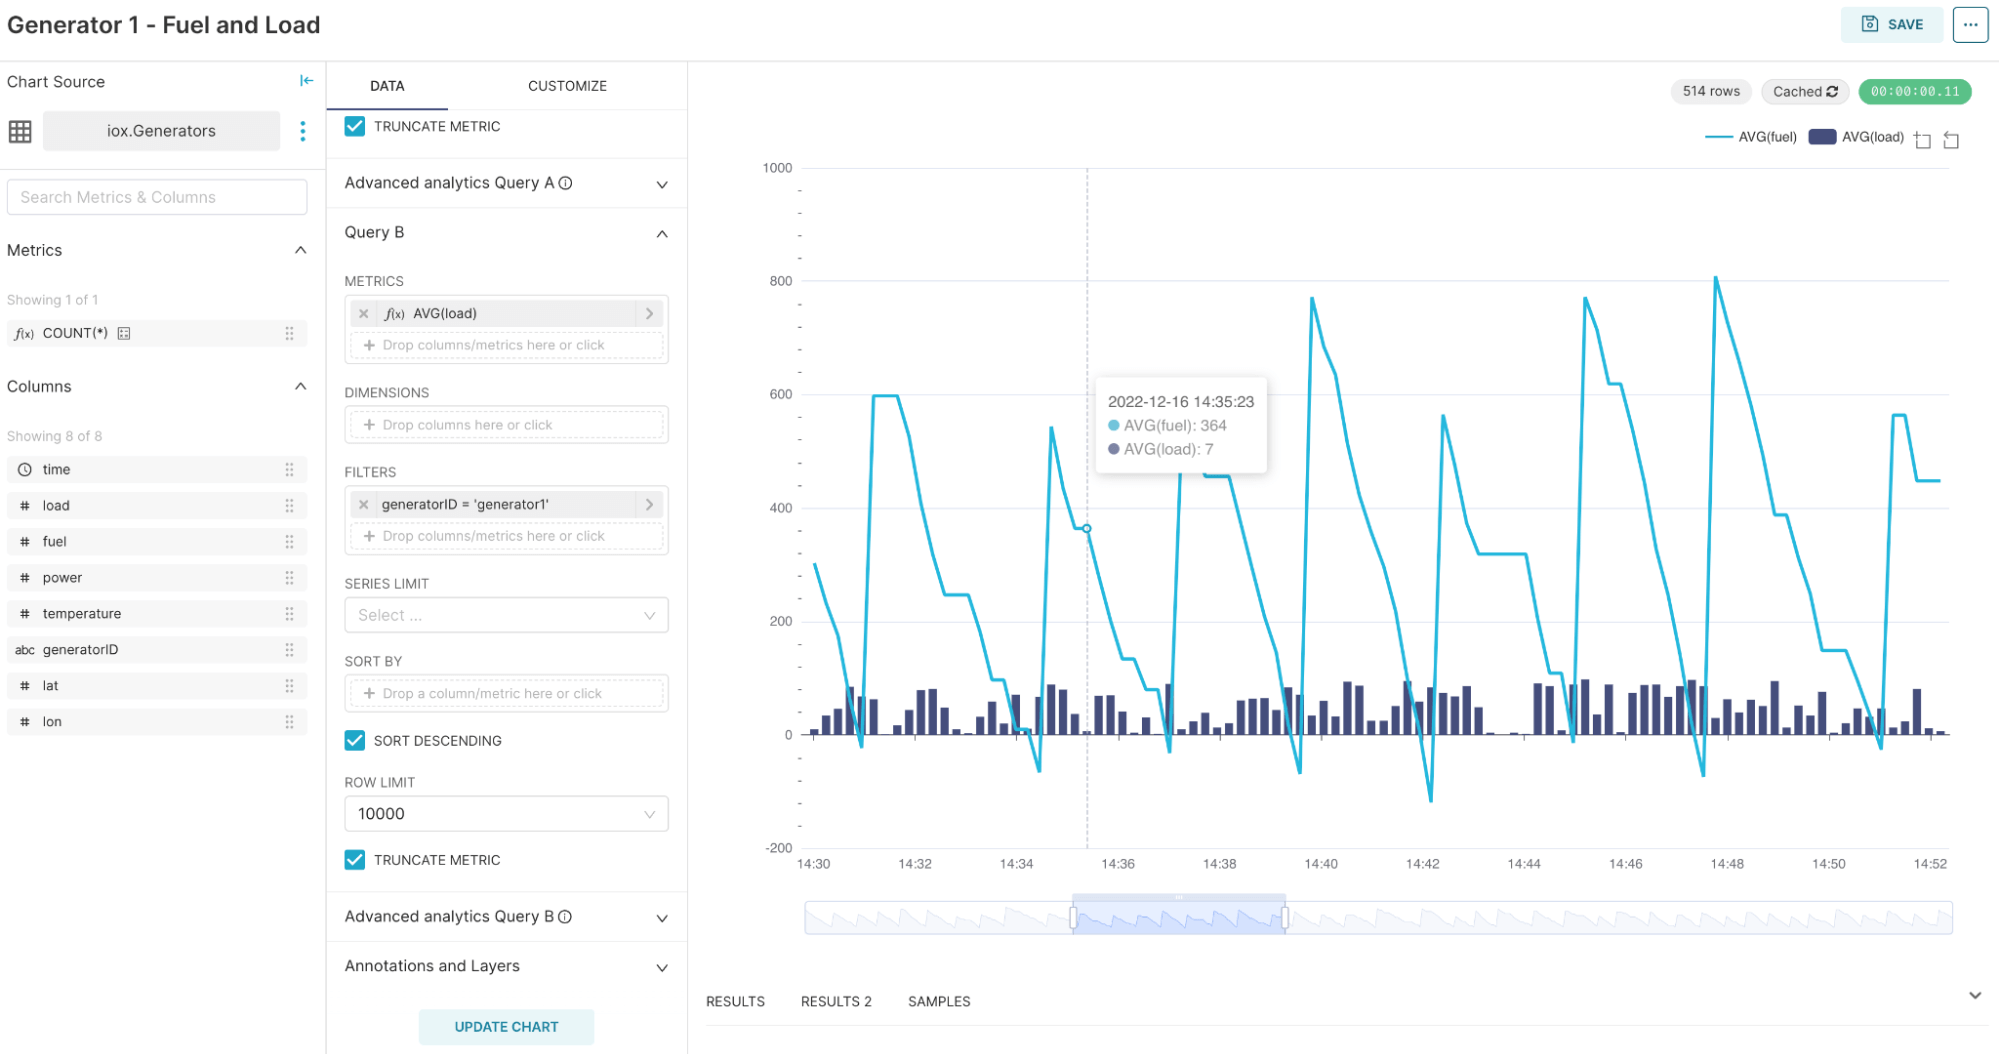
You can see that based on the dataset, we can allocate fields as metrics, tags as dimensions or filters with a simple drag-and-drop interface. From there we can save our new visualizations directly to a dashboard:
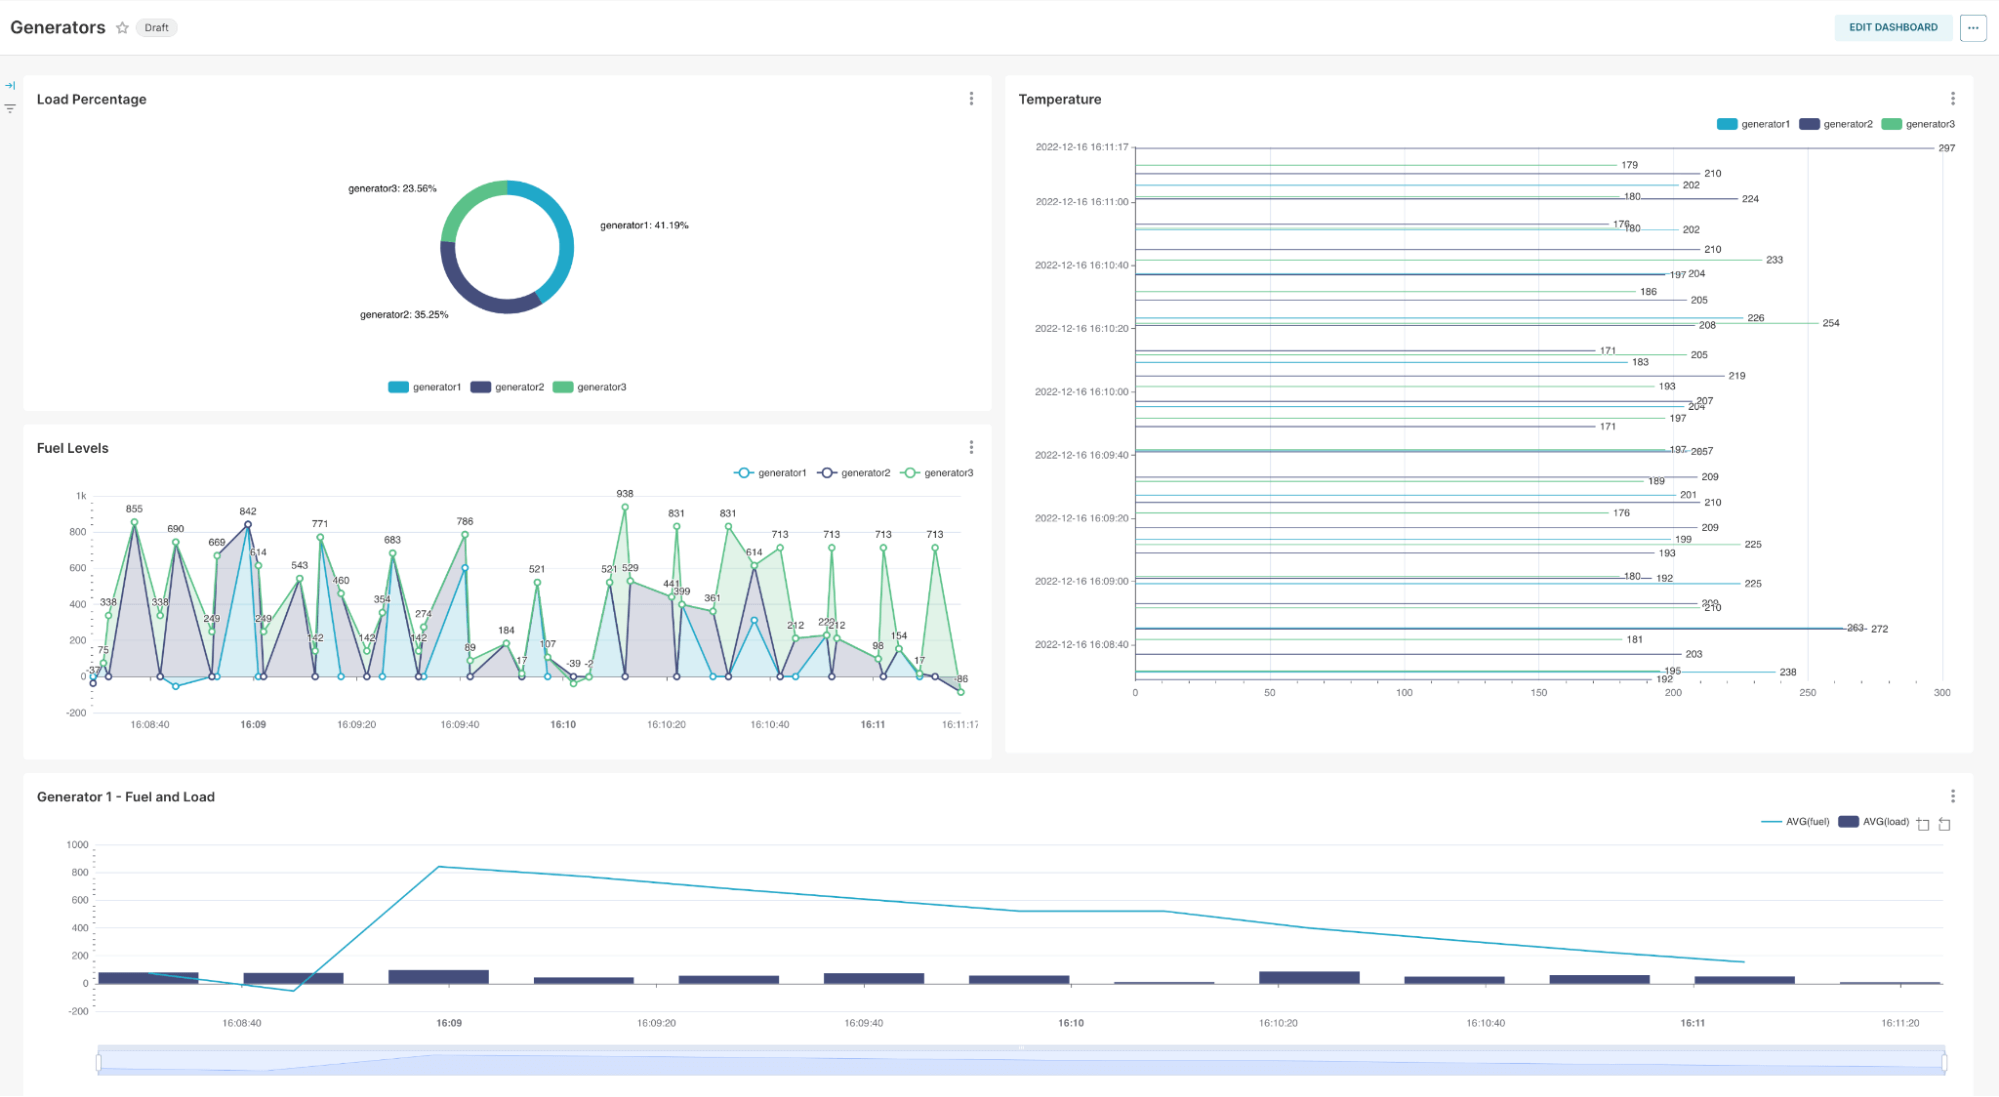
Dashboards offer you extended functionality such as auto-refresh, advanced filtering, and email reports, but we will save that for another blog.
Conclusion
I hope this blog sparks your interest to investigate Apache Superset. It is a powerful business intelligence platform that provides equivalent functionality to the industry giants (Power BI and Tableau). The best part? It’s all based on open-source technology. Are you using Apache Superset? We would love to hear from you, so come join us on Slack and the forums. Share your thoughts — I look forward to seeing you there!
